Received 25 October 2018; editorial decision 22 February 2019; accepted 11 April 2019; published online April 27, 2019.
Presented in part: 23rd Conference on Retroviruses and Opportunistic Infections, Boston, Massachusetts, February 2016.
Correspondence: A. M. Dennis, MD, 130 Mason Farm Road, Suite 2115, Chapel Hill, NC 27599-6134 ([email protected]).
DOI: 10.1093/infdis/jiz176
Human Immunodeficiency Virus Type 1 Phylodynamics to
Detect and Characterize Active Transmission Clusters in
North Carolina
Ann M. Dennis,1, Stéphane Hué,2, Rachael Billock,3 Sara Levintow,3 Joseph Sebastian,4 William C. Miller,5 and Joseph J. Eron1,3
1Division of Infectious Diseases, University of North Carolina at Chapel Hill; 2London School of Hygiene and Tropical Medicine, United Kingdom; 3Department of Epidemiology, University of North
Carolina at Chapel Hill; 4Campbell University School of Osteopathic Medicine, South Lillington, North Carolina; and 5Department of Epidemiology, Ohio State University, Columbus (See the Editorial Commentary by France and Oster, on pages 1223–5.)
Background. Human immunodeficiency virus type 1 (HIV-1) phylodynamics can be used to monitor epidemic trends and help target prevention through identification and characterization of transmission clusters.
Methods. We analyzed HIV-1 pol sequences sampled in North Carolina from 1997 to 2014. Putative clusters were identified using maximum-likelihood trees and dated using Bayesian Markov Chain Monte Carlo inference. Active clusters were defined as clusters including internal nodes from 2009 to 2014. Effective reproductive numbers (Re) were estimated using birth-death models for large clusters that expanded ≥2-fold from 2009 to 2014.
Results. Of 14 921 persons, 7508 (50%) sequences were identified in 2264 clusters. Only 288 (13%) clusters were active from 2009 to 2014; 37 were large (10–36 members). Compared to smaller clusters, large clusters were increasingly populated by men and younger persons; however, nearly 60% included ≥1 women. Clusters with ≥3 members demonstrated assortative mixing by sex, age, and sample region. Of 15 large clusters with ≥2-fold expansion, nearly all had Re approximately 1 by 2014.
Conclusions. Phylodynamics revealed transmission cluster expansion in this densely sampled region and allowed estimates of Re to monitor active clusters, showing the propensity for steady, onward propagation. Associations with clustering and cluster characteristics vary by cluster size. Harnessing sequence-derived epidemiologic parameters within routine surveillance could allow refined monitoring of local subepidemics.
Keywords. HIV-1; molecular epidemiology; transmission; phylogeny; southeastern United States.
Successful human immunodeficiency virus type 1 (HIV-1) trans-mission prevention requires targeted approaches tailored to indi-vidual epidemics. Molecular epidemiology is increasingly used to reconstruct HIV-1 transmission clusters from viral sequences [1], providing insights into subepidemics overlapping in geography, time, and contact networks. HIV-1 phylodynamic analyses com-bine viral sequence similarity, molecular clock modeling, and population dynamic inference to reconstruct viral transmission over time [2]. These analyses allow the estimation of transmis-sion parameters among subgroups [3, 4], timing of regional viral introduction [5], and spread [6]. HIV-1 phylodynamics have also been used to identify links between subepidemics [7] and estimate epidemic growth parameters [8, 9], which can inform
public health planning and assessment of interventions [10]. While HIV-1 transmission clusters have been described in mul-tiple cohorts in the United States (US) [11–13], few studies have incorporated phylodynamics [14–16].
Phylodynamic analyses may be particularly informative in regions such as the southern US, where HIV-1 incidence has failed to substantially decline with traditional control measures. Southern states are now an epicenter of the US epidemic [17], with higher HIV-1 diagnosis rates and prevalence compared to other regions. Despite widespread antiretroviral therapy (ART) and advances in prevention, ongoing transmission continues from the prevalent pool of diagnosed and undiagnosed persons living with HIV-1 [18]. As in other southern states, HIV-1 in-cidence in North Carolina (NC) has not appreciably declined since 2008 [19]; approximately 1400 new HIV-1 diagnoses are reported annually [20]. While our prior studies revealed mul-tiple large clusters composed primarily of men who have sex with men (MSM) [11, 21], sizeable local heterosexual transmis-sion was also identified [21]. Further investigation into HIV-1 clustering dynamics, focusing on growing clusters, is needed to determine optimal approaches for public health response.
SubSubBList3=SubBList=SubSubBList=SubBList
SubSubBList2=SubBList=SubSubBList=SubBList
SubBList2=BList=SubBList=BList
HeadB/HeadA=HeadC=HeadB/HeadA=HeadC/HeadB
HeadC/HeadB=HeadD=HeadC/HeadB=HeadC/HeadB
HeadC=NList_dot_numeric1=HeadC=NList_dot_numeric
HeadC/HeadB=NList_dot_numeric1=HeadC/HeadB=NList_dot_numeric
HeadD=NList_dot_numeric1=HeadD=NList_dot_numeric
HeadD/HeadC=NList_dot_numeric1=HeadD/HeadC=NList_dot_numeric
SubBList2=NList_dot_numeric2=SubBList=NList_dot_numeric2
SubBList2=NList_dot_numeric=SubBList=NList_dot_numeric
NList_dot_numeric2=HeadB=NList_dot_numeric=HeadB
NList_dot_numeric3=HeadB=NList_dot_numeric=HeadB
NList_dot_numeric2=SubBList1=NList_dot_numeric=SubBList1
NList_dot_numeric3=SubBList1=NList_dot_numeric=SubBList1
SubBList3=HeadD=SubBList_Before_Head=HeadD
SubBList2=HeadD=SubBList_Before_Head=HeadD
SubBList2=HeadB=SubBList=HeadB
SubBList3=HeadB=SubBList=HeadB
HeadC=NList_dot_numeric1(2Digit)=HeadC=NList_dot_numeric(2Digit)
HeadC/HeadB=NList_dot_numeric1(2Digit)=HeadC/HeadB=NList_dot_numeric(2Digit)
HeadD=NList_dot_numeric1(2Digit)=HeadD=NList_dot_numeric(2Digit)
HeadD/HeadC=NList_dot_numeric1(2Digit)=HeadD/HeadC=NList_dot_numeric(2Digit)
SubBList2(2Digit)=NList_dot_numeric2(2Digit)=SubBList(2Digit)=NList_dot_numeric2(2Digit)
SubBList2(2Digit)=NList_dot_numeric(2Digit)=SubBList(2Digit)=NList_dot_numeric(2Digit)
NList_dot_numeric2(2Digit)=HeadB=NList_dot_numeric(2Digit)=HeadB
NList_dot_numeric3(2Digit)=HeadB=NList_dot_numeric(2Digit)=HeadB
NList_dot_numeric2(2Digit)=SubBList1(2Digit)=NList_dot_numeric(2Digit)=SubBList1(2Digit)
NList_dot_numeric3(2Digit)=SubBList1(2Digit)=NList_dot_numeric(2Digit)=SubBList1(2Digit)
SubBList3(2Digit)=HeadD=SubBList(2Digit)=HeadD
We investigated the HIV-1 subtype B transmission dynamics in NC to characterize ongoing transmission networks. We aimed to differentiate between historical and “active” clusters with recent expansion in cluster size, and to estimate temporal parameters and effective reproductive numbers (Re) of active clusters. Delineating demographic and geographic subgroups with high rates of clustering and likely future transmission may inform the design, allocation, and monitoring of combination prevention approaches, such as increased testing and imme-diate ART [22], allowing for efficient deployment of finite pre-vention resources.
METHODS
Study Population
We analyzed full-length protease (PR, 297 bp) and partial re-verse transcriptase (RT, 1200 bp) HIV-1 sequences generated by the Laboratory Corporation of America (LabCorp), the largest commercial laboratory in NC. Sequences were col-lected from 1997 to mid-2014 from persons accessing clinical care in NC; the majority of the assays were HIV-1 GenoSure. We included samples from patients with a valid date of birth and aged ≥18 years at the time of sample acquisition. For per-sons with multiple sequences, only the first available sequence was included. Demographic variables collected included sex and geographic location of sampling sites; diagnosis dates and ART exposure information were not available. Clinic locations were grouped into 1 of the 7 regions used by the NC Department of Public Health to direct HIV-1/STD Field Services (Supplementary Figure 1). This study was approved by the University of North Carolina Institutional Review Board.
HIV-1 Sequences and Putative Cluster Identification
Sequences were aligned using MUSCLE [23] and manually ed-ited to strip gapped positions. The final sequence length was 1497 bases. Drug resistance mutations (DRMs) were identified using the Stanford HIV-1 Web Service (Sierra version 1.1) to query the Stanford HIV-1db Program [24]. Major DRMs were selected using the 2009 standardized surveillance list from the World Health Organization [25]. Non-B subtype sequences were identified using the Stanford HIV-1db Program and con-firmed by the Context-Based Modeling for Expeditious Typing [26] tool as previously described [14].
A maximum-likelihood (ML) phylogenetic tree was constructed in FastTree version 2.1.4 [27] under the general time-reversible model of nucleotide substitution. Statistical support for clades was assessed with local support values (Shimodaira-Hasegawa–like test). Putative transmission clusters were identified using the automated tool ClusterPicker version 1.3 [28]. We defined clusters as clades with high branch support (probability ≥0.90 by Shimodaira-Hasegawa–like test) and a maximum pairwise genetic distance <3.5% difference be-tween all sequences.
Time-Scaled Clusters
Subtype B sequences identified in putative clusters in the ML tree were further analyzed using Bayesian Markov Chain Monte Carlo (MCMC) inference in Bayesian Evolutionary Analysis Sampling Trees (BEAST) version 1.8.2 software [29]. Non-B subtypes were evaluated in a separate analysis [14]. Sequences belonging to pu-tative clusters were pooled in batches of <200 sequences to de-crease computational time. Care was taken not to divide clusters between files. Analyses were conducted using the SRD06 nucle-otide substitution model, a log-normal relaxed molecular clock model, and the Bayesian skyline model as coalescent tree prior. The MCMC chains were run for 50–100 million generations with 1–5 runs performed for each file. The BEAST log and tree files from multiple runs were combined in LogCombiner ver-sion 1.8.2 [29]; 10% of the generations were discarded as burn-in. Convergence of the estimates was considered satisfactory when the effective sample size was >200, as calculated in Tracer ver-sion 1.6 [30]. Maximum clade credibility trees (MCCTs) were summarized using TreeAnnotator version 1.8.2 [29], keeping the median height over the posterior distribution of trees. Clades with posterior probability ≥0.90 were considered highly supported.
The time of the most recent common ancestor (tMRCA) of the transmission clusters was estimated as the difference in the sampling date of the most recent sequence in the tree from the median height of the basal node of the cluster identified in the MCCTs. The MCCTs were further assessed for recent subclusters within each cluster. Clusters sized ≥3 members were considered “active” if the cluster included a recent subcluster, defined as in-ternal nodes with estimated dating in the most recent 5-year sam-pling period (2009 to mid-2014), and posterior probability ≥0.90. Dyads were considered “active” if the median tMRCA was ≥2009.
Identification of Clusters With High Rates of New Sequences, 2009–2014 We examined all clusters that included samples collected 2009– 2014. For each year of sampling, a proportional detection rate (PDR) was calculated for each cluster during a given year, j. We defined this as the cumulative number of clusters members sampled up to and including year j divided by the cumulative number of cases up to and during the last sampling year (i) per observation time between years j and i:
Proportional Detection Rate(PDR) =
j
0Cluster Membersi
0Cluster Members
j−i
Estimation of Effective Reproductive Numbers
We estimated the Re for selected individual large clusters (≥10 members) using the birth–death skyline serial (BDSKY) model in BEAST version 2.4.2 [31]. We selected large clusters because BEAST runs become less accurate with smaller clusters sizes and shorter sampling intervals. The BDSKY model infers changes in Re over time, thus estimating the average number of new infections caused by an infected person at a specified time during the outbreaks. The Re is cal-culated as the median ratio of the birth and death rates and was estimated for individual clusters over 3 equidistant time dimensions. The 95% highest probability density intervals for Re were defined as the smallest intervals containing 95% of the posterior probability of the Re estimate [9]. We used a general time-reversible substitution model with a gamma-distributed rate variation and proportion of invariant sites and an un-correlated log-normal relaxed molecular clock model. The BDSKY model priors were set for Re (LogNorm[0;0.5]), the rate of becoming noninfectious (LogNorm[1.3;1]), sampling rate (Beta[10;10]), and a fixed substitution rate of 3 × 10⁻³ nucleotide substitutions per site per year [32]. We estimated our sampling fraction as approximately 50% based on state surveillance reports that 28 101 HIV-1 cases are currently alive and residing in the state among 42 889 cases reported in NC from 1983 to 2013 [33]. Convergence was considered satisfactory when effective sample size was >200 for relevant parameters.
Statistical Analyses
We assessed cluster characteristics by cluster size. Dynamics of male-dominated (defined as >50% male members) clusters were compared to large clusters composed of ≥50% female members. All descriptive analyses were conducted using Stata version 13.0 software (StataCorp). We calculated assortativity coefficients for sex, age, and sampling region among persons sampled during 2009–2014 identified in active clusters using the igraph package in R.
RESULTS
Study Population
A total of 15 246 individuals aged ≥18 years at the time of initial sample collection provided 24 972 HIV-1 pol
sequences. Of these persons, 14 921 (97.9%) had subtype B sequences (n = 24 511 sequences) and were included in further analyses. Most persons (n = 9973 [67%]) had only 1 available sequence. Among persons with subtype B samples, 10 550 (70.7%) were male and 4173 (28.3%) were female (Table 1). The median year of the first available sequences was 2008 (interquartile range [IQR], 2005–2011) and the median age of sampled persons at the time of the first avail-able sequence was 40 (IQR, 32–48) years. Most sequences (n = 10 143 [68.0%]) were sent from clinics in the Raleigh or Charlotte regions, the most populous regions in the state (Supplementary Figure 1).
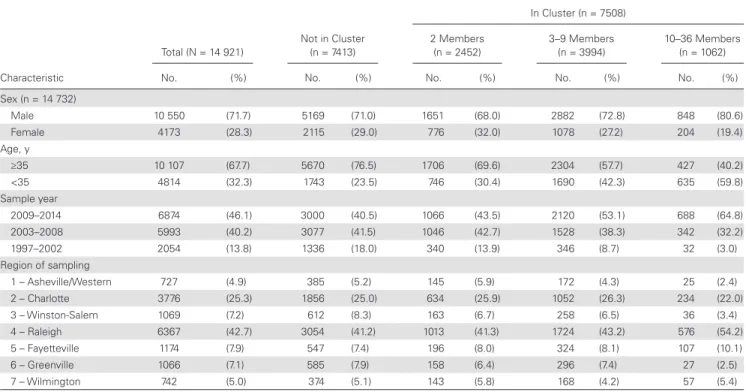
Table 1. Comparison of Characteristics of Human Immunodeficiency Virus Type 1–Infected Individuals and Their First Available Subtype B pol Sequences Sampled in North Carolina From 1997 to 2014, by Cluster Inclusion and Cluster Size
Characteristic
Total (N = 14 921)
Not in Cluster (n = 7413)
In Cluster (n = 7508)
2 Members (n = 2452)
3–9 Members (n = 3994)
10–36 Members (n = 1062)
No. (%) No. (%) No. (%) No. (%) No. (%)
Sex (n = 14 732)
Male 10 550 (71.7) 5169 (71.0) 1651 (68.0) 2882 (72.8) 848 (80.6)
Female 4173 (28.3) 2115 (29.0) 776 (32.0) 1078 (27.2) 204 (19.4)
Age, y
≥35 10 107 (67.7) 5670 (76.5) 1706 (69.6) 2304 (57.7) 427 (40.2)
<35 4814 (32.3) 1743 (23.5) 746 (30.4) 1690 (42.3) 635 (59.8)
Sample year
2009–2014 6874 (46.1) 3000 (40.5) 1066 (43.5) 2120 (53.1) 688 (64.8)
2003–2008 5993 (40.2) 3077 (41.5) 1046 (42.7) 1528 (38.3) 342 (32.2)
1997–2002 2054 (13.8) 1336 (18.0) 340 (13.9) 346 (8.7) 32 (3.0)
Region of sampling
1 – Asheville/Western 727 (4.9) 385 (5.2) 145 (5.9) 172 (4.3) 25 (2.4)
2 – Charlotte 3776 (25.3) 1856 (25.0) 634 (25.9) 1052 (26.3) 234 (22.0)
3 – Winston-Salem 1069 (7.2) 612 (8.3) 163 (6.7) 258 (6.5) 36 (3.4)
4 – Raleigh 6367 (42.7) 3054 (41.2) 1013 (41.3) 1724 (43.2) 576 (54.2)
5 – Fayetteville 1174 (7.9) 547 (7.4) 196 (8.0) 324 (8.1) 107 (10.1)
6 – Greenville 1066 (7.1) 585 (7.9) 158 (6.4) 296 (7.4) 27 (2.5)
Characteristics of Transmission Clusters
From the initial ML tree, 2283 putative transmission clusters were identified among the 14 921 subtype B sequences from unique individuals. These clusters included 7560 (50.7%) individuals. Only 52 (0.7%) sequences identified in the pu-tative ML clusters were not in clusters with posterior proba-bility >0.9 (n = 29 clusters) in the BEAST analysis. Nine of the ML clusters (34 persons) were broken down into 10 smaller clusters in the BEAST analysis (24 persons) with high pos-terior probability support; the remaining 10 persons were considered not clustered. Another 20 BEAST clusters had low posterior probability support (all 2–3 members) and were excluded (42 persons). The final BEAST trees included 7508 (50.3%) sequences in 2264 clusters with posterior prob-ability >0.9. We identified 1227 dyads (54.2%), 963 clusters of 3–9 persons (42.5%), and 74 (3.2%), large clusters (≥10 members); median cluster size was 2 (IQR, 2–4) members (Supplementary Table 1).
Characteristics of nonclustered persons differed substan-tially from characteristics of those identified in BEAST clusters (Table 1). A similar proportion of nonclustered persons and per-sons in dyads were male (71.0% vs 68.0%), compared to 80.6% of persons in large clusters. A large proportion of those not in clusters (76.5%) were ≥35 years of age at the time of sequencing, while the proportion of those <35 years of age increased with cluster size. Nonclustered individuals also tended to have earlier sequence sampling years than those in clusters.
Phylodynamics and Detection of Active Clusters
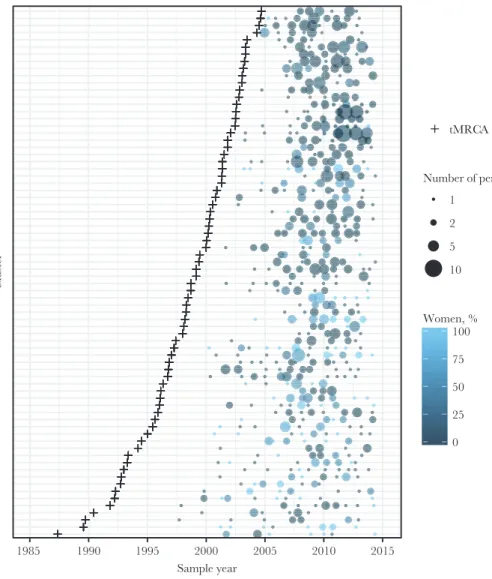
The vast majority of clusters of all sizes had estimated tMRCA dated prior to 2010; just 5.7% of dyads and 1.1% of clusters of 3–9 members had estimated tMRCA dates between 2010 and 2014. All large clusters had a tMRCA estimated before 2010. Of the 74 large clusters (≥10 members), 58 (78.4%) were male-dominated (>50% male members) and 16 (21.6%) were com-posed of ≥50% female members (Figure 1). Male-dominated
1985 1990 1995 2000 2005 2010 2015
Sample year
Cluster
tMRCA
Number of persons 1
2 5
10
0 25 50 75 100 Women, %
and ≥50% female clusters had similar median cluster sizes (13 [IQR, 11–17] vs 13 [IQR, 10–15] members). Male-dominated clusters had more recent introduction (median year of tMRCA: 1999 [IQR, 1995–2002] vs 1996 [IQR, 1993–1997]) and shorter time spans (15 years [IQR, 12–19] vs 18 years [IQR, 16–19] compared to clusters ≥50% female.
We assessed recent subclusters within each cluster defined as a highly supported internal node dated between 2009 and 2014, the most recent sampling period. The median year of the most recent internal node among clusters was 2003.5 (IQR, 1984.6– 2007.3). In total, 12.7% clusters (288/2264) had recent nodes from 2009 to 2014. Of the 10 largest clusters (≥20 members), 8 (80%) had recent subclusters, indicating relatively recent cluster expansion. Clusters with a recent internal node were defined as active clusters.
Cluster Composition and Assortativity of Active Clusters 2009–2014 Of 2264 clusters, 1639 (72%) contained at least 1 sequence sampled between 2009 and 2014. However, more than two-thirds (n = 1351 [68%]) of these clusters were more likely to be historical, containing no internal nodes after 2008. Cluster characteristics associated with these active and historical clusters were evaluated. As expected, active clusters compared
to historical clusters are larger (63% vs 47% have 3–9 members and 12.9% vs 2.7% have ≥10 members), contain more younger persons (37% vs 14% are composed of >50% persons under 30 years), and are majority male (73% vs 58%) (Supplementary Table 2).
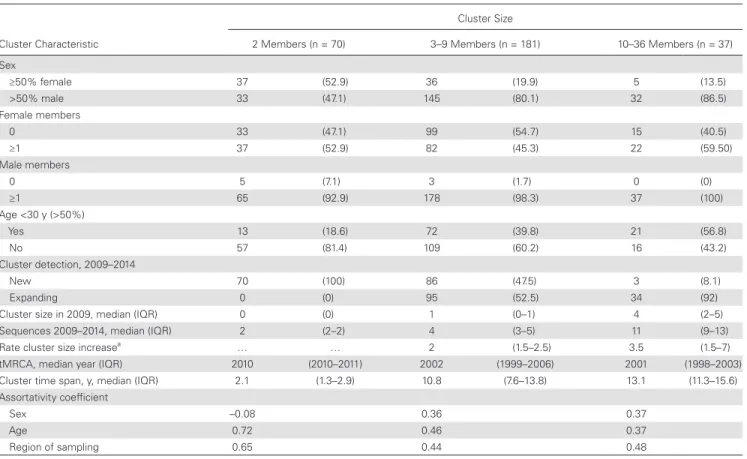
We assessed the sex and age distributions of the 288 active clusters and evaluated rates of detection of additional new sequences in the 2009–2014 sampling period. Cluster compo-sition differed substantially by cluster size among the 288 ac-tive clusters (Tables 2 and 3). More than half of dyads (52.9%) contained at least 1 woman, while larger clusters were dominated by men. Overall, 51% of clusters (147/288) contained only men. However, nearly half of clusters (49%) involved women. Among the 1306 persons in these 288 active clusters, the assortativity coefficient r was 0.37 for sex, 0.43 for age, and 0.47 for sam-pling region, indicating assortative mixing of these characteris-tics (r = 1 indicates perfect assortativity). However, assortativity differed by cluster size, where dyads were nonassortative by sex (r = –0.08) (Table 2).
Large Clusters With High PDR, 2009–2014
Among all active clusters (n = 288), there were 110 (38.2%) that more than doubled in size in 1 year from 2009 to 2014 (PDR ≥2/
Table 2. Characteristics of 288 “Active” Clusters That Involve Recent Internal Nodes (2009–2014), by Cluster Size
Cluster Characteristic
Cluster Size
2 Members (n = 70) 3–9 Members (n = 181) 10–36 Members (n = 37) Sex
≥50% female 37 (52.9) 36 (19.9) 5 (13.5)
>50% male 33 (47.1) 145 (80.1) 32 (86.5)
Female members
0 33 (47.1) 99 (54.7) 15 (40.5)
≥1 37 (52.9) 82 (45.3) 22 (59.50)
Male members
0 5 (7.1) 3 (1.7) 0 (0)
≥1 65 (92.9) 178 (98.3) 37 (100)
Age <30 y (>50%)
Yes 13 (18.6) 72 (39.8) 21 (56.8)
No 57 (81.4) 109 (60.2) 16 (43.2)
Cluster detection, 2009–2014
New 70 (100) 86 (47.5) 3 (8.1)
Expanding 0 (0) 95 (52.5) 34 (92)
Cluster size in 2009, median (IQR) 0 (0) 1 (0–1) 4 (2–5)
Sequences 2009–2014, median (IQR) 2 (2–2) 4 (3–5) 11 (9–13)
Rate cluster size increasea … … 2 (1.5–2.5) 3.5 (1.5–7)
tMRCA, median year (IQR) 2010 (2010–2011) 2002 (1999–2006) 2001 (1998–2003)
Cluster time span, y, median (IQR) 2.1 (1.3–2.9) 10.8 (7.6–13.8) 13.1 (11.3–15.6)
Assortativity coefficient
Sex –0.08 0.36 0.37
Age 0.72 0.46 0.37
Region of sampling 0.65 0.44 0.48
Data are presented as No. (%) unless otherwise indicated.
Abbreviations: IQR, interquartile range; tMRCA, time of the most recent common ancestor.
year). Of these, 27 of 110 (24.6%) were dyads, 68 of 110 (62.8%) contained 3–9 members, and 15 of 110 (13.6%) contained 10–36 members by 2014. For active clusters, the median PDR was 1.25 (IQR, 0.83–1.6) per year compared to historical clusters where the median was lower at 0.75 (IQR, 0.4–1.3) per year.
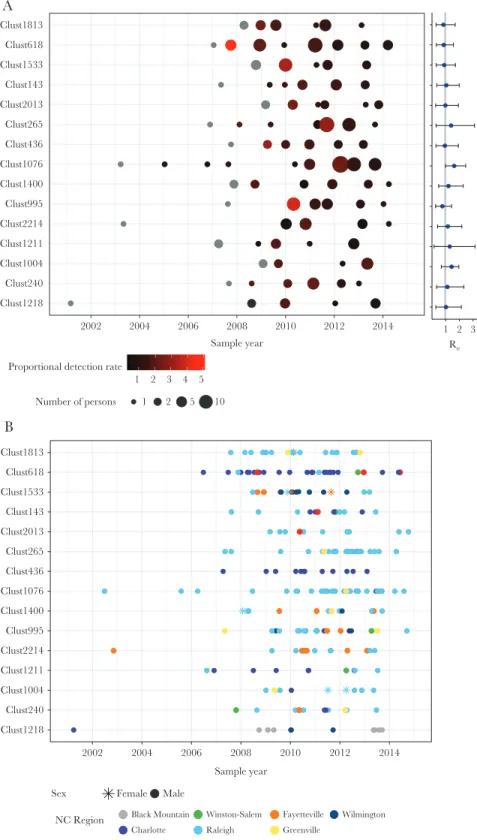
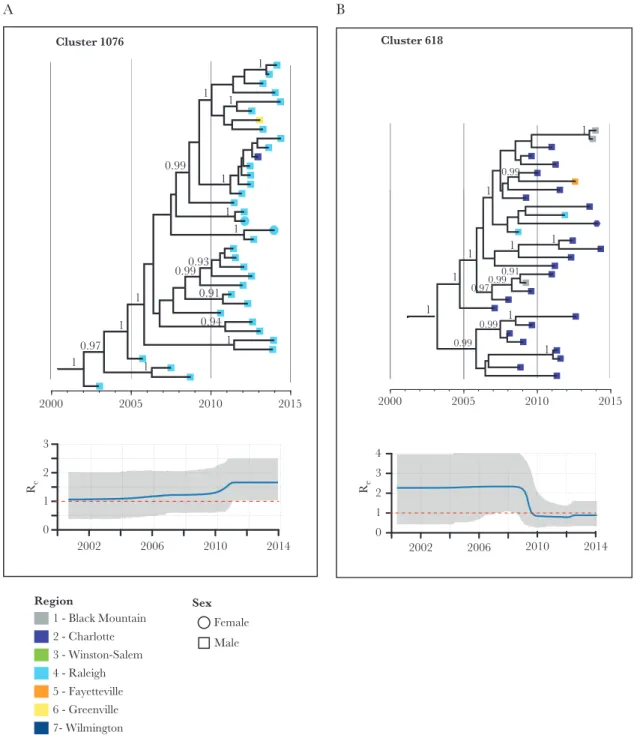
Of the 15 clusters with high PDR, and size ≥10 members by 2014, all were male dominated (Figure 2A). Large, high PDR clusters averaged 1.5 members (range, 0–5) at baseline (2009) and the mean maximum PDR per cluster was 2.7 per year. All of these clusters originated before 2007 and most were homog-enous by sampling region (Figure 2B). Re estimates for these clusters rarely fell below 1 and generally remained stable around 1 with occasional fluctuations (Supplementary Figure 3). The median Re was around 1 for most clusters for the most recent time interval (Figure 2A), which spanned an average of 3 years (from 2011 to 2014). One large cluster (Cluster ID 1076) had an increasing Re over the 3 time intervals, with the latest interval estimated at 1.66 (95% highest probability density, 1.03–2.50) (Figure 3A). Conversely, another cluster (Cluster ID 618) had a decreased Re (Figure 3B). The mean sampling proportion estimated by the birth–death model was 0.47 on average across the clusters; this is consistent with our estimated sampling of 50% based on NC surveillance reports.
Large Clusters With Low PDR, 2009–2014
For further comparison of the birth–death model, we estimated the Re over time for the 5 largest clusters (n ≥ 20 members) with low PDR from 2009–2014. For all of these clusters, the Re declined in the third estimation time frame (Supplementary Figure 4).
DISCUSSION
We used a large statewide repository of HIV-1 sequence data with sampling extending over 15 years to identify on-going HIV-1 transmission networks defined by phylogenetic clustering. We found a high degree of clustering indicating significant local onward transmission. Applying time-scaled
analyses, we provide a framework to identify clusters that are active and estimate basic epidemiologic parameters from these clusters, which could be used for epidemic monitoring. Most large clusters examined may continue to propagate at a steady pace. Future work to incorporate such large-scale sequence and phylodynamic analyses with traditional HIV-1 surveillance (ie, partner notification networks, risk behaviors) may help mon-itor the effect of interventions and direct allocation of public health resources.
We employed molecular clock analyses to estimate origins and time spans for individual clusters, revealing that the HIV-1 transmission dynamics of male-dominated clusters differed compared to clusters including at least half women. Overrepresentation of women in dyads and men in clusters likely reflects that local transmission is dominated by MSM. Male-dominated clusters originated more recently and tended to have shorter time spans. Furthermore, our prior analyses among clinic cohort participants failed to reveal any large clusters dominated by persons who inject drugs [11, 21]. Thus, we expect that the vast majority of clusters including women involve heterosexual transmission. Dynamics of heterosexual vs MSM transmission have been shown to differ substantially and similarly to our observations in other settings. In the United Kingdom, smaller clusters and slower transmission dynamics were found among heterosexual individuals compared to MSM [4]. However, our study reveals larger heterosexual clusters compared to those in European cohorts, likely reflecting mixed transmission dynamics in the US Southeast.
While characteristics associated with cluster membership, such as male sex and younger age, parallel incidence trends in the region [20], phylodynamic data offer important insights into local transmission dynamics not ascertainable through traditional surveillance. Phylodynamic trends lend informa-tion on the degree of localized transmission within the region, giving estimates on cluster origins and time spans. Although most large clusters analyzed in this study originated over a decade before the end of the study period, a large proportion Table 3. Characteristics of Persons With First Sample in 2009–2014 Who Are Members of Active Clusters
Characteristic
Cluster Size
2 Members (n = 140) 3–9 Members (n = 737) 10–36 Members (n = 429)
No. (%) No. (%) No. (%)
Sex (n = 1300)
Male 98 (70.5) 590 (80.4) 370 (86.7)
Female 41 (29.5) 144 (19.6) 57 (13.4)
Age, y
<35 62 (44.3) 443 (60.1) 301 (70.2)
>35 78 (55.7) 294 (39.9) 128 (29.8)
Region of sampling
2 – Charlotte 39 (27.9) 196 (26.6) 102 (23.8)
had increased in size since 2009. Much of this growth was observed among young men. However, more than half of these clusters also include women. Ongoing heterosexual
transmission in these clusters may be fueled by men who have sex with men and women [34], although no behavioral data were available in our study. Nonetheless, this finding
1 2 3 4 5 Proportional detection rate
Number of persons 1 2 5 10 Clust1218
Clust240 Clust1004 Clust1211 Clust2214 Clust995 Clust1400 Clust1076 Clust436 Clust265 Clust2013 Clust143 Clust1533 Clust618 Clust1813
2002 2004 2006 2008 2010 2012 2014 Sample year
1 2 3 Re
Clust1218 Clust240 Clust1004 Clust1211 Clust2214 Clust995 Clust1400 Clust1076 Clust436 Clust265 Clust2013 Clust143 Clust1533 Clust618 Clust1813
2002 2004 2006 2008 2010 2012 2014 Sample year
Sex Female Male
NC Region Black Mountain Charlotte
Winston-Salem Raleigh
Fayetteville Greenville
Wilmington
A
B
emphasizes the importance of continued prevention efforts to help identify high-risk women.
We estimated the reproductive numbers of clusters based on HIV-1 sequence data, showing that many large clusters are propagating at a steady pace as of 2014. An Re around 1 implies no significant epidemic expansion—or decline. This is consistent with a growing number of prevalent cases. The stability of the epidemic size model, applies to the number of infected persons not on ART (largely undiagnosed) because in
the model, persons are considered “removed” after sampling. A study in Botswana [8] similarly estimated Re though among subtype C clusters (≥5 members; median Re ranged from 0.72 to 1.77), suggesting that Re trends could be used to prioritize clusters for targeted interventions. The trend in Re over time may be most useful in monitoring the effect of existing pre-vention efforts or interpre-ventions on cluster growth. Of note, estimated Re scores rely on both the potential for clusters to produce new infections and the likelihood that these infections
0.93 1
0.94 0.99
0.91 0.99
1 1
1
1
1 1
1
0.97 1
1
1
2000 2005 2010 2015
Cluster 1076
2002 2006 2010 2014
0 1 2 3
Re
1 1
1
0.99
1
1
1
0.99 0.99
0.99 1
0.97
1
1
0.91
2000 2005 2010 2015 Cluster 618
2002 2006 2010 2014 0
1 2 3 4
Re
1 - Black Mountain 2 - Charlotte 3 - Winston-Salem 4 - Raleigh 5 - Fayetteville 6 - Greenville 7- Wilmington
Region Sex
Female Male
A B
are detected and sequenced. Thus, clusters with poor sampling rates may show downwardly biased Re values.
A strength of this study is the likely large sampling den-sity compared to prior phylogenetic studies conducted in the US, which minimizes sampling bias that can affect clustering interpretations [34]. Nonetheless, our observations could be influenced by differential sampling, particularly among subpopulations or within geographic regions. We defined ac-tive clusters as those with a highly supported subcluster in the most recent 5-year sampling period. Thus, incomplete sam-pling could underestimate the number of active clusters. Other factors associated with clustering, such as more recent sampling year and younger age, could be due to these groups being more likely to have a sequence. Other analytical approaches, such as source attribution methods, are less susceptible to sampling bias [35], and more work needs to be done to compare results with phylogenetic clustering.
Integration of epidemiological information would allow es-timation of HIV-1 transmission sources and improved iden-tification of potential intervention targets based on molecular analyses. We found positive—but not perfect—assortativity by sex, age, and region among large clusters; thus, many in-clude exchange across these subgroups, which can inform how cluster-directed interventions are planned. Our analyses are limited by lack of information on diagnosis dates, infection du-ration prior to sequencing, ART exposure, RNA viral loads, and risk behaviors. We were also only able to include viral sequences processed by a single reference laboratory in NC.
The Centers for Disease Control and Prevention have ex-panded its program to evaluate HIV-1 molecular clusters na-tionwide based on sequences reported through surveillance in many state health departments [36]. While HIV-1 phylogenetics have historically focused on retrospective datasets, these analyses can help plan and assess interventions [10, 37]. Such interventions include intense allocation of immediate ART, preexposure prophylaxis, and increased testing toward active clusters. By assessing sources of transmission among recently infected MSM in the Netherlands, one study found that the majority of recent infections could have been prevented with a combination approach informed by phylogenetic analyses [22].
We are currently developing an automated sequence analysis tool integrated with surveillance data to assess HIV-1 genetic clustering in NC to provide near real-time, actionable insight into HIV-1 transmission dynamics for the development of public health interventions. Reducing HIV-1 incidence requires earlier diagnosis, effective care linkage, and retention in care to achieve longstanding viral suppression. Allocating intense interventions toward clusters with high potential for further on-ward transmission demonstrated by increasing Re could more effectively reduce HIV-1 incidence than traditional methods. Application of phylodynamic methods within the surveillance system will inform the timely development and monitoring of
public health interventions and HIV-1 transmission trends in NC with methods translatable to other settings.
Supplementary Data
Supplementary materials are available at The Journal of Infectious Diseases online. Consisting of data provided by the authors to benefit the reader, the posted materials are not copyedited and are the sole responsibility of the authors, so questions or comments should be addressed to the corre-sponding author.
Notes
Disclaimer. The content is solely the responsibility of the authors and does not necessarily represent the official views of the National Institutes of Health (NIH).
Financial support. This work was supported by the National Institute of Allergy and Infectious Diseases, NIH (grant number K08AI112432-01) and by the University of North Carolina Center for AIDS Research (grant number P30AI50410).
Potential conflicts of interest. All authors: No reported conflicts of interest. All authors have submitted the ICMJE Form for Disclosure of Potential Conflicts of Interest. Conflicts that the editors consider relevant to the content of the manu-script have been disclosed.
References
1. Hassan AS, Pybus OG, Sanders EJ, Albert J, Esbjörnsson J. Defining HIV-1 transmission clusters based on sequence data. AIDS 2017; 31:1211–22.
2. Volz EM, Koelle K, Bedford T. Viral phylodynamics. PLoS Comput Biol 2013; 9:e1002947.
3. Lewis F, Hughes GJ, Rambaut A, Pozniak A, Leigh Brown AJ. Episodic sexual transmission of HIV revealed by molecular phylodynamics. PLoS Med 2008; 5:e50.
4. Hughes GJ, Fearnhill E, Dunn D, et al. Molecular phylodynamics of the heterosexual HIV epidemic in the United Kingdom. PLoS Pathog 2009; 5:e1000590.
5. Gray RR, Tatem AJ, Lamers S, et al. Spatial phylodynamics of HIV-1 epidemic emergence in East Africa. AIDS 2009; 23:F9–17.
6. Magiorkinis G, Angelis K, Mamais I, et al; SPREAD Program. The global spread of HIV-1 subtype B epidemic. Infect Genet Evol 2016; 46:169–79.
7. Skar H, Axelsson M, Berggren I, et al. Dynamics of two separate but linked HIV-1 CRF01_AE outbreaks among injection drug users in Stockholm, Sweden, and Helsinki, Finland. J Virol 2011; 85:510–8.
8. Novitsky V, Kühnert D, Moyo S, Widenfelt E, Okui L, Essex M. Phylodynamic analysis of HIV sub-epidemics in Mochudi, Botswana. Epidemics 2015; 13:44–55.
10. Paraskevis D, Nikolopoulos GK, Magiorkinis G, Hodges-Mameletzis I, Hatzakis A. The application of HIV molec-ular epidemiology to public health. Infect Genet Evol 2016; 46:159–68.
11. Dennis AM, Hué S, Hurt CB, et al. Phylogenetic insights into regional HIV transmission. AIDS 2012; 26:1813–22. 12. Aldous JL, Pond SK, Poon A, et al. Characterizing HIV
transmission networks across the United States. Clin Infect Dis 2012; 55:1135–43.
13. Little SJ, Kosakovsky Pond SL, Anderson CM, et al. Using HIV networks to inform real time prevention interventions. PLoS One 2014; 9:e98443.
14. Dennis AM, Hue S, Learner E, Sebastian J, Miller WC, Eron JJ. Rising prevalence of non-B HIV-1 subtypes in North Carolina and evidence for local onward transmis-sion. Virus Evol 2017; 3:vex013.
15. Perez-Losada M, Castel AD, Lewis B, et al. Characterization of HIV diversity, phylodynamics and drug resistance in Washington, DC. PLoS One 2017; 12:e0185644.
16. Volz EM, Ionides E, Romero-Severson EO, Brandt M-G, Mokotoff E, Koopman JS. HIV-1 transmission during early infection in men who have sex with men: a phylodynamic analysis. PLoS Med 2013; 10:e1001568.
17. Centers for Disease Control and Prevention. HIV in the southern United States. 2016 CDC issue brief. https://www. cdc.gov/hiv/pdf/policies/cdc-hiv-in-the-south-issue-brief. pdf. Accessed 12 July 2016.
18. Cope AB, Powers KA, Kuruc JD, et al. Ongoing HIV trans-mission and the HIV care continuum in North Carolina. PLoS One 2015; 10:e0127950.
19. North Carolina HIV/STD Surveillance Unit. HIV incidence estimate in North Carolina. 2016. http://epi.publichealth. nc.gov/cd/stds/figures/factsheet_HIV_incidence_2014. pdf. Accessed 26 February 2017.
20. North Carolina HIV/STD Surveillance Unit. 2016 North Carolina HIV/STD/hepatitis surveillance report. http:// epi.publichealth.nc.gov/cd/stds/figures/std16rpt_rev3.pdf. Accessed 12 December 2017.
21. Dennis AM, Hué S, Pasquale D, et al. HIV transmission patterns among immigrant Latinos illuminated by the inte-gration of phylogenetic and miinte-gration data. AIDS Res Hum Retroviruses 2015; 31:973–80.
22. Ratmann O, van Sighem A, Bezemer D, et al. Sources of HIV infection among men having sex with men and implications for prevention. Sci Transl Med 2016; 8:320ra2.
23. Edgar RC. MUSCLE: multiple sequence alignment with high accuracy and high throughput. Nucleic Acids Res
2004; 32:1792–7.
24. Liu TF, Shafer RW. Web resources for HIV type 1 genotypic-resistance test interpretation. Clin Infect Dis 2006; 42:1608–18. 25. Bennett DE, Camacho RJ, Otelea D, et al. Drug resistance mutations for surveillance of transmitted HIV-1 drug-resistance: 2009 update. PLoS One 2009; 4:e4724.
26. Struck D, Lawyer G, Ternes AM, Schmit JC, Bercoff DP. COMET: adaptive context-based modeling for ultrafast HIV-1 subtype identification. Nucleic Acids Res 2014; 42:e144. 27. Price MN, Dehal PS, Arkin AP. FastTree: computing large
minimum evolution trees with profiles instead of a distance matrix. Mol Biol Evol 2009; 26:1641–50.
28. Ragonnet-Cronin M, Hodcroft E, Hue S, et al. Automated analysis of phylogenetic clusters. BMC Bioinformatics
2013; 14:317.
29. Drummond AJ, Suchard MA, Xie D, Rambaut A. Bayesian phylogenetics with BEAUti and the BEAST 1.7. Mol Biol Evol 2012; 29:1969–73.
30. Rambaut A, Drummond A. Tracer version 1.4. 2007. http:// beast.bio.ed.ac.uk/Tracer. Accessed 26 July 2015.
31. Bouckaert R, Heled J, Kühnert D, et al. BEAST 2: a software platform for Bayesian evolutionary analysis. PLoS Comput Biol 2014; 10:e1003537.
32. Hue S, Pillay D, Clewley JP, Pybus OG. Genetic anal-ysis reveals the complex structure of HIV-1 transmission within defined risk groups. Proc Natl Acad Sci U S A 2005; 102:4425–9.
33. North Carolina HIV/STD Surveillance Unit. North Carolina HIV/STD epidemiologic profile 2013. 2015. http://epi. publichealth.nc.gov/cd/stds/figures/Epi_Profile_2013.pdf. Accessed 12 July 2016.
34. Oster AM, Wertheim JO, Hernandez AL, Ocfemia M, Saduvala N, Hall HI. Using molecular HIV surveillance data to understand transmission between subpopulations in the United States. J Acquir Immune Defic Syndr 2015; 70:444–51.
35. Volz EM, Le Vu S, Ratmann O, et al. Molecular epidemi-ology of HIV-1 subtype B reveals heterogeneous transmis-sion risk: implications for intervention and control. J Infect Dis 2018; 217:1522–9.
36. Centers for Disease Control and Prevention. Detecting, investigating, and responding to HIV transmission clusters. 2018. https://www.cdc.gov/hiv/pdf/funding/ announcements/ps18-1802/CDC-HIV-PS18-1802- AttachmentE-Detecting-Investigating-and-Responding-to-HIV-Transmission-Clusters.pdf. Accessed 7 August 2018. 37. Oster AM, France AM, Mermin J. Molecular epidemiology