Sri Krishna International Research & Educational Consortium
http://www.skirec.com
108
MUTUAL FUNDS’ PERFORMANCE IN INDIA: IMPACT OF FOREIGN STRATEGIC ALLIANCE
DR. AMISHA GUPTA
Assistant Professor
The Business School
University of Jammu
Jammu.
NEHA AGGARWAL
Research Scholar
The Business School
University of Jammu
Jammu.
ABSTRACT
Entry of foreign private players and foreign joint ventures has become one of the main sources
of capital flows to emerging economies. The Mutual fund sector in India too is growing vibrantly
and rapidly and is the key contributor to the globalization of financial markets. With the entry of
private sector funds in 1993, a new era started in the Indian mutual fund industry, giving the
Indian investor a wider choice of fund families. The effect of entry deregulation was seen in the
number of mutual fund houses increasing, with many foreign mutual funds setting up funds in
India and also the industry witnessed several mergers, acquisitions and joint ventures. Joint
ventures with foreign companies brought new technologies and business practices into the
company, while the domestic companies already have the relationships and requisite
governmental documents within the country along with being entrenched in the domestic
industry. In this paper an attempt is made to evaluate the role of foreign joint ventures in the
Indian mutual fund industry. The performances of two growth oriented equity schemes of two
foreign players, ICICI Prudential mutual fund and Principal mutual fund are evaluated on the
basis of monthly returns compared to benchmark returns. For this purpose, risk adjusted
Sri Krishna International Research & Educational Consortium
http://www.skirec.com
109
assessed that whether the joint venture mutual fund are offering the advantages of selectivity.
The paper gives an insight into the benefits and performance of the joint ventures in the mutual
fund industry.
Keywords: Foreign joint ventures, Jenson, mutual fund, performance, Selectivity, Sharpe,
Strategic alliance, Treynor.
I.INTRODUCTION
The last half-century has been an age of information that has brought up advancements for much
of the world. It was period of incredible social, technological and economic improvements
worldwide. The financial services are also benefited due to the fast advancements in information
processing. The economies worldwide are now operating globally and forming strategic alliances
with each other.
Strategic alliance is an agreement between two or more companies to share their resources for a
specific purpose. Joint venture is a form of such alliances in which two or more businesses
combine and create a separate entity and each agrees to share profit, loss and control. It is a good
way of partner without having to merge. The domestic market for financial services has realized
vast improvements in efficiencies, largely through the use of latest technologies but also through
the combining various financial services. The domestic strategic alliances have increased steadily
over the past two decades, international alliances were relatively rare until recently. There are
many factors that contributed to the expansion in joint ventures. With the help of strategic
alliances with international firms, companies are enjoying a number of advantages, which
include economies of scale and market dominance. Joint ventures create value for the parent
firms (Mohanram and Nanda,1998). International partnerships play an important role behind the
growth of a company. These deals helped a large number of companies penetrate into new
markets fast and attain economies of scale. They also stimulate foreign direct investment or FDI.
The foreign firm usually form joint ventures in lure of receiving better tax treatment for the host
government and the domestic firms get the benefits from a large share of profits from its partner
(Zhong and Lahiri , 2010).
The main benefits of international strategic alliances for an organization are that it brings
Sri Krishna International Research & Educational Consortium
http://www.skirec.com
110
talent from different cultures enhances the effectiveness of the organization. The performances
of joint ventures are highly dependent on the cross cultural practices of the firms.
In India, Entry of foreign private players and foreign joint ventures has become one of the main
sources of capital flows to emerging economies. The Mutual fund sector in India too is growing
vibrantly and rapidly and is the key contributor to the globalization of financial markets. With
the entry of private sector funds in 1993, a new era started in the Indian mutual fund industry,
giving the Indian investor a wider choice of fund families. The effect of entry deregulation was
seen in the number of mutual fund houses increasing, with many foreign mutual funds setting up
funds in India and also the industry witnessed several mergers, acquisitions and joint ventures.
Joint ventures with foreign companies brought new technologies and business practices into the
company, while the domestic companies already have the relationships and requisite
governmental documents within the country along with being entrenched in the domestic
industry. In this paper an attempt is made to evaluate the role of foreign joint ventures in the
Indian mutual fund industry. The performances of two foreign joint ventures in India are
analysed. The growth oriented balanced schemes of two foreign players, ICICI Prudential mutual
fund and Principal mutual fund are evaluated on the basis of monthly returns compared to
benchmark returns. For this purpose, risk adjusted performance measures suggested by Jenson,
Treynor and Sharpe are employed. The paper gives an insight into the benefits and performance
of the joint ventures in the mutual fund industry. Also, the study has highlighted how such
strategic alliances across nations provide the much needed impetus to the growth and overall
performance of the mutual fund houses.
The paper is divided into ten sections. Section II reviews the relevant existing literature on the
strategic alliances including mergers and acquisitions and joint ventures and performance
evaluation of mutual funds. Section III and section IV mentioned the objectives and hypothesis.
Section V discusses the research design and methodology and section VI presents the analysis of
data. Section VII gives the discussion of findings and section VIII provides limitations of the
study. Section IX gives the final conclusion and recommendations and section X describes the
Sri Krishna International Research & Educational Consortium
http://www.skirec.com
111
II. REVIEW OF LITERATUREMarangozov(2005) have analyzed the basic characteristics of these International joint ventures
and their variation of characteristics depending on the nationality of the foreign partners. Zhong
and Lahiri(2010) have suggested a new approach to the determination of Profit Share and Partner
Choice in International Joint Ventures. Mohanram and Nanda(1998)have analyzed 253 joint
venture and have suggested that joint ventures are announced when the parent firms conditions
are deteriorating. And the parent firms get benefit of joint venture by earning positive abnormal
returns. Slager (2005) has analysed the growing strategic partneship of the banking market,
which has taken place between 1980 and the present. He found that within the largest World
Bank‟s the degree of internationalization had increased considerably during the 1990s and early
XXIst century.
Makaew(2010) have investigated the dynamic patterns of cross-border mergers, identify the
factors that drive them. Martynova and Renneboog (2006) have characterized the main features
of the domestic and cross-border corporate takeovers involving European companies in the
period 1993-2001.Similarly, M. Buch and DeLong (2004) have analyzed the determinants of
international bank mergers by using uses a dataset of over 2,300 mergers that took place between
1978 and 2001. Black (2000) have presented evidence on mergers and have discussed the factors
that contribute to the strength of these merger activities.
Pekarek and Michela(2008) have addressed the past, present, and future of banking
consolidation. Shih(2000) evaluated the mergers among the banks during the Asian economic
crisis 1997-1998 and found that merging one weak bank into a healthier one or two weak banks
into a separate entity even further threatened the survival of banks.
Dellva, DeMaskey, Smith(2001) have evaluated Fidelity sector mutual funds on the basis of
selectivity and timing during the 1989-1998 time period. Jayadev (1996) have evaluated the
performance of two growth oriented mutual funds (Mastergain and Magnum Express) on the
basis of monthly returns compared to benchmark returns. The paper has employed the risk
adjusted performance measures suggested by Jenson, Treynor and Sharpe are employed.
III. OBJECTIVES
The objective of the paper is to evaluate that whether the growth oriented balance joint venture
Sri Krishna International Research & Educational Consortium
http://www.skirec.com
112
Whether these growth oriented balance joint venture mutual fund are offering the advantages of
selectivity of securities to their investors. Also, to study that whether the joint ventures with
foreign companies provide the much needed impetus to the growth and overall performance of
the mutual fund houses.
IV. HYPOTHESIS
H0: There exists a significant difference between the performances of two joint venture asset
management companies with respect to the benchmark.
H1: There exists a significant difference between the performance of two joint venture
companies.
V. RESEARCH DESIGN AND METHODOLOGY
The present paper tries to prove the hypothesis by employing the methodology used by
Jenson(1968), Treynor(1965), and Sharpe(1966) and finally drawing appropriate conclusion that
whether foreign joint ventures are earning high returns than the benchmark returns in terms of
risk. The performances of two joint ventures in India are analysed. The growth oriented balanced
schemes of two joint ventures; ICICI Prudential mutual fund and Principal mutual fund are
evaluated on the basis of monthly returns compared to benchmark returns. In the two selected
mutual funds, ICICI Prudential mutual fund is predominantly an Indian joint venture and
Principal mutual fund is predominantly a foreign joint venture.
ICICI Prudential Mutual Fund is one of the largest mutual fund houses in India. ICICI Prudential
Asset Management Company Ltd. is a joint venture between ICICI Bank, India‟s second largest
commercial bank & a well-known and trusted name in the financial services in India, &
Prudential Plc, one of the United Kingdom‟s largest players in the financial services sectors.
Prudential Plc holds 55 per cent of the asset management company and the balance is held by
ICICI Bank. Principal Mutual Fund is sponsored by Principal Financial Services Inc. USA
through its wholly owned subsidiary, Principal Financial Group (Mauritius) Limited, with
Sri Krishna International Research & Educational Consortium
http://www.skirec.com
113
65 per cent of the asset management company, 30 percent is held by Punjab National Bank and
the remaining 5%is held by Vijaya Bank.
The study period is 45 months (April 2007 to December 2010). The data source is monthly Net
Asset Values (NAVs) recorded from the website of Association of Mutual Funds in India
(AMFI). The SENSEX is assumed as Market Index or the Benchmark.
THE BASIC CONCEPTS
a. Portfolio and market returns
The rate of return on funds in a mutual fund is measured as the increase or decrease in NAV plus
income distributions such as dividends or distribution of capital gains expressed as a fraction of
NAV at the beginning of investment period. But in the present study none of the two funds have
dividends or distribution of capital gains.
t t 1
p
t 1
NAV NAV
r 100
NAV
rp is risk on portfolio
NAV is the NET ASSET VALUE of the fund
„t‟ is the time period
For calculating monthly returns, high and low values of NAVs of the two funds for the period are
taken and simple averages of two values are calculated. Finally the simple averages of such
returns are calculated. Similarly, returns on the market index are taken to arrive at the average
market return.
t t 1
m
t 1
Market Index Market Index
r 100
Market Index
Where rm is return on market
Risk free return: Post Office Monthly Scheme offer an annual return of 8%. Therefore, it is
assumed that the monthly risk free return (rf) is .67 per cent.
b. Risk
Risk is the quantifiable likelihood of loss or less-than-expected returns or variability of returns.
The total risk is measured with the help of following formula of standard deviation of returns for
Sri Krishna International Research & Educational Consortium
http://www.skirec.com
114
2
m f m f
m
r r r r
O
N 1
Op is total risk of the portfolio
Om is total risk on the market
rm-rf is average risk free return of portfolio over risk free return
N = number of observations
Systematic risk, sometimes called market risk, aggregate risk, or undiversifiable risk, is the risk
associated with aggregate market returns. It influences all securities available in the market.
Thus, systematic risk of the market is always one, systematic risk of risk free investment is zero
and portfolio or fund systematic risk can be greater than or less than one.
N N N
mt pt pt mt
t 1 t 1 t 1
p N N 2
2
mt mt
t 1 t 1
N er er er er
N er er
ermt = rmt -rft
erpt = rpt-rft
t is time period 1,2,……….N
Unsystematic risk, sometimes called specific risk or diversifiable risk, is the company-specific or
industry-specific risk in a portfolio, which is uncorrelated with aggregate market returns. It is
measured with the help of standard deviation of error term.
2 pt pt t
E E
SDEP
N 1
Where
SDEPt = Unique risk of the portfolio
Ept = Error terms of the portfolio for period „t‟
Ept = Average of error terms of the portfolio
c. T-test
T-test is applied to test that whether there is a difference between the means of returns of two
joint venture companies or not. For applying t-test, we work out the value of test statistic (i.e. „t‟)
2
p f p f
P
r r r r
O
Sri Krishna International Research & Educational Consortium
http://www.skirec.com
115
and then compare with the table value of t (based on „t‟ distribution) at 95%level of confidence for given degrees of freedom. If the calculated value of „t‟ is either equal to or exceeds the table
value, we infer that the difference is significant, but if calculated value of two is less than the
concerning table value of t, the difference is not treated as significant.
Risk Adjusted Performance Measures
a. Jensen measure
Jensen's alpha is used to determine the abnormal return of a security or portfolio of securities
over the benchmark return. Here, Equilibrium average return on the portfolio would be a
benchmark. This is the return that portfolio must earn with the given systematic return.
p f m f P
EAR AR AR AR B
EARp is Equilibrium average return
The Jensen‟s alpha which is the difference between the benchmark return and the average return
of the portfolio indicates performance of the fund.
p ARp EARp
αp is the Jensen‟s alpha of the portfolio
If the alpha is positive, this shows the superior performance of the fund and is alpha is negative it
means that the fund has not performed upto the benchmark.
b. Reward to Volatility Ratio
Treynor ratio is a risk-adjusted measure of return based on systematic risk. This is introduced by
Treynor(1965) and is similar to the Jensen alpha, with the only difference that the Treynor ratio
uses beta as the measurement of volatility. It is also known as the reward to volatility ratio of the
portfolio.
P f
p
p
AR AR
RVOL
B
Where RVOLp is reward to volatility of the portfolio
Here, Additional returns of market over risk free return (ARm – ARf) is the benchmark. Greater
value of the portfolio over the market indicates a superior performance of the fund.
The two measures Jensen‟s and Treynor are based on systematic risk, but it are necessary to
evaluate the performance of the two joint venture funds in terms of its total risk. So, for this
purpose Sharpe ratio is used.
Sri Krishna International Research & Educational Consortium
http://www.skirec.com
116
It was developed by William F. Sharpe (1966). Sharpe ratio determines the excess return of
portfolio over risk free return and is related to the total risk of the portfolio.
P f
p
p
AR AR
RVAR
O
m f
m
m
AR AR
RVAR
O
Where,
RVARp is reward to variability of the portfolio
RVARm is reward to variability of the market
The benchmark is additional return of market over risk free return related with market portfolio‟s
total risk.
d. Selectivity
It determines the ability of fund manager to select undervalued securities so as to earn higher
returns. It is measured with the help of Fama‟s (1972) decomposition measure.
p m
p f m f
AR AR O / O AR AR
The positive value of this measure indicates the superior performance of the fund manager and
of the fund.
VI. Analysis of Data
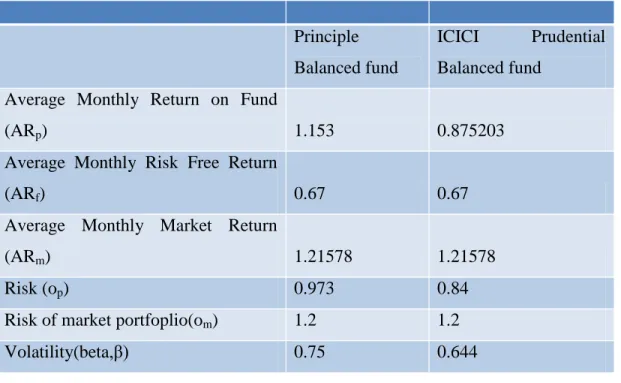
Table 1: Return and risk of the two funds along with market return and risk
Principle
Balanced fund
ICICI Prudential
Balanced fund
Average Monthly Return on Fund
(ARp) 1.153 0.875203
Average Monthly Risk Free Return
(ARf) 0.67 0.67
Average Monthly Market Return
(ARm) 1.21578 1.21578
Risk (op) 0.973 0.84
Risk of market portfoplio(om) 1.2 1.2
Sri Krishna International Research & Educational Consortium
http://www.skirec.com
117
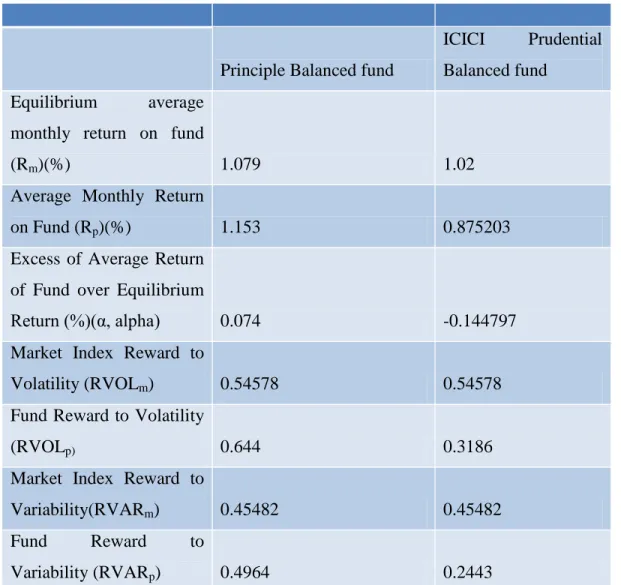
Table 2: Risk adjusted performance measures
Principle Balanced fund
ICICI Prudential
Balanced fund
Equilibrium average
monthly return on fund
(Rm)(%) 1.079 1.02
Average Monthly Return
on Fund (Rp)(%) 1.153 0.875203
Excess of Average Return
of Fund over Equilibrium
Return (%)(α, alpha) 0.074 -0.144797
Market Index Reward to
Volatility (RVOLm) 0.54578 0.54578
Fund Reward to Volatility
(RVOLp) 0.644 0.3186
Market Index Reward to
Variability(RVARm) 0.45482 0.45482
Fund Reward to
Variability (RVARp) 0.4964 0.2443
Table 3: Systematic and Unsystematic Risk of the two funds
Principle Balanced
fund
ICICI Prudential Balanced
fund
Total Risk (Op) 0.973 0.84
Systematic Risk ( β ) 0.75 0.644
Unsystematic Risk (OEpt) 6.37 5.508
Sri Krishna International Research & Educational Consortium
http://www.skirec.com
118
Principle Balanced
fund
ICICI Prudential Balanced
fund
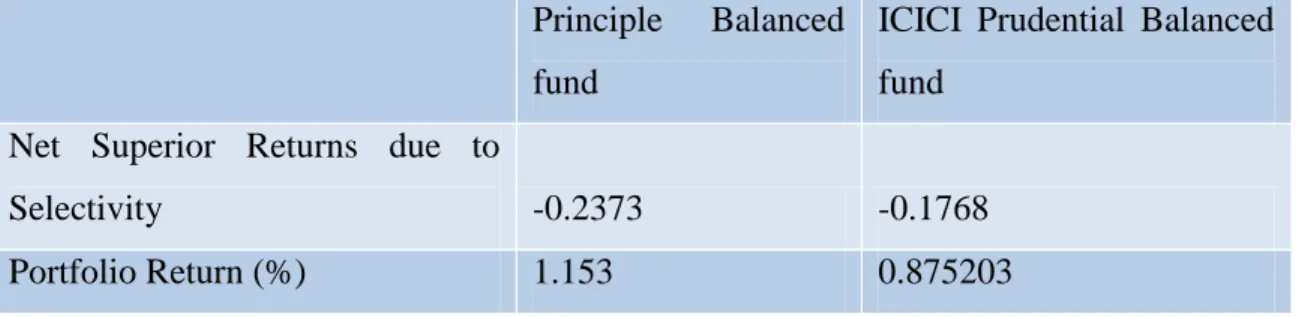
Net Superior Returns due to
Selectivity -0.2373 -0.1768
Portfolio Return (%) 1.153 0.875203
Table 5: To test the difference between the means of returns of two Joint venture companies
One tailed t- test
degrees of freedom calcuated value
table value at 95% confidence level of the difference
86 0.218 1.645
VII. Discussion of Findings
1. From the table 1, it is evident that Principle Balanced fund has earned a higher average
return if 1.153 percent as against the market average return of 1.215 percent, But the
ICICI prudential balanced fund has not earned higher return compared to the average
market return.
2. As the volatility of the funds indicates the investment risk and high volatility represents
higher investment risk. Thus from the volatility point of view, the ICICI Prudential
investors might have benefitted and Principal investors have not.
3. Both Principal and ICICI prudential have taken lower risk as compared to the Market
risk. Further, investing in ICICI prudential is very less risky as compared to the Principal
balanced funds.
4. From the Table 2, it is evident that Principal Balanced fund has positive alpha and ICICI
Prudential Balanced fund has a negative value of alpha. The result indicates the superior
performance of the Principal fund and very inferior performance of the ICICI prudential
Mutual fund scheme.
5. Fund reward to volatility ratio for Principal joint venture fund is higher as compared to
the benchmark and low for ICICI Prudential mutual fund. Thus, it can be concluded that
Principal balanced fund has a superior performance over its benchmark. But ICICI
Sri Krishna International Research & Educational Consortium
http://www.skirec.com
119
6. Principal Balanced fund has taken lesser risk than the market portfolio but still has earned
higher returns over its benchmark. Also, higher reward to variability ratio of Principal
balanced fund compared to its benchmark indicates the superior performance of the
mutual fund with respect to its benchmark. The Principal balanced fund has superior
performance, both in terms of total risk and systematic risk.
7. Table 4 shows the selectivity measure for two funds with the help of Fama‟s
decomposition measures. Both the funds show negative value of selectivity. Thus, it
indicates the lower ability of the fund manager in identifying the undervalued securities.
Both the funds have not offered the advantages of professionalism to the investors.
8. Table 5 shows that the difference between the means of two ICICI Prudential Balanced
fund and PRINCIPAL Balanced fund. The table shows that the calculated value of T-test
is less than table value at 95% confidence level. This shows that there is no significant
difference between the returns of two joint venture companies.
VIII. Limitations
This paper is not exempted from one major limitation. That is, the BSE SENSEX consist of only
30 actively traded securities and BSE itself alone has more than 8000 companies listed. Hence
BSE SENSEX may not be an effective index as benchmark. Other limitation of the research is
that only two joint venture mutual funds have been evaluated. The study can be better off if a
sample of more than two joint ventures would have taken.
IX. CONCLUSION
From the analysis, it can be noted that the principal balanced fund has earned higher return as
compared to the ICICI Prudential fund and the benchmark portfolio. ICICI prudential have not
performed upto the benchmark. The Principal Balanced fund has outperformed both in terms of
total risk and systematic risk. The fund managers of both the joint venture companies do not
offered the benefits of the professionalism to the investors.
Both the funds can mitigate the unsystematic risk through portfolio diversification. Both the asset
management joint venture companies can earn better returns by recruiting the efficient
Sri Krishna International Research & Educational Consortium
http://www.skirec.com
120
ventures with foreign companies provide the much needed impetus to the growth and overall
performance of the mutual fund houses.
X. SCOPE FOR FUTURE RESEARCH
The study has important managerial implications for the fund managers, investors and
researchers. The present study can be extended by taking more than two joint venture Asset
Management Companies and evaluating the performance of more and more schemes of those
joint venture companies.
NAV’s
PRINCIPAL Mutual Fund
ICICI Prudential Mutual Fund
BSE-SENSEX
PRINCIPAL Balanced
plan- Growth Option
ICICI Prudential Balanced Plan-Growth Option
Date
Range High Low High Low High Low
Apr-07 22.11 20.25 35.35 32.56 14383.72 12425.52
May-07 23 21.93 36.53 34.58 14576.37 13554.34
Jun-07 23.39 22.19 36.64 35.35 14683.36 13946.99 Jul-07 24.26 23.39 38.25 36.65 15868.85 14638.88
Aug-07 24.2 22.77 36.92 34.71 15542.4 13779.88
Sep-07 26.42 24.31 40.23 37.15 17361.47 15323.05 Oct-07 29.58 26.57 44.42 39.99 20238.16 17144.58 Nov-07 30.34 28.66 44.98 42.85 20204.21 18182.83
Dec-07 32.42 30.28 47.3 44.41 20498.11 18886.4
Jan-08 33.06 27.23 47.94 39.75 21206.77 15332.42 Feb-08 29.29 26.79 43.16 38.9 18895.34 16457.74 Mar-08 26.97 24.62 40.09 36.14 17227.56 14677.24 Apr-08 27.11 24.81 39.21 36.4 17480.74 15297.96 May-08 27.34 25.95 39.64 37.52 17735.7 16196.02 Jun-08 25.66 22.5 36.95 32.53 16632.72 13405.54 Jul-08 23.78 21.73 34.77 31.34 15130.09 12514.02 Aug-08 24.78 23.64 35.64 33.34 15579.78 14002.43 Sep-08 24.6 21.49 34.63 30.67 15107.01 12153.55 Oct-08 21.97 16.41 31.01 23.17 13203.86 7697.39
Nov-08 19.2 16.55 26.62 23.64 10945.41 8316.39
Dec-08 18.29 16.53 27.37 23.82 10188.54 8467.43
Sri Krishna International Research & Educational Consortium
http://www.skirec.com
121
Feb-09 17.6 16.52 26.33 25 9724.87 8619.22
Mar-09 17.97 15.69 26.55 24.13 10127.09 8047.17
Apr-09 20.29 18 28.79 26.51 11492.1 9546.29
May-09 24.55 20.53 33.09 29.15 14930.54 11621.3
Jun-09 25.43 24.16 34.3 32.89 15600.3 14016.95
Jul-09 26.2 23.42 35.48 32.51 15732.81 13219.99 Aug-09 26.56 25.28 35.87 34.25 16002.46 14684.45 Sep-09 28.28 26.25 38.09 35.22 17142.52 15356.72
Oct-09 28.73 27.4 38.43 36.87 17493.17 15805.2
Nov-09 28.96 26.84 39.34 36.26 17290.48 15330.56 Dec-09 29.65 28.72 40.05 38.78 17530.94 16577.78 Jan-10 30.32 28.71 40.88 38.9 17790.33 15982.08 Feb-10 29.16 28.24 39.66 38.61 16669.25 15651.99 Mar-10 29.88 28.84 41.6 40.01 17793.01 16438.45 Apr-10 30.46 29.85 42.03 41.13 18047.86 17276.8 May-10 30.19 28.33 41.3 39.44 17536.86 15960.15 Jun-10 30.48 26.49 42.56 40.5 17919.62 16318.39 Jul-10 31.24 30.16 43.33 42.14 18237.56 17395.58 Aug-10 31.96 31.2 44.07 43.23 18475.27 17819.99 Sep-10 33.31 31.59 46.52 43.86 20267.98 18027.12 Oct-10 33.97 33.23 47.57 46.51 20854.55 19768.96 Nov-10 34.14 31.77 48.59 45.95 21108.64 18954.82 Dec-10 33.02 31.33 47.49 45.76 20552.03 19074.57
REFERENCES
Black, Bernard S. (2000) “Is This the First International Merger Wave?”, Working Paper No.
202, M&A Lawyer, pp. 20-26.
Dellva, Wilfred L.; DeMaskey, Andrea L.; Smith, Colleen A. (2001) “Selectivity and Market
Timing Performance of Fidelity Sector Mutual Funds.” The Financial Review.
Buch, C., DeLong, G., (2004) “Cross-border bank mergers: What lures the rare animal?”,
Journal of Banking and Finance, Vol. 28, pp. 2077-2102.
Jayadev,M.(1996) “Mutual Fund Performance: An Analysis of Monthly Returns”,Finance India,
Vol. 10, No. 1,pp.73–84
Jensen, M.C., (1968) “The performance of Mutual Funds in the period 1945-1964”, Journal of
Sri Krishna International Research & Educational Consortium
http://www.skirec.com
122
Fama, E. (1972) “Components of Investment performance”, Journal of Finance, Vol.27, pp.
551-567.
Marangozov, Iavor,(2005) “Characteristics of the International Joint Ventures in Bulgaria
(1989-2003).” European Business Review, Vol. 17, No. 3, pp. 242-262.
Makaew,T. (2010), “ The Dynamics Of International Mergers And Acquisitions”, Working
Paper Series, Available at SSRN: http://ssrn.com/abstract=1572005
Martynova, M. and Renneboog, L. (2006) “Mergers and Acquisitions in Europe”, ECGI
Working Paper No. 114, Center Discussion Paper Series No. 2006-06.
Mohanram, Partha S. and Nanda, Ashish (1998) “When Do Joint Ventures Create Value?”,
Available at SSRN: http://ssrn.com/abstract=7382
Pekarek, Edward and Huth, Michela (2008) “Bank Merger Reform Takes an Extended
Philadelphia National Bank Holiday”, Fordham Journal of Corporate & Financial Law, Vol. 13,
pp. 595-703.
Sharpe, William F., (1966) “Mutual Fund Performance”, Journal of Business, Vol. 39, No. 1,pp.
119-138.
Shih, Michael S. H. (2000) “Banking-Sector Crisis and Mergers as a Solution”, Working Paper
Series, Available at: http://ssrn.com/abstract=244989
Slager, A., 2005. Internationalization of Banks: Strategic Patterns and Performance. SUERF
Studies No. 4/2005.
Treynor, J.L. (1965) “How to Rate Management of Investment Funds”, Harvard
Business Review, Vol. 43, No. 1, pp. 63-75.
Treynor, J.L. and Kay, K. Mazny (1966) “Can Mutual Funds Outguess the Market?”, Harvard
Business Review, Vol. 44, No. 4,pp. 131-136.