R E S E A R C H
Open Access
Markers of neuroprotection of combined
EPA and DHA provided by fish oil are
higher than those of EPA (
Nannochloropsis
)
and DHA (
Schizochytrium
) from microalgae
oils in Wistar rats
Paula A. Lopes
1*†, Narcisa M. Bandarra
2,3†, Susana V. Martins
1, Joana Martinho
1, Cristina M. Alfaia
1,
Marta S. Madeira
1, Carlos Cardoso
2,3, Cláudia Afonso
2,3, Maria C. Paulo
4, Rui M. A. Pinto
5,6,
José L. Guil-Guerrero
7and José A. M. Prates
1*Abstract
Background:To overcome the current overexploitation of fish rich inn-3 long chain polyunsaturated fatty acids (LCPUFA), microalgae have become a promising marine lipid source. The purpose of this study was to assess eicosapentaenoic acid (EPA, 20:5n-3) and docosahexaenoic acid (DHA, 22:6n-3), isolated or combined from distinct marine origins, on the promotion of neuroprotective effects.
Methods:The experiment lasted for 10 weeks and involved 32 Wistar rats, divided into 4 diets (n= 8): a diet rich in milk fat was taken as control (Milk Fat) and compared ton-3 LCPUFA enriched diets, either in EPA + DHA form through fish oil (Fish Oil), or EPA throughNannochloropsisoil (Nanno), or DHA throughSchizochytriumoil (Schyzo), while maintaining Milk Fat incorporation.
Results:Plasma lipid profile and dopamine levels were more beneficial in Fish Oil diet. In addition,n-3 LCPUFA incorporation was found increased in liver and erythrocytes from Fish Oil fed rats, suggesting that fish oil is a better dietary source for fatty acids deposition in the organism than microalgae. The Forced Swimming Test revealed a positive behavioural action of EPA + DHA, in opposition to Milk Fat and Nanno diets, which had higher immobile times. mRNA levels of serotonin receptors, HT1A and HT2A along with CREB, the transmission factor for learning and memory, were higher in the hippocampus of rats fedn-3 LCPUFA diets comparative to Milk Fat.
Conclusion:Taken together, the combination of EPA and DHA from fish oil can counteract the undesirable health effects of saturated fat based diets and benefit, in the long run, neurological function.
Keywords:Fish oil, Microalgae, Fatty acid composition, Forced swimming test, Transcriptional profile
* Correspondence:ampalopes@fmv.ulisboa.pt;japrates@fmv.ulisboa.pt †Equal contributors
1CIISA, Faculdade de Medicina Veterinária, Universidade de Lisboa, Avenida da Universidade Técnica, 1300-477 Lisbon, Portugal
Full list of author information is available at the end of the article
Background
Ageing represents the accumulation of changes over time that are associated with or responsible for increased sus-ceptibility to most diseases and death [1]. The European population is getting older and until 2030 the number of seniors aged over 70 is predicted to increase 40%, as will age-related neurodegenerative diseases [2, 3].
The improvement of health of the elderly population through a diet rich in essential nutrients may mitigate the effects of ageing. Precisely, essential nutrients such asn-3 long-chain polyunsaturated fatty acids (n-3 LCPUFA, > 18 C), particularly eicosapentaenoic acid (EPA, 20:5n-3) and docosahexaenoic acid (DHA, 22:6n-3), are associated to a prophylactic role in certain age-related diseases with particular emphasis to some of the effects of certain de-generative diseases of the nervous system. These FA have a protective role on regulating brain development and neurotransmitter functioning and are recognised as the most beneficial FA in retarding neurological pathologies, such as Alzheimer’s, Parkinson’s and Huntington’s dis-eases, multiple sclerosis, schizophrenia, cognitive decline and brain ageing, major depression, acute stress and anxiety like behaviours [4–7]. Their deficiency leads to impaired neuronal function, affecting neurotransmission action [8, 9]. Accordingly, the international nutritional guidelines have recommended the need to increase EPA and DHA intake.
In the human body, DHA is synthesised in limited amounts and, therefore, must be obtained through the diet [10]. Fatty fish is the best source ofn-3 LCPUFA [11]. However, due to the excessive and sometimes poorly regu-lated fishery exploitation, the depletion of worldwide fish stocks is aggravating their sustainability. Thus, search for alternative sources ofn-3 LCPUFA to increase their avail-ability and the consumption of these healthy FA is a major demand. Microalgae are a viable option forn-3 LCPUFA production because they do not require arable land for their growth and can operate as biofactories using only sunlight energy, thereby having the ability to accumulate high levels of FA under adverse environmental conditions [12]. In fact, new improvements on microalgae production have been made concerning growth optimization require-ments, able to produce highly pure EPA and DHA oils [13] containing up to 30–40% of a target FA [14]. Some microalgae oils have also demonstrated safety nutritional profiles with no trace of toxicity, because they are pro-duced under controlled conditions, thus being approved for consumption by the Food and Drug Administration.
Despite the body of evidence onn-3 LCPUFA positive effects on retarding and treating the neurologic condi-tions stated above [15, 16], a key question remains to be answered [17, 18]: are the benefits ascribed to EPA and DHA individual action or a result from the combination of both fatty acids (EPA + DHA)?
In this study, the impact of microalgae oils rich in EPA and DHA, as alternative marine lipid sources to fish oils was assessed on the neurological function of Wistar rats. We hypothesised that blue biotechnology can efficiently provide n-3 LCPUFA to counteract the undesirable health effects of saturated fat based diets by means of improving the biochemical profile, changing FA compos-ition of key tissues, preventing inflammatory processes, enhancing neurological function, and modifying rat’s behaviour. To establish the effects of EPA and DHA, iso-lated or combined, on the promotion of neuroprotective effects, fish oil was used for comparative purposes.
Methods
Experimental diets
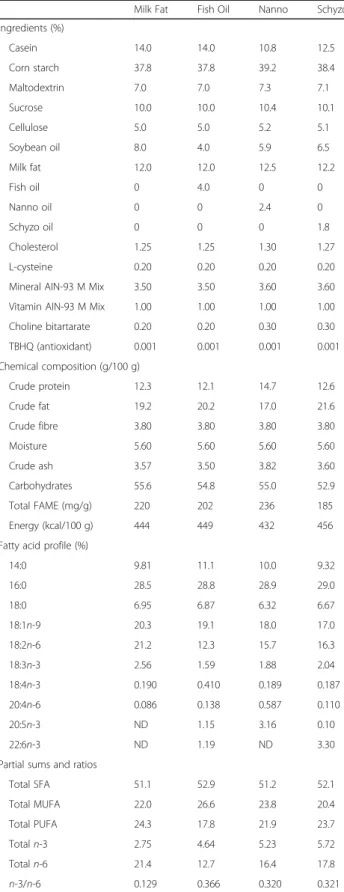
Diets were manufactured by the Experimental Diets Unit from the University of Almería, Spain. The proximate chemical composition of the diets was determined ac-cording to AOAC [19], and FA composition was assessed as described by Bandarra et al. [20]. All diets were based on the standard AIN-93 M formulation for rodents with modified lipid fractions, as follows: milk fat diet (Milk Fat group), a negative control with 20% of fat (12% from milk and 8% from soybean oil); milk fat diet plus cod liver oil (Fish Oil group), a positive control with 20% of fat (12% from milk, 4% from soybean oil and 4% from cod liver oil which is rich in EPA and DHA); milk fat diet plus Nannochloropsis microalga oil (Nanno group) with 20% of fat (12.5% from milk fat, 5.9% from soybean oil and 2.4% from Nanno oil which is rich in EPA); milk fat diet plus Schizochytrium microalga oil (Schyzo group) with 20% of fat (12.2% from milk fat, 6.5% from soybean oil and 1.8% from Schyzo oil which is rich in DHA) (Table 1). Nannochloropsis was pur-chased at Monzón BIOTECH, S.L. (Barcelona, Spain) andSchizochytriumwas produced by Instituto Português do Mar e da Atmosfera (IPMA, Lisboa, Portugal), ac-cording to conditions outlined in previous studies [21].
Animals and sample collection
after centrifugation at 1500 g for 10 min. Erythrocytes were obtained after washing the pellet twice with 0·9% sodium chloride and centrifuging at 1500 g for 15 min and the correspondent aliquots were flash-frozen in li-quid N2and stored at−80 °C, for further analysis. Liver, brain and hippocampus were removed, weighed and stored at−80 °C for FA determination. Samples for gene (serotonin 5-HT1A receptor (HT1A), serotonin 5-HT2A receptor (HT2A), brain-derived neurotrophic factor (BDNF), cAMP responsive element binding protein (CREB), interleukin-6 (IL-6) and tumour necrosis factor-alpha (TNF-α) expression analysis were collected from the hippocampus, rinsed with sterile RNAse-free cold saline solution, cut into small pieces (thickness of ~0.3 cm), stabilised in RNA Later® solution (Qiagen, Hilden, Germany) and stored at−80 °C.
Plasma biochemical assays
The plasma concentrations of total cholesterol, HDL-cholesterol, LDL-HDL-cholesterol, triacylglycerols (TAG), glu-cose, creatinine, urea, aspartate aminotransferase (AST), alanine aminotransferase (ALT), alkaline phosphatase (ALP) and gamma glutamyl transferase (γ-GT) were de-termined using standard diagnostic test kits obtained from Roche Diagnostics (Mannheim, Germany) in the Modular Hitachi Analytical System (Roche Diagnostics). The concentrations of VLDL-cholesterol and total lipids were calculated according to the Friedewald et al. [22] and Covaci et al. [23] formulas, respectively.
TNF-αand IL-6 were measured simultaneously, in dupli-cate, using Millipore’s MILLIPLEX rat cytokine panel (Millipore, Billerica, MA, USA). The assays were conducted according to the manufacturer’s instructions. The plate was run on a Luminex 200 Instrument using Bio-Plex Manager 4.1 standard software (Bio-Rad Laboratories, Hercules, CA, USA). Raw fluorescence data were analysed by software using a 5-parameter logistic method. The minimum detection concentrations were 2.4 pg/ml and 73.2 pg/ml for TNF-α and IL-6, respectively. The intra- and inter-assay precision of the cytokine panel were 2.3–3.6% and 11.3– 14.3%, respectively.
Fatty acid composition in faeces, liver, erythrocytes and brain
After lipid extraction by the Bligh and Dyer method [24], fatty acid methyl esters (FAME) were determined in the extracted lipids from faeces, liver, erythrocytes and brain by acid-catalysed transesterification using the methodology described by Bandarra et al. [25]. Samples were injected into a Varian Star 3800 CP gas chromato-graph (Walnut Creek, CA, USA), equipped with an auto sampler with a flame ionisation detector (FID) at 250 °C. FAME were identified by comparing their retention times with those of standards (PUFA-3, Menhaden oil, Table 1Ingredients, chemical composition and fatty acid
profile of Milk Fat, Fish Oil, Nanno and Schyzo experimental diets
Milk Fat Fish Oil Nanno Schyzo
Ingredients (%)
Casein 14.0 14.0 10.8 12.5
Corn starch 37.8 37.8 39.2 38.4
Maltodextrin 7.0 7.0 7.3 7.1
Sucrose 10.0 10.0 10.4 10.1
Cellulose 5.0 5.0 5.2 5.1
Soybean oil 8.0 4.0 5.9 6.5
Milk fat 12.0 12.0 12.5 12.2
Fish oil 0 4.0 0 0
Nanno oil 0 0 2.4 0
Schyzo oil 0 0 0 1.8
Cholesterol 1.25 1.25 1.30 1.27
L-cysteine 0.20 0.20 0.20 0.20
Mineral AIN-93 M Mix 3.50 3.50 3.60 3.60
Vitamin AIN-93 M Mix 1.00 1.00 1.00 1.00
Choline bitartarate 0.20 0.20 0.30 0.30
TBHQ (antioxidant) 0.001 0.001 0.001 0.001
Chemical composition (g/100 g)
Crude protein 12.3 12.1 14.7 12.6
Crude fat 19.2 20.2 17.0 21.6
Crude fibre 3.80 3.80 3.80 3.80
Moisture 5.60 5.60 5.60 5.60
Crude ash 3.57 3.50 3.82 3.60
Carbohydrates 55.6 54.8 55.0 52.9
Total FAME (mg/g) 220 202 236 185
Energy (kcal/100 g) 444 449 432 456
Fatty acid profile (%)
14:0 9.81 11.1 10.0 9.32
16:0 28.5 28.8 28.9 29.0
18:0 6.95 6.87 6.32 6.67
18:1n-9 20.3 19.1 18.0 17.0
18:2n-6 21.2 12.3 15.7 16.3
18:3n-3 2.56 1.59 1.88 2.04
18:4n-3 0.190 0.410 0.189 0.187
20:4n-6 0.086 0.138 0.587 0.110
20:5n-3 ND 1.15 3.16 0.10
22:6n-3 ND 1.19 ND 3.30
Partial sums and ratios
Total SFA 51.1 52.9 51.2 52.1
Total MUFA 22.0 26.6 23.8 20.4
Total PUFA 24.3 17.8 21.9 23.7
Totaln-3 2.75 4.64 5.23 5.72
Totaln-6 21.4 12.7 16.4 17.8
n-3/n-6 0.129 0.366 0.320 0.321
and PUFA-1, Marine Source from Supelco Analytical, Sigma-Aldrich, St. Louis, MO, USA). The quantification of total FA was based on the internal standard technique, using the heneicosanoic acid (21:0) (Sigma-Aldrich). Results for each FA were expressed as a percentage of the sum of detected FA (% total FA).
Lipid class analysis in brain
The main lipid classes were separated by analytical thin-layer chromatography (TLC) in plates coated with 0.25 mm silica gel G and developed with a mixture of chloroform:methanol:water (56:41:3 by volume), based on Bandarra et al. [25]. The developed plates were sprayed with 10% of phosphomolybdic acid in ethanol (w/v). The identification of lipid classes (polar and non-polar) was performed by comparison with standards (Sigma Chemical Co., St. Louis, MO, USA) and the quantification using a scanner and Quantity One 1-D Analysis software (version 4.5.2, Bio-Rad) [25].
Behavioural analysis: Forced swimming test
The behavioural effects ofn-3 LCPUFA were tested one week prior to euthanasia using the blinded Forced Swimming Test (FST), according to Porsolt et al. [26] with slight modifications. The identification of rats was ensured by a code in order to avoid bias. Each rat was put individually into vertical cylinders (60 cm height and 20 cm diameter) containing water at 25 °C (± 2 °C) with 30 cm deep for a 15 min pre-test. The cylinders were made of transparent Plexiglas as this material is able to withstand the frequent movement of the tanks and accidents better than glass. Water volume prevented the animal from escaping or touching the bottom of the cy-linder. Behavioural tests were done individually, one at a time, to prevent copying and avoid bias. The room was under control to guarantee that noises, light changing or reflexes would not affect rat’s behaviour. At the end of the pre-test, the animal was taken from the water, dried with a towel to prevent hypothermia and then put back into its cage, so it could rapidly resettle to its normal conditions. The water was changed after each experi-ment to remove urine, faeces and odour clues left by the previous rat and thus, to avoid interferences on the next rat. 24 h later, the rat was exposed to the same afore-mentioned experimental conditions for a 5 min FST. This final test was recorded by a conventional video camera positioned in front of the Plexiglas cylinder. Behavioural times were calculated with proper soft-ware [27] (Ethowatcher®) and classified from most active to least active, as climbing (active upward movement), swimming (active lateral movement), floating (passive fluctuating movement) and immobile (absence of movement).
Determination of serotonin and catecholamines
Plasma 5-hydroxytryptamine (5-HT, serotonin) and cate-cholamines were determined by high-performance liquid chromatography – electrochemical detection method (HPLC-ECD).
Serotonin was determined using a ClinRep kit for
“serotonin in plasma/serum” (Recipe Chemicals + In-struments GmbH, Munich, Germany). Briefly, 200μl of plasma containing N-methylserotonin as an internal standard (10μl) was precipitated to remove proteins and lipids. The supernatant was separated on a Shimadzu series 10 HPLC system by a reversed-phase column and using an isocratic mobile phase (ClinRep, ref.: 6710) equipped with a Shimadzu series 6 electrochemical de-tector. The conditions for obtaining the chromatograms were as follows: a) temperature: 30 °C; b) detector: po-tential - 0.45 V; c) flow: 1.0 ml/min. Data obtained from the HPLC system were treated using software suitable for this type of assays (Shimadzu class 10-A software). Quality control of the system was accomplished by running ClinRep controls in two levels. The day-to-day CV was 5.4% and 5.3%, respectively. The lower limit of quantitation (LLOQ) was 1 μg/l. Catecholamines were determined using a Bio-Rad kit for “Plasma catechol-amines by HPLC” (Bio-Rad, Madrid, Spain). Briefly, 50μl of plasma containing dihydroxybenzylamine as an internal standard (5 μl) was treated with alumina (extraction phase). HPLC analysis of the supernatant was performed with an analytical cation exchange col-umn specific for catecholamines PCAT (Bio-Rad, ref.: 195–6079) and an isocratic mobile phase purchased from Bio-Rad (ref: 195–6056). Catecholamines determi-nations were performed on a Shimadzu series 10 HPLC system equipped with a Shimadzu series 6 electroche-mical detector. The conditions for obtaining the chro-matograms were as follows: a) temperature: 30 °C; b) detector: potential - 0.50 V; c) flow: 1.1 ml/min. Data obtained from the HPLC system were treated using soft-ware suitable for this type of assays (Shimadzu class 10-A software). In each series of determinations, control samples (Lyphochek, Bio-Rad, ref. 530) were analysed in order to monitor the quality of each of the assays per-formed. The day-to-day CV was 4.9%. The lower limit of quantitation (LLOQ) was 25 pg/ml.
ND-2000c, respectively (Thermo Scientific, Wilmigton, DE, USA). To generate cDNA for qPCR, 300 ng of total RNA were reverse transcribed for 2 h at 37 °C using the High-Capacity cDNA Reverse Transcription Kit (Applied Biosystems, Foster City, CA, USA).
Real time quantitative PCR (RT-qPCR)
mRNA expression levels were quantified using the SYBR green technology and MicroAmp Optical 96-well plates in a StepOnePlus thermocycler at standard cycling condi-tions (Applied Biosystems). Gene specific intron-spanning primers were designed using Primer Express® Software v.3.0 (Applied Biosystems) based onRattus norvegicus se-quences (www.ncbi.nlm.nih.gov). Specific sense and anti-sense primers used to amplify cDNA were purchased from NZYTech (Lisbon, Portugal). The specific primers were: HT1A (5′-GATCTCGCTCACTTGGCTCA-3′ and 5′-AGCGCCGAAAGTGGAGTAGA-3′); HT2A (5′-CAC
CACAGCCGCTTCAACTC-3′ and 5′-CACCACAGCCG
CTTCAACTC-3′); BDNF (5′-AGGGATCCACACTGCC ACTG-3′ and 5′-GAATTCCTCCTGCTCTGCCAG-3′); CREB (5′-CCTCCCCAGCACTTCCTACA-3′ and 5′-TC AAGCACTGCCACTCTGTTC-3′); TNF-α (5′-TCTTCT
CATTCCTGCTCGTGG-3′ and 5′-GTCTGGGCCATGG
AACTGAT-3′); IL-6 (5′-GGATACCACCCACAACAGA CC-3′ and 5′-AGTGCATCATCGCTGTTCATACA-3′); glyceraldehyde-3-phosphate dehydrogenase (GAPDH) (5′
-CAGTGCCAGCCTCGTCTCAT-3′ and 5′
-CACAAGA-GAAGGCAGCCCTG-3′); and ribosomal protein L27 (RPL27) (5′-GCCATGGGCAAGAAGAAGATC-3′ and 5′-GCTGGGTCTCTGAACACATCCT-3′). PCR efficiency was calculated for each amplicon using the StepOnePlus PCR System software, by amplifying 5-fold serial dilutions of pooled cDNA and running in triplicate. All primer sets were required to exhibit similar amplification efficiencies. The primer specificity and formation of primer-dimers were checked by melt curve analysis. A set of four candi-date housekeeping genes was evaluated using geNorm and NormFinder, as described by Vandesompele et al. [28] and Andersen et al. [29], respectively. GADPH and RPL27 genes were selected as the most stable pair of internal controls for normalization. All ana-lyses were performed in duplicate, and the relative amounts for each target gene were calculated using the geometric mean of housekeeping genes as normalizer. Relative expression levels were calculated as a variation of the Livak method [30] corrected for variation in amplification efficiency, as described by Fleige and Pfaffl [31].
Statistical analysis
Statistical analysis was carried out using the Statistical Analysis System (SAS) software package, version 9.1 (SAS Institute, USA). Sample size was determined by the
POWER procedure of SAS. A sample size of 8 rats pro-vided a statistical power of at least 80% for detecting 20% differences with a 2-tailed probability of P < 0.05. All data were checked for normal distribution and vari-ance homogeneity and reported as means ± standard error (SE). Data were analysed using PROC MIXED to accommodate variance heterogeneity. If significant ef-fects were obtained, least squares means were deter-mined using the LSMEANS option and compared using the probability difference procedure (PDIFF adjust Tukey). The PROC CORR method was used to obtain Pearson’s correlation coefficients betweenn-3/n-6 PUFA ratio in erythrocvtes and other parameters. P-values lower than 0.05 were considered statistically significant.
Results
Animal body composition
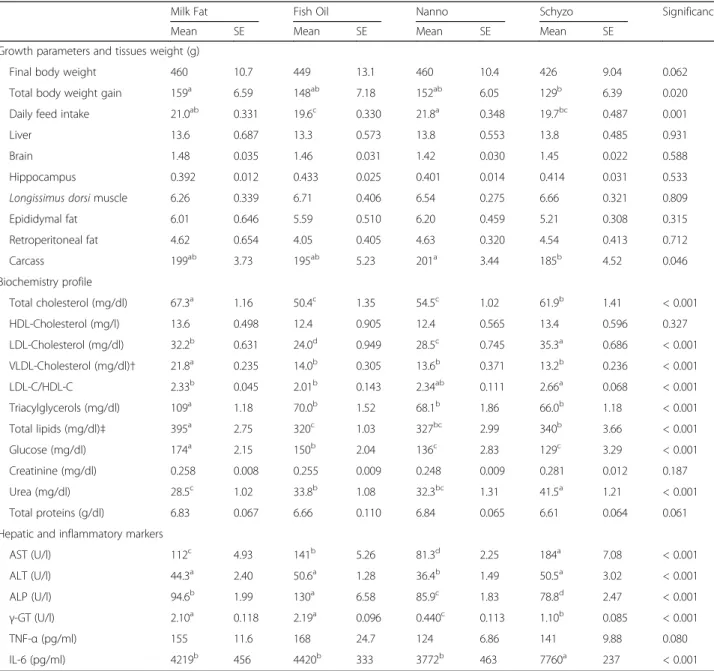
Body composition parameters of rats fed different n-3 LCPUFA sources are shown in Table 2. Most of the vari-ables presented no changes across dietary groups, except total body weight gain that was found increased in Milk Fat in comparison to Schyzo (P< 0.05). Rats fed Nanno diet had higher values of daily feed intake than Fish Oil and Schyzo (P < 0.05). Carcass weight was found in-creased in Nanno relative to Schyzo (P< 0.05).
Plasma metabolites and inflammatory status
Biochemistry profile, markers of hepatic and renal func-tion, and inflammation are also shown in Table 2. Total cholesterol, VLDL-cholesterol, TAG, total lipids and glu-cose were higher in Milk Fat group in comparison to the others (P < 0.001). Rats fed Schyzo diet had increased levels of LDL-cholesterol than the others (P < 0.001). LDL-C/HDL-C ratio was also higher in Schyzo group relative to Milk Fat and Fish Oil (P < 0.001). Although creatinine remained unchanged across dietary groups (P> 0.05), urea was found higher in Schyzo (P< 0.001). Regarding the hepatic markers, AST was increased in Schyzo and decreased in Nanno (P< 0.001). ALT andγ -GT were reduced in Nanno (P < 0.001) whereas ALP was reduced in Schyzo (P < 0.001). TNF-α presented no variations across dietary groups (P > 0.05), but IL-6 was increased in Schyzo fed rats (P< 0.001).
-6 (arachidonic acid, AA) variations). DHA was un-detected in faeces.
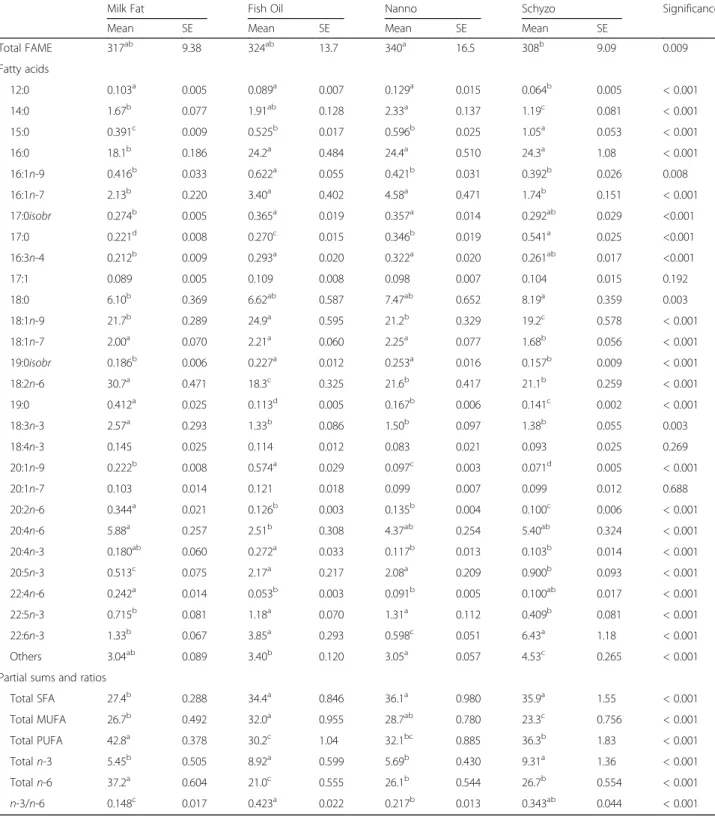
FA composition in liver is presented in Table 4. The fatty acid content was lower in Schyzo when compared to Nanno (P = 0.009). SFA sum was decreased in Milk Fat fed rats relative to the others (P< 0.001), due to 15:0 (P < 0.001), 16:0 (P < 0.001), 17:0 (P < 0.001) and 18:0 (stearic acid, SA) (P= 0.003) variations. Rats fed Fish Oil had higher levels of total MUFA, in particular of 16:1n-9 (P = 0.008), 16:1n-7 (P < 0.001), OA (P < 0.001) and 20:1n-9 (P < 0.001) than Milk Fat and Schyzo (P< 0.001), but identical to Nanno. PUFA and n-6 PUFA were increased in Milk Fat fed rats (P < 0.001) in
comparison to the others due to LA, 20:2n-6 and AA (P < 0.001) variations. n-3 sum and n-3/n-6 ratio were increased in Fish Oil relative to Milk Fat and Nanno (P < 0.001) due to changes in 20:4n-3, EPA and DHA (P< 0.001). While EPA reached higher values in Fish Oil and Nanno (P < 0.001), DHA reached higher values in Fish Oil and Schyzo (P< 0.001).
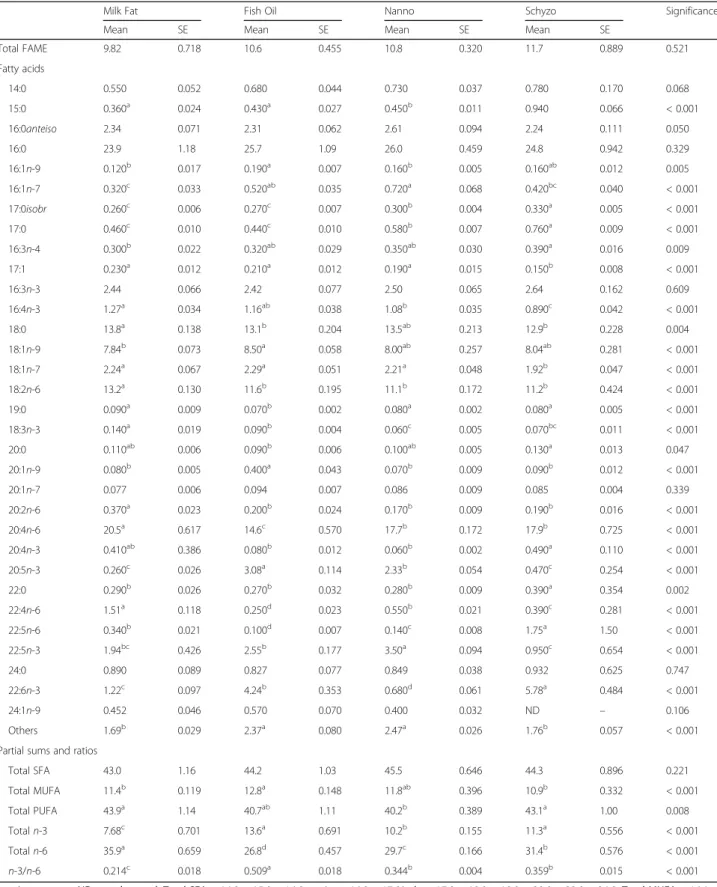
FA composition in erythrocytes is shown in Table 5. It exhibited several resemblances to liver’s, in particular for MUFA (P < 0.001), n-3 PUFA (P < 0.001) and n-3/n-6 ratio (P < 0.001). The same applies for EPA (P < 0.001) and DHA (P < 0.001). The n-6 PUFA reached the highest value in Milk Fat fed rats in Table 2Body composition parameters and plasma metabolites
Milk Fat Fish Oil Nanno Schyzo Significance
Mean SE Mean SE Mean SE Mean SE
Growth parameters and tissues weight (g)
Final body weight 460 10.7 449 13.1 460 10.4 426 9.04 0.062
Total body weight gain 159a 6.59 148ab 7.18 152ab 6.05 129b 6.39 0.020
Daily feed intake 21.0ab 0.331 19.6c 0.330 21.8a 0.348 19.7bc 0.487 0.001
Liver 13.6 0.687 13.3 0.573 13.8 0.553 13.8 0.485 0.931
Brain 1.48 0.035 1.46 0.031 1.42 0.030 1.45 0.022 0.588
Hippocampus 0.392 0.012 0.433 0.025 0.401 0.014 0.414 0.031 0.533
Longissimus dorsimuscle 6.26 0.339 6.71 0.406 6.54 0.275 6.66 0.321 0.809
Epididymal fat 6.01 0.646 5.59 0.510 6.20 0.459 5.21 0.308 0.315
Retroperitoneal fat 4.62 0.654 4.05 0.405 4.63 0.320 4.54 0.413 0.712
Carcass 199ab 3.73 195ab 5.23 201a 3.44 185b 4.52 0.046
Biochemistry profile
Total cholesterol (mg/dl) 67.3a 1.16 50.4c 1.35 54.5c 1.02 61.9b 1.41 < 0.001
HDL-Cholesterol (mg/l) 13.6 0.498 12.4 0.905 12.4 0.565 13.4 0.596 0.327
LDL-Cholesterol (mg/dl) 32.2b 0.631 24.0d 0.949 28.5c 0.745 35.3a 0.686 < 0.001
VLDL-Cholesterol (mg/dl)† 21.8a 0.235 14.0b 0.305 13.6b 0.371 13.2b 0.236 < 0.001
LDL-C/HDL-C 2.33b 0.045 2.01b 0.143 2.34ab 0.111 2.66a 0.068 < 0.001
Triacylglycerols (mg/dl) 109a 1.18 70.0b 1.52 68.1b 1.86 66.0b 1.18 < 0.001
Total lipids (mg/dl)‡ 395a 2.75 320c 1.03 327bc 2.99 340b 3.66 < 0.001
Glucose (mg/dl) 174a 2.15 150b 2.04 136c 2.83 129c 3.29 < 0.001
Creatinine (mg/dl) 0.258 0.008 0.255 0.009 0.248 0.009 0.281 0.012 0.187
Urea (mg/dl) 28.5c 1.02 33.8b 1.08 32.3bc 1.31 41.5a 1.21 < 0.001
Total proteins (g/dl) 6.83 0.067 6.66 0.110 6.84 0.065 6.61 0.064 0.061
Hepatic and inflammatory markers
AST (U/l) 112c 4.93 141b 5.26 81.3d 2.25 184a 7.08 < 0.001
ALT (U/l) 44.3a 2.40 50.6a 1.28 36.4b 1.49 50.5a 3.02 < 0.001
ALP (U/l) 94.6b 1.99 130a 6.58 85.9c 1.83 78.8d 2.47 < 0.001
γ-GT (U/l) 2.10a 0.118 2.19a 0.096 0.440c 0.113 1.10b 0.085 < 0.001
TNF-α(pg/ml) 155 11.6 168 24.7 124 6.86 141 9.88 0.080
IL-6 (pg/ml) 4219b 456 4420b 333 3772b 463 7760a 237 < 0.001
n= 8 per group.a,b,c
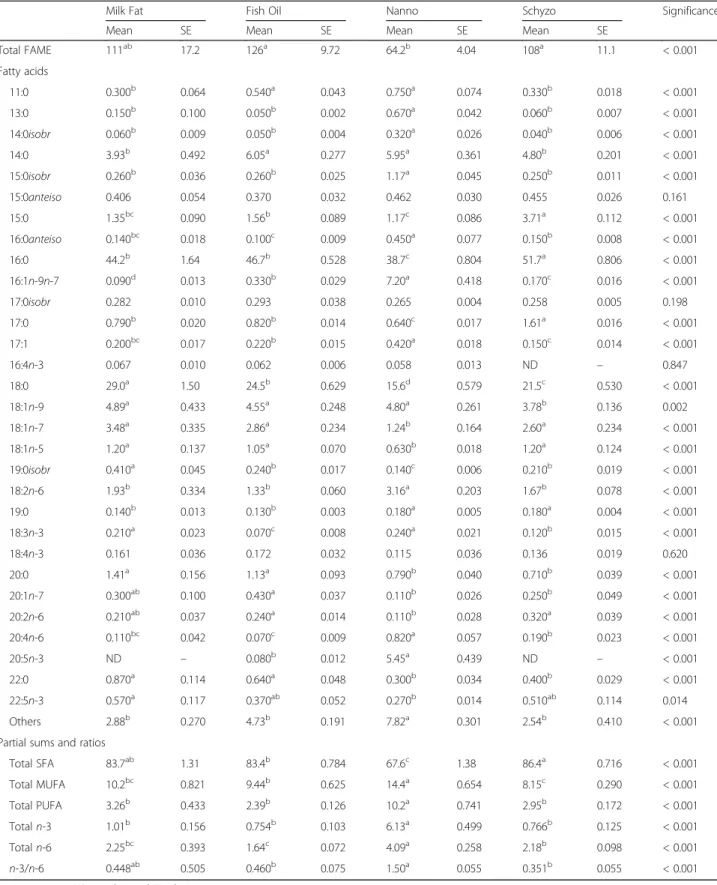
Table 3Total FAME (mg/g) and fatty acid composition (% total fatty acids) in faeces
Milk Fat Fish Oil Nanno Schyzo Significance
Mean SE Mean SE Mean SE Mean SE
Total FAME 111ab 17.2 126a 9.72 64.2b 4.04 108a 11.1 < 0.001
Fatty acids
11:0 0.300b 0.064 0.540a 0.043 0.750a 0.074 0.330b 0.018 < 0.001
13:0 0.150b 0.100 0.050b 0.002 0.670a 0.042 0.060b 0.007 < 0.001
14:0isobr 0.060b 0.009 0.050b 0.004 0.320a 0.026 0.040b 0.006 < 0.001
14:0 3.93b 0.492 6.05a 0.277 5.95a 0.361 4.80b 0.201 < 0.001
15:0isobr 0.260b 0.036 0.260b 0.025 1.17a 0.045 0.250b 0.011 < 0.001 15:0anteiso 0.406 0.054 0.370 0.032 0.462 0.030 0.455 0.026 0.161
15:0 1.35bc 0.090 1.56b 0.089 1.17c 0.086 3.71a 0.112 < 0.001
16:0anteiso 0.140bc 0.018 0.100c 0.009 0.450a 0.077 0.150b 0.008 < 0.001
16:0 44.2b 1.64 46.7b 0.528 38.7c 0.804 51.7a 0.806 < 0.001
16:1n-9n-7 0.090d 0.013 0.330b 0.029 7.20a 0.418 0.170c 0.016 < 0.001
17:0isobr 0.282 0.010 0.293 0.038 0.265 0.004 0.258 0.005 0.198
17:0 0.790b 0.020 0.820b 0.014 0.640c 0.017 1.61a 0.016 < 0.001
17:1 0.200bc 0.017 0.220b 0.015 0.420a 0.018 0.150c 0.014 < 0.001
16:4n-3 0.067 0.010 0.062 0.006 0.058 0.013 ND – 0.847
18:0 29.0a 1.50 24.5b 0.629 15.6d 0.579 21.5c 0.530 < 0.001
18:1n-9 4.89a 0.433 4.55a 0.248 4.80a 0.261 3.78b 0.136 0.002
18:1n-7 3.48a 0.335 2.86a 0.234 1.24b 0.164 2.60a 0.234 < 0.001
18:1n-5 1.20a 0.137 1.05a 0.070 0.630b 0.018 1.20a 0.124 < 0.001
19:0isobr 0.410a 0.045 0.240b 0.017 0.140c 0.006 0.210b 0.019 < 0.001
18:2n-6 1.93b 0.334 1.33b 0.060 3.16a 0.203 1.67b 0.078 < 0.001
19:0 0.140b 0.013 0.130b 0.003 0.180a 0.005 0.180a 0.004 < 0.001
18:3n-3 0.210a 0.023 0.070c 0.008 0.240a 0.021 0.120b 0.015 < 0.001
18:4n-3 0.161 0.036 0.172 0.032 0.115 0.036 0.136 0.019 0.620
20:0 1.41a 0.156 1.13a 0.093 0.790b 0.040 0.710b 0.039 < 0.001
20:1n-7 0.300ab 0.100 0.430a 0.037 0.110b 0.026 0.250b 0.049 < 0.001
20:2n-6 0.210ab 0.037 0.240a 0.014 0.110b 0.028 0.320a 0.039 < 0.001
20:4n-6 0.110bc 0.042 0.070c 0.009 0.820a 0.057 0.190b 0.023 < 0.001
20:5n-3 ND – 0.080b 0.012 5.45a 0.439 ND – < 0.001
22:0 0.870a 0.114 0.640a 0.048 0.300b 0.034 0.400b 0.029 < 0.001
22:5n-3 0.570a 0.117 0.370ab 0.052 0.270b 0.014 0.510ab 0.114 0.014
Others 2.88b 0.270 4.73b 0.191 7.82a 0.301 2.54b 0.410 < 0.001
Partial sums and ratios
Total SFA 83.7ab 1.31 83.4b 0.784 67.6c 1.38 86.4a 0.716 < 0.001
Total MUFA 10.2bc 0.821 9.44b 0.625 14.4a 0.654 8.15c 0.290 < 0.001
Total PUFA 3.26b 0.433 2.39b 0.126 10.2a 0.741 2.95b 0.172 < 0.001
Totaln-3 1.01b 0.156 0.754b 0.103 6.13a 0.499 0.766b 0.125 < 0.001
Totaln-6 2.25bc 0.393 1.64c 0.072 4.09a 0.258 2.18b 0.098 < 0.001
n-3/n-6 0.448ab 0.505 0.460b 0.075 1.50a 0.055 0.351b 0.055 < 0.001
n= 8 per group. ND, not detected. Total
SFA = 11:0 + 13:0 + 14:0isobr+ 14:0 + 15:0isobr+ 15:0anteiso+ 15:0 + 16:0anteiso+ 16:0 + 17:0isobr+ 17:0 + 18:0 + 19:0isobr+ 19:0 + 20:0 + 22:0; Total MUFA = 16:1n-9n-7 + 17:1 + 18:1n-9 + 18:1n-7 + 18:1n-5 + 20:1n-7; Total PUFA = 16:4n-3 + 18:2n-6 + 18:3n-3 + 18:4n-3 + 20:2n-6 + 20:4n-6 + 20:5n-3 + 22:5n-3; Totaln-3 = 16:4n-3 + 18:3n-3 + 18:4n-3 + 20:5n-3 + 22:5n-3; Totaln-6 = 18:2n-6 + 20:2n-6 + 20:4n-6.a,b,c
comparison to the others (P < 0.001), due to varia-tions in LA (P < 0.001), 20:2n-6 (P < 0.001), AA (P < 0.001) and 22:4n-6 (P < 0.001). The SFA sum
was similar across diets (P > 0.05), although small changes were observed for 15:0, 17:0, 18:0, 19:0, 20:0 and 22:0 (P < 0.001).
Table 4Total FAME (mg/g) and fatty acid composition (% total fatty acids) in liver
Milk Fat Fish Oil Nanno Schyzo Significance
Mean SE Mean SE Mean SE Mean SE
Total FAME 317ab 9.38 324ab 13.7 340a 16.5 308b 9.09 0.009
Fatty acids
12:0 0.103a 0.005 0.089a 0.007 0.129a 0.015 0.064b 0.005 < 0.001
14:0 1.67b 0.077 1.91ab 0.128 2.33a 0.137 1.19c 0.081 < 0.001
15:0 0.391c 0.009 0.525b 0.017 0.596b 0.025 1.05a 0.053 < 0.001
16:0 18.1b 0.186 24.2a 0.484 24.4a 0.510 24.3a 1.08 < 0.001
16:1n-9 0.416b 0.033 0.622a 0.055 0.421b 0.031 0.392b 0.026 0.008
16:1n-7 2.13b 0.220 3.40a 0.402 4.58a 0.471 1.74b 0.151 < 0.001
17:0isobr 0.274b 0.005 0.365a 0.019 0.357a 0.014 0.292ab 0.029 <0.001
17:0 0.221d 0.008 0.270c 0.015 0.346b 0.019 0.541a 0.025 <0.001
16:3n-4 0.212b 0.009 0.293a 0.020 0.322a 0.020 0.261ab 0.017 <0.001
17:1 0.089 0.005 0.109 0.008 0.098 0.007 0.104 0.015 0.192
18:0 6.10b 0.369 6.62ab 0.587 7.47ab 0.652 8.19a 0.359 0.003
18:1n-9 21.7b 0.289 24.9a 0.595 21.2b 0.329 19.2c 0.578 < 0.001
18:1n-7 2.00a 0.070 2.21a 0.060 2.25a 0.077 1.68b 0.056 < 0.001
19:0isobr 0.186b 0.006 0.227a 0.012 0.253a 0.016 0.157b 0.009 < 0.001
18:2n-6 30.7a 0.471 18.3c 0.325 21.6b 0.417 21.1b 0.259 < 0.001
19:0 0.412a 0.025 0.113d 0.005 0.167b 0.006 0.141c 0.002 < 0.001
18:3n-3 2.57a 0.293 1.33b 0.086 1.50b 0.097 1.38b 0.055 0.003
18:4n-3 0.145 0.025 0.114 0.012 0.083 0.021 0.093 0.025 0.269
20:1n-9 0.222b 0.008 0.574a 0.029 0.097c 0.003 0.071d 0.005 < 0.001
20:1n-7 0.103 0.014 0.121 0.018 0.099 0.007 0.099 0.012 0.688
20:2n-6 0.344a 0.021 0.126b 0.003 0.135b 0.004 0.100c 0.006 < 0.001
20:4n-6 5.88a 0.257 2.51b 0.308 4.37ab 0.254 5.40ab 0.324 < 0.001
20:4n-3 0.180ab 0.060 0.272a 0.033 0.117b 0.013 0.103b 0.014 < 0.001
20:5n-3 0.513c 0.075 2.17a 0.217 2.08a 0.209 0.900b 0.093 < 0.001
22:4n-6 0.242a 0.014 0.053b 0.003 0.091b 0.005 0.100ab 0.017 < 0.001
22:5n-3 0.715b 0.081 1.18a 0.070 1.31a 0.112 0.409b 0.081 < 0.001
22:6n-3 1.33b 0.067 3.85a 0.293 0.598c 0.051 6.43a 1.18 < 0.001
Others 3.04ab 0.089 3.40b 0.120 3.05a 0.057 4.53c 0.265 < 0.001
Partial sums and ratios
Total SFA 27.4b 0.288 34.4a 0.846 36.1a 0.980 35.9a 1.55 < 0.001
Total MUFA 26.7b 0.492 32.0a 0.955 28.7ab 0.780 23.3c 0.756 < 0.001
Total PUFA 42.8a 0.378 30.2c 1.04 32.1bc 0.885 36.3b 1.83 < 0.001
Totaln-3 5.45b 0.505 8.92a 0.599 5.69b 0.430 9.31a 1.36 < 0.001
Totaln-6 37.2a 0.604 21.0c 0.555 26.1b 0.544 26.7b 0.554 < 0.001
n-3/n-6 0.148c 0.017 0.423a 0.022 0.217b 0.013 0.343ab 0.044 < 0.001
n= 8 per group. Total SFA = 12:0 + 14:0 + 15:0 + 16:0 + 17:0isobr+ 17:0 + 18:0 + 19:0isobr+ 19:0; Total MUFA = 16:1n-9 + 16:1n-7 + 18:1n-9 + 18:1n-7 + 20:1n -9 + 20:1n-7; Total PUFA = 16:3n-4 + 18:2n-6 + 18:3n-3 + 18:4n-3 + 20:2n-6 + 20:4n-6 + 20:4n-3 + 20:5n-3 + 22:4n-6 + 22:5n-3 + 22:6n-3; Totaln-3 = 18:3n-3 + 18:4n-18:3n-3 + 20:4n-18:3n-3 + 20:5n-18:3n-3 + 22:5n-18:3n-3 + 22:6n-18:3n-3; Totaln-6 = 18:2n-6 + 20:2n-6 + 20:4n-6 + 22:4n-6.a,b,c
Table 5Total FAME (mg/g) and fatty acid composition (% total fatty acids) in erythrocytes
Milk Fat Fish Oil Nanno Schyzo Significance
Mean SE Mean SE Mean SE Mean SE
Total FAME 9.82 0.718 10.6 0.455 10.8 0.320 11.7 0.889 0.521
Fatty acids
14:0 0.550 0.052 0.680 0.044 0.730 0.037 0.780 0.170 0.068
15:0 0.360a 0.024 0.430a 0.027 0.450b 0.011 0.940 0.066 < 0.001
16:0anteiso 2.34 0.071 2.31 0.062 2.61 0.094 2.24 0.111 0.050
16:0 23.9 1.18 25.7 1.09 26.0 0.459 24.8 0.942 0.329
16:1n-9 0.120b 0.017 0.190a 0.007 0.160b 0.005 0.160ab 0.012 0.005
16:1n-7 0.320c 0.033 0.520ab 0.035 0.720a 0.068 0.420bc 0.040 < 0.001
17:0isobr 0.260c 0.006 0.270c 0.007 0.300b 0.004 0.330a 0.005 < 0.001
17:0 0.460c 0.010 0.440c 0.010 0.580b 0.007 0.760a 0.009 < 0.001
16:3n-4 0.300b 0.022 0.320ab 0.029 0.350ab 0.030 0.390a 0.016 0.009
17:1 0.230a 0.012 0.210a 0.012 0.190a 0.015 0.150b 0.008 < 0.001
16:3n-3 2.44 0.066 2.42 0.077 2.50 0.065 2.64 0.162 0.609
16:4n-3 1.27a 0.034 1.16ab 0.038 1.08b 0.035 0.890c 0.042 < 0.001
18:0 13.8a 0.138 13.1b 0.204 13.5ab 0.213 12.9b 0.228 0.004
18:1n-9 7.84b 0.073 8.50a 0.058 8.00ab 0.257 8.04ab 0.281 < 0.001
18:1n-7 2.24a 0.067 2.29a 0.051 2.21a 0.048 1.92b 0.047 < 0.001
18:2n-6 13.2a 0.130 11.6b 0.195 11.1b 0.172 11.2b 0.424 < 0.001
19:0 0.090a 0.009 0.070b 0.002 0.080a 0.002 0.080a 0.005 < 0.001
18:3n-3 0.140a 0.019 0.090b 0.004 0.060c 0.005 0.070bc 0.011 < 0.001
20:0 0.110ab 0.006 0.090b 0.006 0.100ab 0.005 0.130a 0.013 0.047
20:1n-9 0.080b 0.005 0.400a 0.043 0.070b 0.009 0.090b 0.012 < 0.001
20:1n-7 0.077 0.006 0.094 0.007 0.086 0.009 0.085 0.004 0.339
20:2n-6 0.370a 0.023 0.200b 0.024 0.170b 0.009 0.190b 0.016 < 0.001
20:4n-6 20.5a 0.617 14.6c 0.570 17.7b 0.172 17.9b 0.725 < 0.001
20:4n-3 0.410ab 0.386 0.080b 0.012 0.060b 0.002 0.490a 0.110 < 0.001
20:5n-3 0.260c 0.026 3.08a 0.114 2.33b 0.054 0.470c 0.254 < 0.001
22:0 0.290b 0.026 0.270b 0.032 0.280b 0.009 0.390a 0.354 0.002
22:4n-6 1.51a 0.118 0.250d 0.023 0.550b 0.021 0.390c 0.281 < 0.001
22:5n-6 0.340b 0.021 0.100d 0.007 0.140c 0.008 1.75a 1.50 < 0.001
22:5n-3 1.94bc 0.426 2.55b 0.177 3.50a 0.094 0.950c 0.654 < 0.001
24:0 0.890 0.089 0.827 0.077 0.849 0.038 0.932 0.625 0.747
22:6n-3 1.22c 0.097 4.24b 0.353 0.680d 0.061 5.78a 0.484 < 0.001
24:1n-9 0.452 0.046 0.570 0.070 0.400 0.032 ND – 0.106
Others 1.69b 0.029 2.37a 0.080 2.47a 0.026 1.76b 0.057 < 0.001
Partial sums and ratios
Total SFA 43.0 1.16 44.2 1.03 45.5 0.646 44.3 0.896 0.221
Total MUFA 11.4b 0.119 12.8a 0.148 11.8ab 0.396 10.9b 0.332 < 0.001
Total PUFA 43.9a 1.14 40.7ab 1.11 40.2b 0.389 43.1a 1.00 0.008
Totaln-3 7.68c 0.701 13.6a 0.691 10.2b 0.155 11.3a 0.556 < 0.001
Totaln-6 35.9a 0.659 26.8d 0.457 29.7c 0.166 31.4b 0.576 < 0.001
n-3/n-6 0.214c 0.018 0.509a 0.018 0.344b 0.004 0.359b 0.015 < 0.001
n= 8 per group. ND, not detected. Total SFA = 14:0 + 15:0 + 16:0anteiso+ 16:0 + 17:0isobr+ 17:0 + 18:0 + 19:0 + 20:0 + 22:0 + 24:0; Total MUFA = 16:1 n-9 + 16:1n-7 + 17:1 + 18:1n-9 + 18:1n-7 + 20:1n-9 + 20:1n-7 + 24:1n-9; Total PUFA = 16:3n-4 + 16:3n-3 + 16:4n-3 + 18:2n-6 + 18:3n-3 + 20:2n-6 + 20:4 n-6 + 20:4n-3 + 20:5n-3 + 22:4n-6 + 22:5n-6 + 22:5n-3 + 22:6n-3; Totaln-3 = 16:3n-3 + 16:4n-3 + 18:3n-3 + 20:4n-3 + 20:5n-3 + 22:5n-3 + 22:6n-3; Total n-6 = 18:2n-6 + 20:2n-6 + 20:4n-6 + 22:4n-6 + 22:5n-6.a,b,c
Fatty acid composition and major phospholipid classes in brain
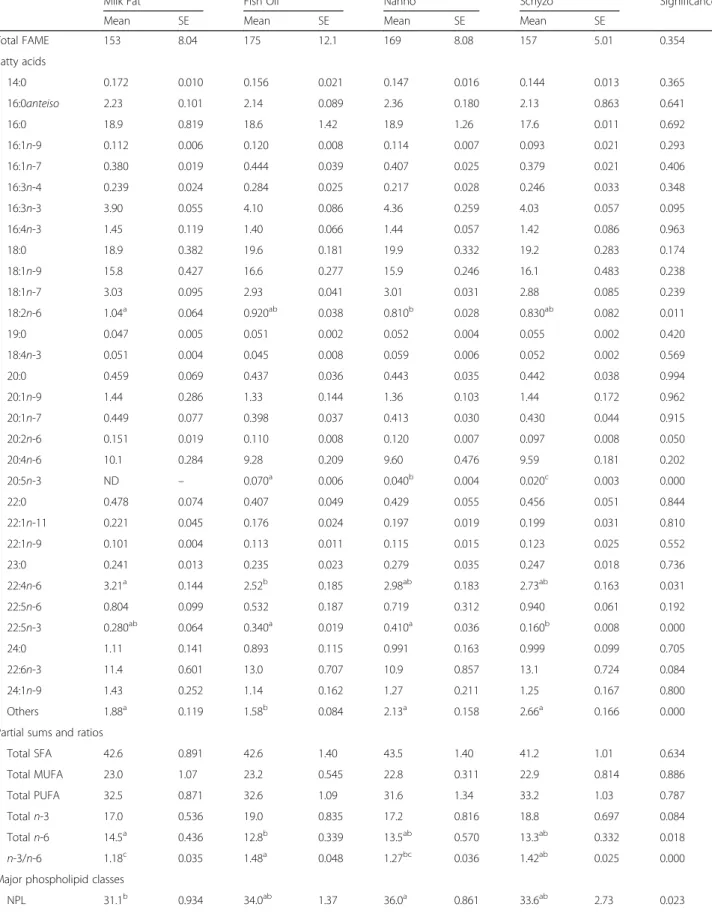
FA composition in brain is presented in Table 6. Whereas the liver displayed the highest number of varia-tions depending on diet, the brain tissue was less re-sponsive. SFA, MUFA, PUFA and n-3 PUFA were unchanged across dietary treatments (P > 0.05). n-6 PUFA was higher in Milk Fat in comparison to Fish Oil (P= 0.018), but identical to Nanno and Schyzo, most at the expenses of LA (P= 0.011) and 22:4n-6 (P= 0.031). The n-3/n-6 ratio reached the highest value in Fish Oil fed rats relative to Milk Fat and Nanno (P = 0.000). As expected, EPA was not detected in Milk Fat and it was best incorporated in Fish Oil fed rats (P = 0.000). DHA did not vary across diets (P> 0.05).
The major phospholipids classes in brain are also shown in Table 6. In comparison to Milk Fat, Nanno fed rats had increased non-polar lipids (NPL) but decreased phosphatidylcholine (PC) (P < 0.05). No additional changes were found for phosphatidylethanolamine (PE) and phosphatidylserine (PS) fractions across dietary groups (P> 0.05).
Behaviour, serotonin and catecholamines
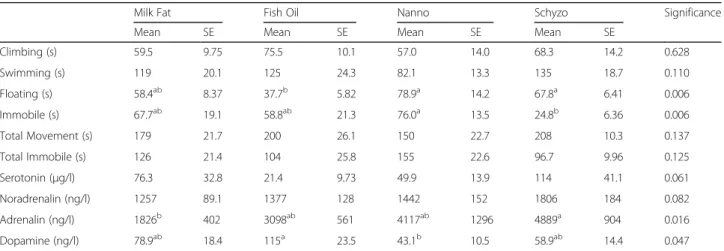
The FST outcomes are presented in Table 7 along with serotonin and catecholamines levels in plasma. Rats fed Nanno and Schyzo diets spent more time floating than rats fed Fish Oil (P < 0.05). In turn, Nanno had more time immobile than Schyzo (P < 0.05). Climbing and swimming were unchanged (P< 0.05) by diet. Adrenalin was increased in Schyzo relative to Milk Fat (P < 0.05). Fish Oil fed rats had higher dopamine levels than Nanno (P< 0.05). Serotonin and noradrenalin presented similar values across dietary treatments (P< 0.05).
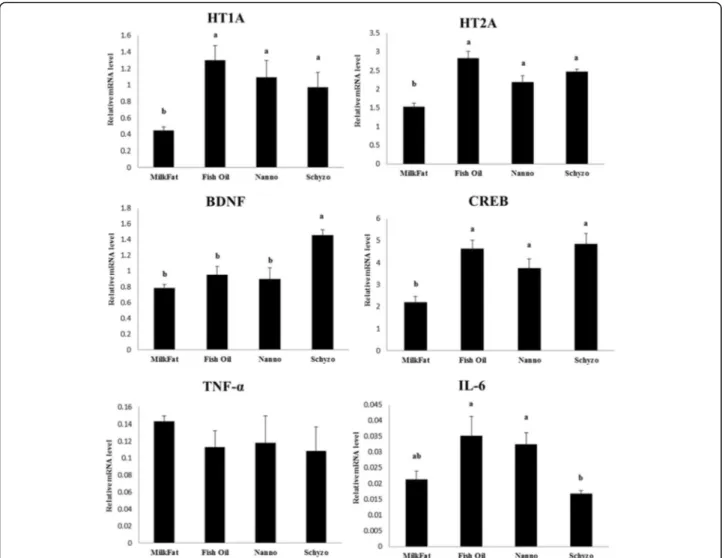
Neuromodulation transcriptional profile
The transcriptional profile of HT1A, HT2A, BDNF, CREB, TNF-α and IL-6 in the hippocampus of rats fed Milk Fat, Fish Oil, Nanno and Schyzo diets are shown in Fig. 1. A similar pattern of variations was found for HT1A, HT2A and CREB being these genes consistently downregulated in Milk Fat in comparison to n-3 LCPUFA diets (P < 0.05). BDNF gene was upregulated by Schyzo diet (P < 0.05). The gene expression levels of IL-6 were equally higher in Fish Oil and Nanno fed rats, and lower in Schyzo (P < 0.05). mRNA levels of TNF-α were similar across dietary groups (P > 0.05). More-over, mRNA expression levels of HT1A, HT2A and CREB were moderately (0.7 ≥ r ≥ 0.3) positively cor-related with n-3/n-6 PUFA ratio in erythrocytes (r = 0.532, P = 0.002; r= 0.673, P < 0.001; r= 0.539, P = 0.001, respectively).
Discussion
Facing the premise that EPA and DHA are a safe and inexpensive link to a healthier long life devoid of neurological disturbances, this investigation is of utmost importance to promote sustainability of mar-ine lipid resources and to reduce the environmental impact of fishery without compromising human health needs.
The potential of EPA and DHA to reduce cholesterol levels using experimental animal models has been widely reported [32, 33]. Recently, Ramsden et al. [34] demon-strated that reducing serum cholesterol does not trans-late into a lower risk from coronary heart disease and improved human survival, increasing the debate on this topic. Notwithstanding, the biggest reduction on LDL-cholesterol was observed in Fish Oil, rather than in Nanno or Schyzo comparative to Milk Fat fed rats. This might be related to the fact that those microalgae enriched diets contained only EPA or DHA, instead of the combined form. Moreover, EPA and DHA combined as well as single EPA reduced total lipids in plasma, in opposition to single DHA; hence, the positive effects found might be due to EPA action. TAG values were higher in Milk Fat fed rats in comparison to the others. Once again, this effect derives from the fact that milk fat did not contain EPA or DHA. Glucose was higher in Milk Fat and lower in n-3 LCPUFA enriched diets. Although controversial, several studies point to a diabe-togenic effect of SFA with respect to PUFA [35, 36]. This seems to be the case here, given the fact that glucose was higher in rats fed only with Milk Fat. Hepatic markers were measured to determine if microalgae (Nannochloropsis and Schizochytrium) could be toxic. This is a crucial fact because DHA increases the activity of detoxification enzymes in the liver [37], as verified in Fish Oil and Schyzo fed rats for AST and ALT. Even if
AST was deviated from the reference values
(42.9 ± 10.1 U/l) [38], n-3 LCPUFA enriched diets did not affect liver and renal function, as indicated by the normal values of urea and creatinine. The small varia-tions observed among dietary groups are believed to have no pathophysiological impact.
Table 6Total FAME (mg/g), fatty acid composition (% total fatty acids) and major phospholipid classes in brain
Milk Fat Fish Oil Nanno Schyzo Significance
Mean SE Mean SE Mean SE Mean SE
Total FAME 153 8.04 175 12.1 169 8.08 157 5.01 0.354
Fatty acids
14:0 0.172 0.010 0.156 0.021 0.147 0.016 0.144 0.013 0.365
16:0anteiso 2.23 0.101 2.14 0.089 2.36 0.180 2.13 0.863 0.641
16:0 18.9 0.819 18.6 1.42 18.9 1.26 17.6 0.011 0.692
16:1n-9 0.112 0.006 0.120 0.008 0.114 0.007 0.093 0.021 0.293
16:1n-7 0.380 0.019 0.444 0.039 0.407 0.025 0.379 0.021 0.406
16:3n-4 0.239 0.024 0.284 0.025 0.217 0.028 0.246 0.033 0.348
16:3n-3 3.90 0.055 4.10 0.086 4.36 0.259 4.03 0.057 0.095
16:4n-3 1.45 0.119 1.40 0.066 1.44 0.057 1.42 0.086 0.963
18:0 18.9 0.382 19.6 0.181 19.9 0.332 19.2 0.283 0.174
18:1n-9 15.8 0.427 16.6 0.277 15.9 0.246 16.1 0.483 0.238
18:1n-7 3.03 0.095 2.93 0.041 3.01 0.031 2.88 0.085 0.239
18:2n-6 1.04a 0.064 0.920ab 0.038 0.810b 0.028 0.830ab 0.082 0.011
19:0 0.047 0.005 0.051 0.002 0.052 0.004 0.055 0.002 0.420
18:4n-3 0.051 0.004 0.045 0.008 0.059 0.006 0.052 0.002 0.569
20:0 0.459 0.069 0.437 0.036 0.443 0.035 0.442 0.038 0.994
20:1n-9 1.44 0.286 1.33 0.144 1.36 0.103 1.44 0.172 0.962
20:1n-7 0.449 0.077 0.398 0.037 0.413 0.030 0.430 0.044 0.915
20:2n-6 0.151 0.019 0.110 0.008 0.120 0.007 0.097 0.008 0.050
20:4n-6 10.1 0.284 9.28 0.209 9.60 0.476 9.59 0.181 0.202
20:5n-3 ND – 0.070a 0.006 0.040b 0.004 0.020c 0.003 0.000
22:0 0.478 0.074 0.407 0.049 0.429 0.055 0.456 0.051 0.844
22:1n-11 0.221 0.045 0.176 0.024 0.197 0.019 0.199 0.031 0.810
22:1n-9 0.101 0.004 0.113 0.011 0.115 0.015 0.123 0.025 0.552
23:0 0.241 0.013 0.235 0.023 0.279 0.035 0.247 0.018 0.736
22:4n-6 3.21a 0.144 2.52b 0.185 2.98ab 0.183 2.73ab 0.163 0.031
22:5n-6 0.804 0.099 0.532 0.187 0.719 0.312 0.940 0.061 0.192
22:5n-3 0.280ab 0.064 0.340a 0.019 0.410a 0.036 0.160b 0.008 0.000
24:0 1.11 0.141 0.893 0.115 0.991 0.163 0.999 0.099 0.705
22:6n-3 11.4 0.601 13.0 0.707 10.9 0.857 13.1 0.724 0.084
24:1n-9 1.43 0.252 1.14 0.162 1.27 0.211 1.25 0.167 0.800
Others 1.88a 0.119 1.58b 0.084 2.13a 0.158 2.66a 0.166 0.000
Partial sums and ratios
Total SFA 42.6 0.891 42.6 1.40 43.5 1.40 41.2 1.01 0.634
Total MUFA 23.0 1.07 23.2 0.545 22.8 0.311 22.9 0.814 0.886
Total PUFA 32.5 0.871 32.6 1.09 31.6 1.34 33.2 1.03 0.787
Totaln-3 17.0 0.536 19.0 0.835 17.2 0.816 18.8 0.697 0.084
Totaln-6 14.5a 0.436 12.8b 0.339 13.5ab 0.570 13.3ab 0.332 0.018
n-3/n-6 1.18c 0.035 1.48a 0.048 1.27bc 0.036 1.42ab 0.025 0.000
Major phospholipid classes
even if these determinations were performed in different tissues. IL-6 has been reported to increase hepatic syn-thesis of cholesterol [41] which possibly explains the high levels of cholesterol found in Schyzo fed rats relative to the othern-3 LCPUFA diets.
The FA profile in faeces was assessed to determine FA loss, compared to the amount provided by diet. The fatty acid content was higher in Fish Oil and lower in Nanno which means that Nanno fed rats had a higher absorp-tion of FA in the organism. Nannochloropsis is indeed efficiently incorporated into the blood, liver and brain lipids of rats [32]. EPA was found higher in Nanno and residual in Fish Oil, which concurs with diet compos-ition. The same explanation applies to Milk Fat or Schyzo with no traces of EPA in faeces. As expected, DHA was not detected in faeces of any dietary group because DHA is highly retained by the body [42, 43].
Liver is the key organ in lipid and lipoprotein metabol-ism [44]. It is very sensitive to dietary FA variations [44], as observed here. Indeed, n-6 PUFA content declined while n-3 PUFA generally increased with substitution of fat richer inn-3 LCPUFA, thus leading to a marked im-provement in n-3/n-6 ratio. These changes may be mainly attributed to LA reduction and to EPA and DHA overall increase and corroborate previous studies in
which liver FA profile displayed approximately 2-fold in-crease of DHA% after dietary supplementation with DHA and othern-3 LCPUFA [44, 45]. Moreover, liver is considered to be the major site for the conversion of ALA into DHA [46]. Our results seem to contradict Barceló-Coblijn and Murphy [47], who reported that dietary ALA is a crucial source of n-3 LCPUFA for maintaining these FA tissue contents. In this particular case, it can be argued that ALA content was still insuffi-cient for offsetting the effects of the large amount of milk fat.
The FA profile of erythrocytes, representative of systemic FA bioavailability, showed similar alterations to the liver, although in a lower magnitude. PUFA levels were higher than MUFA, which was expected since PUFA was lower in faeces, indicating a better absorption of these FA by the organism. Within PUFA, n-6 was found higher over n-3, which is also logical because all diets had higher n-6 relative to n -3. ARA concentrations were elevated in rats fed high levels of LA, likely as a result of higher ARA synthe-sis rates [48]. EPA, although found in residual levels (less than 1%), was higher in Fish Oil than in Nanno fed rats and this result contradicts diet composition. The reason for this finding is that EPA was more
Table 6Total FAME (mg/g), fatty acid composition (% total fatty acids) and major phospholipid classes in brain(Continued)
Milk Fat Fish Oil Nanno Schyzo Significance
Mean SE Mean SE Mean SE Mean SE
PE 33.4 0.732 33.4 0.956 31.9 0.621 34.3 1.55 0.288
PS 21.9 1.21 20.5 2.03 20.5 0.658 18.3 1.89 0.468
PC 13.6a 0.141 12.1ab 0.706 11.6b 0.523 13.9ab 0.776 0.016
n= 8 per group. ND, not detected. NPL, non-polar lipids; PE, phosphatidylethanolamine; PS, phosphatidylserine; PC, phosphatidylcholine. Total SFA = 14:0 + 16:0anteiso+ 16:0 + 18:0 + 19:0 + 20:0 + 22:0 + 23:0 + 24:0; Total MUFA = 16:1n-9 + 16:1n-7 + 18:1n-9 + 18:1n-7 + 20:1n-9 + 20:1 n-7 + 22:1n-11 + 22:1n-9 + 24:1n-9; Total PUFA = 16:3n-4 + 16:3n-3 + 16:4n-3 + 18:2n-6 + 18:4n-3 + 20:2n-6 + 20:4n-6 + 20:5n-3 + 22:4n-6 + 22:5 n-6 + 22:5n-3 + 22:6n-3; Totaln-3 = 16:3n-3 + 16:4n-3 + 18:4n-3 + 20:5n-3 + 22:5n-3 + 22:6n-3; Totaln-6 = 18:2n-6 + 20:2n-6 + 20:4n-6 + 22:4 n-6 + 22:5n-6.a,b,c
Means in the same row with different superscripts are statistically different (PDIFF adjust Tukey, P< 0.05)
Table 7FST outcomes, serotonin and catecholamines in plasma
Milk Fat Fish Oil Nanno Schyzo Significance
Mean SE Mean SE Mean SE Mean SE
Climbing (s) 59.5 9.75 75.5 10.1 57.0 14.0 68.3 14.2 0.628
Swimming (s) 119 20.1 125 24.3 82.1 13.3 135 18.7 0.110
Floating (s) 58.4ab 8.37 37.7b 5.82 78.9a 14.2 67.8a 6.41 0.006
Immobile (s) 67.7ab 19.1 58.8ab 21.3 76.0a 13.5 24.8b 6.36 0.006
Total Movement (s) 179 21.7 200 26.1 150 22.7 208 10.3 0.137
Total Immobile (s) 126 21.4 104 25.8 155 22.6 96.7 9.96 0.125
Serotonin (μg/l) 76.3 32.8 21.4 9.73 49.9 13.9 114 41.1 0.061
Noradrenalin (ng/l) 1257 89.1 1377 128 1442 152 1806 184 0.082
Adrenalin (ng/l) 1826b 402 3098ab 561 4117ab 1296 4889a 904 0.016
Dopamine (ng/l) 78.9ab 18.4 115a 23.5 43.1b 10.5 58.9ab 14.4 0.047
converted to 22:5n-3, a downstream product of EPA in Nanno fed rats. DHA was found higher in Schyzo and lower in Nanno which was expected because Nanno diet had no DHA. The residual levels found might be due to the biosynthesis of DHA from the n -3 precursor (ALA) [49] or by EPA in the Nanno group [50]. The same conversion might also have happened in Milk Fat group. Taking into account the highest percentage of n-3 PUFA and EPA, and also a high percentage of DHA in erythrocytes, Fish Oil is proven the best dietary source for systemic incorpor-ation of these FA in the organism.
On a per-weight basis, brain is the tissue richest in lipids [51]. It is the most conservative organ in terms of DHA uptake [43, 44] where it composes ~10% of total FA [52]. DHA is essential for maintaining nor-mal brain structure, function and metabolism and its concentration depends on dietary DHA content as
well as liver synthesis from its shorter chain nutri-tionally essential PUFA precursor ALA [49]. In fact, DHA synthesis directly in brain tissues is very low [53]. Herein, the non-variation of DHA reinforces the notion that DHA is rapidly absorbed and retained in brain cell membranes [42]. We speculate that the levels found might have been incorporated prior to the administration of DHA, through diet [54]. Any ability to detect changes in EPA in the brain is unex-pected. EPA is rapidly and extensively β-oxidised upon entry into the brain [55]. Anyway, we found that rats fed Fish Oil had the highest % of EPA, followed by Nanno and Schyzo groups. These data are in accordance with EPA levels found in erythro-cytes and faeces, in which Fish Oil group presented the highest and lowest % of EPA, respectively. The undetected EPA in Milk Fat fed rats correlates well with diet composition.
FA composition of the two major phospholipids classes, PE and PC, was found to be specific: PC con-tains mostly SFA and 18:1 fatty acids, while PE is rich in PUFA [56]. Changes in SFA/PUFA ratio are likely to influence cellular function, which could impair neurophysiological performances [57, 58]. Even if we failed to characterise the FA composition in brain phospholipid classes, our data suggest a compensatory mechanism of reduced PC fraction while increasing NPL (the majority of which is composed of choles-terol) between Nanno and Milk Fat dietary groups. The lipid class-dependent nature of these variations reflects generally differences in intake and metabolism [59]. Lamaziere et al. [51] reported that the provision of fish oil to rats did not modify PS, in accordance to our data, but increased the proportion of DHA-containing PC. The PE fraction, in which DHA ac-counts for around 25% (wt%) of total FA [60] was similarly altered by n-3 PUFA administration [51], in contrast to our findings.
With respect to FST parameters, it would be ex-pected higher immobile and floating times in Milk Fat (without n-3 LCPUFA supplementation) fed rats because these behaviours are recognised as passive and non-active indicators, respectively [26]. Regarding immobility, Nanno fed rats spent more time immobile than Schyzo. DHA has been referred as a possible nutrient for retarding depression and anxiety, sup-porting the lower immobility time found in Schyzo. Notwithstanding, the immobility time found in Milk Fat was lower than expected and not consistent with the hypothesis initially proposed or with other studies [5, 61]. The lack of positive behaviour in Nanno fed rats can be explained by the high levels of EPA found in faeces. Regarding floating time, Nanno and Schyzo were similar to each other, but higher than Fish Oil. Once more, this possibly indicates that single EPA or DHA are not as beneficial as EPA + DHA, in agree-ment with observations by Mozaffarian and Wu [62] on cardiovascular health. The only setback is that floating time was also identical between Milk Fat and Fish Oil. In fact, Milk Fat behavioural outcomes were similar to other dietary groups. The presence of DHA in brain of rats fed Milk Fat, in identical amounts to those of n-3 LCPUFA enriched diets, can help to explain this similarity.
Adrenalin is a stress hormone [63] whose levels seem to decrease with fish oil administration [64, 65]. A tendency for reduced adrenalin was observed in Fish Oil fed rats relative to Nanno and Schyzo, in ac-cordance with literature [64, 65]. However, Milk Fat group had the lowest adrenalin levels but this diet did not contain EPA or DHA. Moreover, its levels are similar to those found in both Fish Oil and Nanno,
but different from Schyzo, leading us to the assump-tion that neither EPA nor DHA affect adrenalin system, with EPA having a less predominant role, contradicting other reports. On the topics of cate-cholamines regulation, low levels of dopamine have been associated with PUFA deficiency [65–67]. Higher levels of dopamine were found in Fish Oil group whereas lower were found in Nanno. Therefore, it can be assumed that EPA alone has a smaller impact on regulating dopaminergic system, than combined with DHA.
HT1A and HT2A are related to neural function. Levant et al. [68] have shown that rats with low levels of DHA in brain have less serotonin (5-HT) and higher hippocampal density of 5-HT1A. Serotonin in plasma was found similar across dietary groups although a tendency for high levels were found in Schyzo fed rats, which concurs with diet composition. The transcriptional profile of HT1A and HT2A was consistently upregulated by EPA, DHA or both FA, rather than only by DHA. Accordingly, more research on this subject is required. The vari-ation of CREB expression is positive, given its role in learning and memory, brain traumas recovery and stress [69]. Although not consensual [68], it corrobo-rates the literature pointing towards the normalization of CREB by n-3 LCPUFA enriched diets. Also, HT1A, HT2A and CREB mRNA levels in hippocampus were found positively correlated with n-3/n-6 PUFA in erythrocytes. This ratio is considered a biomarker of systemic inflammation [70, 71] consolidating, once again, the neuroprotective effects of EPA and DHA. CREB is also a transcription factor contributing for BDNF regulation [72, 73]. This later gene was found powerfully expressed by individual DHA.
Conclusions
magnitude as EPA and DHA combined, in opposition to DHA provided by Schizochytrium microalga, allow-ing us to conclude that the protective effects on plasma lipid profile might be due, to a large extent, to EPA action. Apart from the positive variation of BDNF mRNA levels by DHA alone, the combination of EPA and DHA can provide protection against re-duced plasticity and impaired learning ability by up-regulating HT1A, HT2A and CREB genes in the hippocampus. Taken together, a diet enriched in EPA + DHA form seems more adequate for health promotion, in various critical domains of neurophysi-ology and lipid metabolism, which can benefit, in the long run, neuronal structure and function.
Abbreviations
γ-GT:gamma glutamyl transferase; AA: arachidonic acid; ALA:α-linolenic acid; ALP: alkaline phosphatase; ALT: alanine aminotransferase; AST: aspartate aminotransferase; BDNF: brain-derived neurotrophic factor; CREB: cAMP responsive element binding protein; DHA: docosahexaenoic acid; EPA: eicosapentaenoic acid; FA: fatty acid; FAME: fatty acid methyl esters; FST: forced swimming test; HT1A: serotonin 5-HT1A receptor;
HT2A: serotonin 5-HT2A receptor; IL-6: interleukin-6; LA: linoleic acid;n-3 LCPUFA:n-3 long chain polyunsaturated fatty acids; NPL: non-polar lipids; PC: phosphatidylcholine; PE: phosphatidylethanolamine;
PS: phosphatidylserine; TAG: triacylglycerols; TNF-α: tumour necrosis factor alpha
Acknowledgments
The authors acknowledge Júlia Ferreira from IPMA regarding lipid analyses.
Funding
This study was supported by the Spanish Ministry of Science and Innovation through“Structured lipids: novel dietary strategies for improving human health”grant (AGL/25807/2011) and by Fundação para a Ciência e a Tecnologia (FCT, Lisbon, Portugal) through CIISA project (UID/CVT/00276/ 2013). PAL is a researcher from Incentivo 2014 project (AGR/UI0276/2014). SVM, CC and CA are recipients of individual fellowships from FCT (SFRH/BPD/ 63019/2009, SFRH/BPD/102689/2014 and SFRH/BPD/64951/2009,
respectively).
Availability of data and materials
The datasets analysed during the current study are available from the corresponding author on reasonable request.
Authors’contributions
PAL, SVM and MSM performed the animal experiment. JLGG and JM performed the behaviour test. PAL, SVM, CMA, MCP and RMAP conducted the laboratory work. PAL, CC and CA prepared the manuscript. NMB, JLGG and JAMP were responsible for the experimental design, interpretation of results and final version of the manuscript. All authors read and approved the final manuscript.
Ethics approval
The experimental procedures were reviewed by the Ethics Commission of CIISA/FMV and approved by the Animal Care Committee of the National Veterinary Authority (Direcção-Geral de Alimentação e Veterinária, Portugal), following the appropriate European Union guidelines (2010/63/EU Directive) to minimise animal suffering.
Consent for publication Not applicable.
Competing interests
The authors declare that they have no competing interests.
Publisher’s Note
Springer Nature remains neutral with regard to jurisdictional claims in published maps and institutional affiliations.
Author details
1CIISA, Faculdade de Medicina Veterinária, Universidade de Lisboa, Avenida da Universidade Técnica, 1300-477 Lisbon, Portugal.2DIVAV, Instituto Português do Mar e da Atmosfera (IPMA), Av. Brasília, 1449-006 Lisbon, Portugal.3CIIMAR, Universidade do Porto, Rua dos Bragas, 289, 4050-123 Porto, Portugal.4Depsiextracta - Tecnologias Biológicas, Lda., Quinta do Monte Novo-Taipadas, 2985-064 Canha, Portugal.5iMed.UL, Faculdade de Farmácia, Universidade de Lisboa, Avenida Professor Gama Pinto, 1649-003 Lisbon, Portugal.6Joaquim Chaves Saúde. Dr. Joaquim Chaves, Laboratório de Análises Clínicas, 1495-148 Miraflores, Algés, Portugal.7Departamento de Tecnología de Alimentos, Universidad de Almería, 04120 Almería, Spain.
Received: 11 July 2017 Accepted: 22 September 2017
References
1. Harman D. The aging process (free radicals/evolution/antioxidants/ degenerative diseases/longevity). PNAS. 1981;78:7124–8.
2. WHO, World Health Organization. Ageing and life course: interesting facts about ageing. 2012 (available online at http://www.who.int/ageing/about/ facts/en/).
3. Klenk J, Keil U, Jaensch A, Christiansen MC, Nagel G. Changes in life expectancy 1950–2010: contributions from age- and disease- specific mortality in selected countries. Popul Health Metrics. 2016;14:20. 4. Dyall SC, Michael-Titus AT. Neurological benefits of omega-3 fatty acids.
NeuroMolecular Med. 2008;10:219–35.
5. Ferraz AC, Delattre AM, Almendra RG, Sonagli M, Borges C, Araujo P, Andersen ML, Tufik S, Lima MM. Chronicω-3 fatty acids supplementation promotes beneficial effects on anxiety, cognitive and depressive-like behaviors in rats subjected to a restraint stress protocol. Behav Brain Res. 2011;219:116–22.
6. Cutuli D, De Bartolo P, Caporali P, Laricchiuta D, Foti F, Ronci M, Rossi C, Neri C, Spalletta G, Caltagirone C, Farioli-Vecchioli S, Petrosini L.n-3 polyunsaturated fatty acids supplementation enhances hippocampal functionality in aged mice. Front Aging Neurosci. 2014;6:220. https://doi.org/ 10.3389/ fnagi.2014.00220.
7. Molfino A, Gioia G, Rossi Fanelli F, Muscaritoli M. The role for dietary omega-3 fatty acids supplementation in older adults. Nutrients. 2014;6:4058–72. 8. Logan AC. Neurobehavioral aspects of omega-3 fatty acids: possible
mechanisms and therapeutic value in major depression. Altern Med Ver. 2003;8:410–25.
9. Chalon S, Delion-Vancassel S, Belzung C, Guilloteau D, Leguisquet AM, Besnard JC, Durand G. Dietary fish oil affects monoaminergic neurotransmission and behavior in rats. J Nutr. 1998;128:2512–9. 10. Burdge GC, Finnegan YE, Minihane AM, Williams CM, Wootton CA. Effect of
altered dietary n-3 fatty acid intake upon plasma lipid fatty acid composition, conversion of [13C]alpha-linolenic acid to longer-chain fatty acids and partitioning towards beta-oxidation in older men. Brit J Nutr. 2003;90:311–21.
11. Calder PC. Mechanisms of action of (n-3) fatty acids. J Nutr. 2012;142:592S–9. 12. Adarme-Vega TC, Thomas-Hall SR, Schenk PM. Towards sustainable sources
for omega-3 fatty acids production. Curr Opin Biotechnol. 2014;26:14–8. 13. Winwood RJ. Recent developments in the commercial production of DHA
and EPA rich oils from micro-algae. OCL. 2013;20:D604.
14. Marangoni F, Poli A.n-3 fatty acids: functional differences between food intake, oral supplementation and drug treatments. Int J Cardiol. 2013;170:S12–5.
15. Dyall SC. Long-chain omega-3 fatty acids and the brain: a review of the independent and shared effects of EPA, DPA and DHA. Front Aging Neurosci. 2015;7:52.
16. Bozzatello P, Brignolo E, De Grandi E, Bellino S. Supplementation with omega-3 fatty acids in psychiatric disorders: a review of literature data. J Clin Med. 2016;5:67. https://doi.org/10.3390/jcm5080067.