RESEARCH ARTICLE
Avoiding hERG-liability in drug design
via synergetic combinations of different (Q)SAR
methodologies and data sources: a case study
in an industrial setting
Thierry Hanser
1*, Fabian P. Steinmetz
2, Jeffrey Plante
1, Friedrich Rippmann
2and Mireille Krier
2Abstract
In this paper, we explore the impact of combining different in silico prediction approaches and data sources on the predictive performance of the resulting system. We use inhibition of the hERG ion channel target as the endpoint for this study as it constitutes a key safety concern in drug development and a potential cause of attrition. We will show that combining data sources can improve the relevance of the training set in regard of the target chemical space, leading to improved performance. Similarly we will demonstrate that combining multiple statistical models together, and with expert systems, can lead to positive synergistic effects when taking into account the confidence in the predictions of the merged systems. The best combinations analyzed display a good hERG predictivity. Finally, this work demonstrates the suitability of the SOHN methodology for building models in the context of receptor based endpoints like hERG inhibition when using the appropriate pharmacophoric descriptors.
Keywords: hERG, QSAR, Machine learning, Public–private data sharing, Expert system, SOHN, Combining models, Temporal study
© The Author(s) 2019. This article is distributed under the terms of the Creative Commons Attribution 4.0 International License (http://creat iveco mmons .org/licen ses/by/4.0/), which permits unrestricted use, distribution, and reproduction in any medium, provided you give appropriate credit to the original author(s) and the source, provide a link to the Creative Commons license, and indicate if changes were made. The Creative Commons Public Domain Dedication waiver (http://creat iveco mmons .org/ publi cdoma in/zero/1.0/) applies to the data made available in this article, unless otherwise stated.
Introduction
The inhibition of the human ether-a-go-go (hERG) ion channel may cause QT interval prolongation, which eventually can result in torsades de pointes (TdP) [1] and even death. Hence cardiotoxicity caused by the inhibition of hERG is a major liability within the drug development process. To avoid such a severe adverse effect, it makes good sense to screen all potential drug candidates for risk against blocking the hERG channel. It is therefore highly desirable to have a good means of predicting hERG activ-ity, and for this purpose in silico systems provide a low cost solution that can be applied to the large datasets in early drug discovery. As such, a large number of dif-ferent models have been developed. Herein, we present a new model, and a thorough comparison of its results using both public training data as well as mixing it with
privately held data to tune the results towards a specific area of chemical space. We also examine the combination of different models, including both a traditional QSAR random forest (RF) model and an expert rule-based sys-tem along with the newly introduced self-organising hypothesis networks (SOHN) model.
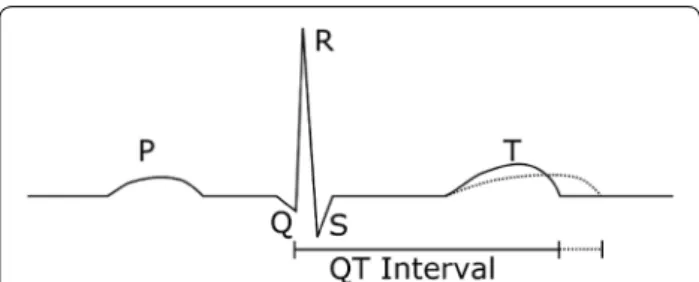
The hERG channel is a transmembrane ion channel to allow the passage of potassium ions through the cel-lular membrane and is related [2] to the ether a go-go (eag) gene discovered in fruit flies. It is named after the shaking behaviour observed in drosophila exposed to ether vapour [3] that was reminiscent of dancers at the Whisky a go-go bar in California. Inhibition of the hERG potassium channel has been shown to induce long-QT syndrome [4] by inhibiting the repolarisation of car-diac cells. By blocking the efflux of potassium ions, this lengthens the amount of time it takes to regenerate the cardiac action potential causing changes to the refractory period post-contraction (Fig. 1). This lengthening in time can cause TdP [1], a polymorphic ventricular tachycardia,
Open Access
*Correspondence: [email protected]
1 Lhasa Limited, Leeds, UK
which can ultimately cause syncope and rarely can cause cardiac failure and death. This is an unacceptable risk for most pharmaceuticals, and therefore a number have been withdrawn from use due to their ability to inhibit the hERG channel, such as cisapride [5] and terfenadine [6].
It is therefore advantageous, in pharmaceutical devel-opment, to screen for hERG liability early in develop-ment to avoid the expense of investigating compounds that will ultimately fail the more stringent risk assess-ments of ICH S7B or tests in accordance with FDA guid-ance E14. A number of different in vitro assays have been developed to screen for hERG inhibition, including a flu-orescence assay, radioligand binding, and electrophysiol-ogy measurements using a patch-clamp assay [7], which is the current gold standard. The inhibition of the hERG channel appears to follow a defined pharmacophore [8, 9] with a number of rules of thumb for medicinal chem-ists to follow. In addition, a number of QSAR studies have been investigated using various descriptors, from simple logP and TPSA analysis to more complicated 3D calculated quantum parameters. However, the perfor-mance of different models is difficult to compare without a benchmarking test set. There are also differences in the activity levels for dichotomising a compound to active or inactive, with threshold IC50 levels set anywhere from 1 to 40 μM. With such a large range some compounds can shift from active to inactive in different studies, as such we are only able to take the authors recommendations for their own performance. There are two main classes of prediction of hERG activity: those trying to predict a binarised system or those trying to predict the contin-uum of activity of the compounds towards blocking the hERG channel itself. The binarised systems condense each compound down to a single active or inactive call, usually using a threshold value to define activity. The con-tinuous systems instead use a regression method to try and predict the full activity over a range. To simplify the performance analysis a number of the continuous meth-ods end up dichotomising the results after prediction,
again using a threshold value. Across both methods a multitude of different modelling techniques have been applied. Wang et al. [10] have used recursive partition-ing on a moderate (587 compounds) sized dataset to find pharmacophores. They then used either naive Bayes clas-sifier or support vector machines to integrate multiple pharmacophores into a single call, using active as below the threshold value of 40 μM. Schyman et al. [11] used a similarity searching approach to classify hERG blockers, training with the same dataset as Wang, but with a dif-ferent threshold value of 10 μM. They used both 2D and 3D similarity approaches along with a conservative call approach where if either 2D or 3D were deemed active then the overall call was active. Their method gives an overall Cohen’s kappa of 0.56 for the combined model. Barakat et al. [12] took the classification model to the extreme by building a homologous model to the hERG channel with a long molecular dynamics simulation, fol-lowed by docking different compounds, each consisting of multiple low energy poses, into the channel and exam-ining the interaction energy for strength of binding. They were able to correctly identify 9 out of 10 hERG active drugs, but the time required for their method makes it impossible to use in a routine manner. The most thor-ough analysis of public data was done by Czodrowski [13], where he took the available IC50 and Ki values in ChEMBL [14] and used a random forest to examine the predictivity. He found a Matthews correlation coefficient (MCC) of 0.4 and the best simple accuracy reported was 90%, using two different threshold values of 1 and 10 μM. Li et al. [15] used Czodrowski’s dataset but applied mul-tiple different descriptors and machine learning tech-niques to find a consensus model with a MCC of 0.62. Su et al. [16] have used a combination of traditional QSAR descriptors, VolSurf-like descriptors and 4D fingerprints [17] to predict the pIC50 of hERG inactivation using par-tial least squares. They then binarised their prediction for analysis using a cutoff value of 40.7 μM and found a sim-ple accuracy measure of up to 90%. Gavaghan et al. [18] also used a system of different descriptors along with dif-ferent PLS models to generate a hERG model, which has shown a RMSE of 0.5 against temporally shifted data at AstraZeneca. Passini et al. [19] have developed a series of in silico Ion channel models that are able to predict TdP risk with greater accuracy than animal models. Munawar et al. [20] have developed a pharmacophore model by extracting important interaction sites from known hERG active drugs in three dimensional space that had a MCC performance of 0.72 with a small test set consisting also of known hERG active drugs. Chemi et al. [21] have also used a similar 3D pharmacophore approach, but with a regression model to predict the inhibition constant of the hERG channel with good accuracy.
The currently described work does not intend to out-perform any previously mentioned models as a primary objective. Instead we aim to explore the possible syner-gistic effects between existing in silico prediction systems as well as between different data sources and finally the combination of all these elements. To accomplish this study, we will involve 3 model types and 2 data sources; public and private.
For the public data source we used ChEMBL (version 23) [14], provided by the European Bioinformatics Insti-tute. It offers a searchable database of both compounds and targets with their associated bioactivities. These bioactivities are drawn from the literature across a wide variety of different assays. Our way of working with the information is to condense it down into a single binary call. This allows us to compare the results of different bioactivity types to each other by applying a simple set of threshold values, in an analogous manner to what was described in earlier papers [22, 23]. After this conden-sation we have a single binary call for each compound which gave us a dataset suitable for modelling. This dataset, although quite large at 7681 compounds, is still unable to completely cover interesting chemical space. Another database has been developed [24] containing 291,219 compounds, but this work was complete before the publication of that database. Pharmaceutical com-panies tend to exploit narrow areas of chemical space. Thus it is helpful to have training data direct from these companies. This allows us to learn their focused area of chemical space, as well as use the large area of chemical space covered by ChEMBL to cover compounds at the periphery of their space. This private data also tends to be of a higher quality [25], simply due to the fact that it is gathered according to a single set protocol, usually within a single lab, meaning that the results are more consist-ent. For the private data, we will use in-house data from Merck as part of a data sharing initiative.
In addition to combining public and private data, we aim to combine three different models, two statistical and one expert system, to try to obtain the best perfor-mance. The statistical methods are a random forest (RF) and a self-organising hypothesis network [26] (SOHN), and the expert system is Derek Nexus [27] (version 5.0.2) developed by Lhasa Limited. Derek Nexus consists of a number of structural alerts that have been designed by an expert toxicologist. These alerts consist of manually compiled 2D structural patterns that attempt to capture the known hERG pharmacophores in a systematic man-ner. These different systems all have their own individual strengths and therefore the sum of the systems should have better performance than any individual system.
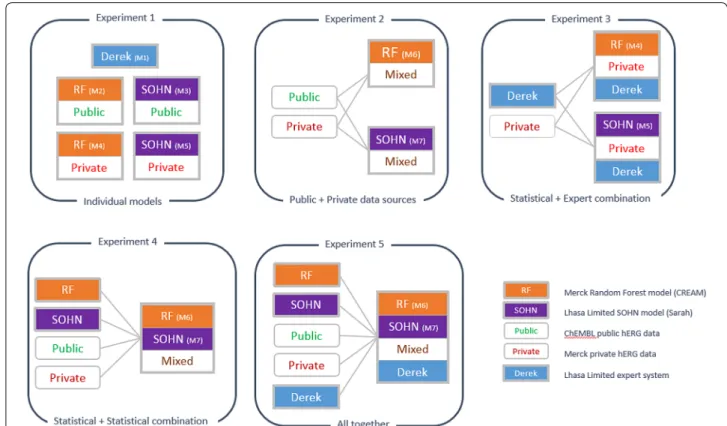
To explore the possible combinations of data sources and in silico models, we set up a series of 5 experiments
covering 11 different models. To augment the challenge and simulate a realistic prospective prediction context, the performance of each model will be evaluated against a time split training and test sets [28]. In fact, this test-ing method is made even more challengtest-ing for the mod-els as in silico assessment was used to direct the selection of compounds to synthesise, thereby prioritising com-pounds that existing models predicted as hERG inac-tive and leading to a negainac-tively biased test set. This also means that known positives are, to some extent absent, from the time-split test set as the synthesis of new compounds is guided away from any hERG actives; the remaining positive structures usually exhibit unexpected structural triggers for hERG activity and require well trained models.
Methods
Modelling methodologies Derek
Derek Nexus is an expert system which uses structural alerts to identify known toxicophores in a compound. In Derek Nexus (version 5.0.2), there are five alerts for the hERG endpoint. These alerts were built using publicly available data, as well as data that has been donated from Lhasa members. Each alert was developed by a Lhasa sci-entist looking at the structure activity relationship (SAR) of hERG inhibition across a multitude of structures, dis-tilling the data down into patterns that capture the activ-ity of the molecules.
Self‑organising hypothesis network
the query compound are identified and their correspond-ing kNN predictions are combined into a final call. For each prediction there is a confidence value associated, which is based on the similarity of the query compound to the kNN for each hypothesis, and the distribution of their hERG labels. The confidence value ranges from 0 to 1, where 1 is either an exact match to the training set, or a full agreement between the labels of the nearest neighbours.
Random forest
The random forest model (RF) was implemented in Scikit-learn 0.17 in python 2.7.11. Hyperparameter and feature selection were based on previous studies at Merck to optimise prior performance. The descriptors used were a set of physio-chemical properties, calculated by RDKit [31] (see Additional file 1) as well as Morgan fin-gerprints of radius 4 with a 4 k width and Feature Mor-gan fingerprints using again a radius of 4 and 4k width. For each prediction, there is also a confidence score (CS), which is the arithmetic mean of the maximum similarity to the training data and the prediction probability of the machine learning algorithm. The value scales from 0 to 1 but usually lies between 0.5 and 1 with 1 being 100% con-fident that the prediction is correct.
Data curation
The publicly available data was gathered from ChEMBL [14] by searching for compounds (7861) with bioactivi-ties against the hERG channel. These bioactivibioactivi-ties were binarised into an active/inactive call by either taking the authors call, or applying a threshold value to a numeric score. These threshold values are different depending on the bioactivity type (i.e. IC50, EC50, Ka etc.) but all are an attempt to establish a cutoff value equivalent to an IC50 of 10 μM. When a compound had multiple bioactivi-ties they were merged into a single call. A conservative method was used where a single active was sufficient to result in an active overall call. The resultant dataset is close to balanced being 46.7% active and 53.3% inactive.
The Merck private dataset was obtained experimen-tally using Patchliner™, which is an automated whole cell patch clamp assay using HEK293 cells expressing Kv11.1. The procedure is similar to the assay described by Polon-chuk [32], except that the experiment is performed at room temperature. The standard screen was performed using compounds dosed in 0.1% DMSO and tested as a single concentration (10 μM). Any compound eliciting over 50% inhibition at that concentration was classified as active and dose response curve is then measured in order (1)
CS=Max
similarity to training data
+model probability 2
to determine the IC50 value. If duplicate values were pre-sent the mean value of the inhibition was calculated and then binarised to active/inactive using the 50% threshold at 10 μM. To simulate a real case in industry, this dataset was split into a training set and a test set using a tempo-ral split. The training set of 7515 compounds consisted of all data from the 25th of March 2010 to the 13th of April 2017. The time-split test set of 316 compounds consisted of the results from the 20th of April 2017 to the 23rd of June 2017. Compounds are unique to each dataset, mak-ing it impossible to have a compound in both the trainmak-ing and test set.
Evaluation
A comprehensive set of statistical metrics were used to evaluate of the efficacy of the different models. These metrics, which are based on the typical confusion matrix (Additional file 1), were accuracy (ACC), sensitivity (SENS) (also known as recall or true positive rate), speci-ficity (SPEC) (also known as true negative rate), positive predictive value (PPV) (also known as precision) and negative predictive value (NPV) [33, 34]. As the test set was significantly unbalanced, we also calculated balanced accuracy (BA) [35], Matthews correlation coefficient (MCC) [36] and Cohen’s kappa coefficient (KAPPA) [37] due to their capability of dealing with unbalanced data. All equations adapted for binary classification models are detailed in the Additional file 1.
Results and discussion
All the statistical models and the Derek expert system were evaluated against the test set. This validation pro-cess is challenging from chemical space perspective and provides a good insight on the potential of deliver-ing accurate hERG predictions in the context of newly developed compounds. The validation is made even more difficult due to the strong negative bias of the dataset (approximatively 75% negatives vs 25% positives). Such bias is typical in the pharmaceutical industry as medici-nal chemists avoid introducing known toxicophores into their compounds. In this case, the validation dataset was synthesised with guidance from the in-house sta-tistical model, in an attempt to minimise hERG active compounds. This results in a dataset where a num-ber of the active compounds are therefore unexpected actives (black swans) for the previous models and expert knowledge.
Experiment 1: Individual model and individual data sources
The first experiment was designed to check that the tools we are investigating are fit for purpose. It also acted as a baseline to the other experiments. In the experiment, we hope to show that the three different models are appropri-ate for the prediction of hERG inhibition and also inves-tigate the difference in predictivity in using public versus private data to train the individual statistical models. It was also the first attempt at using the SOHN methodology to predict a receptor based endpoint rather than a reactivity based endpoint and as such it was good to compare it to the RF model.
Derek expert system
The Derek expert system relies on a manually compiled knowledge base of structural rules; it is not trained per se with public nor private data and was used as a base line. The rules were developed by a human expert using existing
knowledge, literature or looking for SAR trends in both public and donated data. The 316 test compounds were processed in Derek for the mutagenicity endpoint. The results in Table 1 show an accuracy of 75% and an MCC value of 0.27 which indicates a relatively low overall predic-tivity. The main detrimental factor was the low sensitivity (43%) due to the limited number of hERG alerts present in the current knowledge base and consequently the focused chemical space associated. Derek in isolation isn’t an exhaustive model as it mainly responds to the well-known hERG toxicophores; however we will see later how this focused knowledge of the expert system can still be of ben-efit when combined with the statistical models.
Although the relatively poor sensitivity of 43% was indic-ative of the reduced scope of the current knowledge base, Derek’s precision of 44% is considered as a good perfor-mance given the strong negative bias of the test dataset; we will see later that Derek is actually outperforming the
Fig. 2 Overview of the evaluation experiments. The evaluation was divided into 5 different experiments addressing different ways of combining the prediction models and the training data sources
Table 1 Derek Nexus performance against Merck test data
Expert model ACC BA SENS SPEC PPV NPV MCC KAPPA
statistical models trained with public data only in terms of positive predictivity.
RF and SOHN statistical models trained with public data The two statistical models trained only with public data were performing comparably to the Derek expert sys-tem (Table 2). The SOHN model displayed a slightly better performance with a relatively good sensitivity whilst keeping a precision (PPV) close to Derek’s. The relatively poor predictivity of the statistical systems can be mostly explained by the difference of chemical space between the private corporate test set (Merck space) and the public data (ChEMBL space). Furthermore, the data collected from ChEMBL came from different primary sources involving a wide range of different protocols. The diversity of assays and protocols in ChEMBL introduced a heterogeneous set of hERG assessments and therefore induced noise in the data due to a lack of normalisation across the different sources.
It is worth noting that, in regard to positive predictivity, the expert system Derek outperforms the two statistical models; the main reason was the precise structural scope of the hand crafted alerts. Precision is indeed one of the strengths of expert systems and we will see later how this characteristic can be leveraged when combining different approaches.
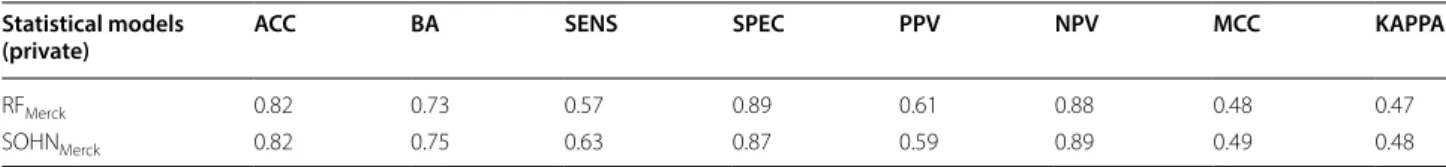
RF and SOHN statistical models trained with private data When trained with good quality and homogeneous data derived from a single Merck protocol, the statistical models (RF, SOHN) performed much better as shown in Table 3. Both models reached an acceptable predictiv-ity level with a balanced accuracy of 73% and 75% and an MCC value of 0.48 and 0.49 for the RF and SOHN methodologies respectively. Compared to the same mod-els trained with public data, this represents a significant
increase in predictivity of about 20%. As it is often the case, compared to public data, private data is usually more homogeneous and naturally closer to the intended application space which results in all performance met-rics being significantly enhanced. The results demon-strate the importance of domain proximity and therefore the pivotal role of proprietary data in private corpo-rate domains. This experiment highlights the potential to enhance publicly available models if the knowledge contained in private datasets could be extracted and transferred into such models. Unfortunately, it is very challenging to build public models based on private cor-porate datasets without leaking information about the highly confidential structures these dataset contain. Dif-ferent approaches have been considered to overcome this difficulty and it is still an active field [38].
We were able to use the performance of the individual models and individual dataset (summarized in Fig. 3) as a baseline to compare the combination of the models and data sources.
Experiment 2: Combining data sources
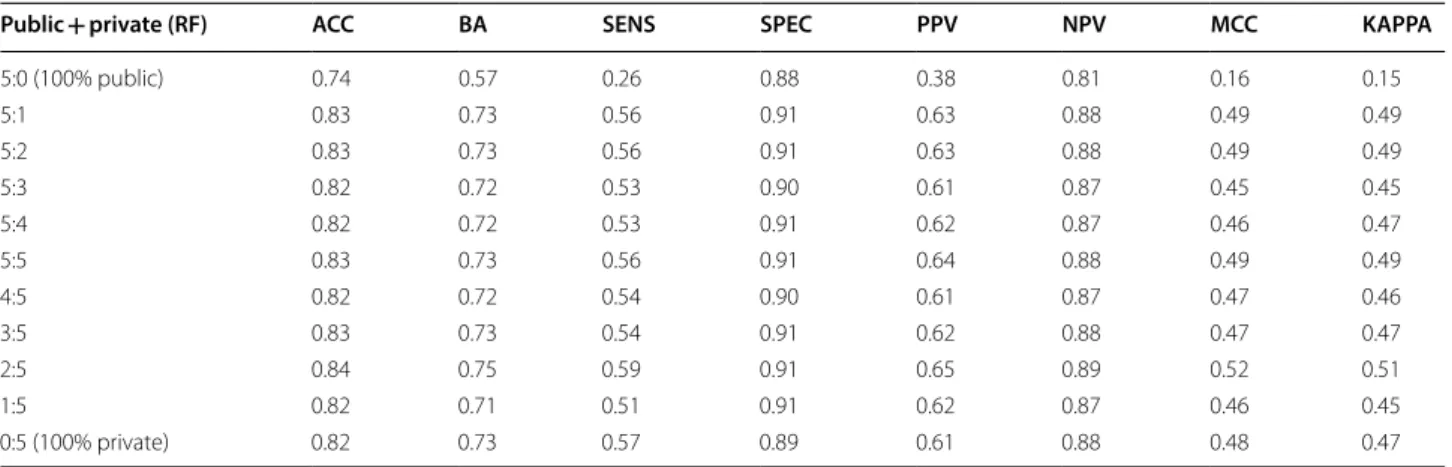
A key question we wanted to investigate was if the combination of public data and private data would result in a better model [39], or if the addition would confuse the models by introducing data from a different area of chemical space. When using the RF methodol-ogy and combining the public data with the proprietary Merck data with different weighting factors (sampling ratio), we can see that all weighting schema are per-forming much better than the public data only and that some schema (2:5, 5:5, 5:1, 5:2) are performing better than both the public data and the private data on their own (Table 4). For instance, the combination of data using the 2:5 ratio for public and private data respec-tively lead to a very interesting model with a balanced
Table 2 RF and SOHN trained with ChEMBL data against the Merck test data
Statistical models
(public) ACC BA SENS SPEC PPV NPV MCC KAPPA
RFChEMBL 0.74 0.57 0.26 0.88 0.37 0.81 0.16 0.15
SOHNChEMBL 0.73 0.66 0.54 0.78 0.42 0.86 0.30 0.29
Table 3 RF and SOHN trained with Merck data, performance against the Merck test data
Statistical models
(private) ACC BA SENS SPEC PPV NPV MCC KAPPA
RFMerck 0.82 0.73 0.57 0.89 0.61 0.88 0.48 0.47
accuracy value up to BA = 75% and an MCC value of 0.52. The same effect was seen with the SOHN meth-odology. By combining public and private data using different weights we observed better performance than with public data only. This was seen regardless of the ratio used (Table 5). We observed up to 78% for the bal-anced accuracy and an MCC value of 0.53 with a ratio of 5:1. Although many combinations of data sources demonstrated positive impact on performance, there was no clear pattern in the weighting-schema/perfor-mance relationship for both model types (Fig. 4). The access to both chemical spaces enables the RF and the SOHN algorithms to absorb the knowledge present in each domain, independently of the weighing factor. The exact nature of the impact was algorithm dependent and a thorough investigation would require a separate study. While the different public/private combinations performed much better than models trained on public
data only (regardless of the model or the public/private ratio), the gain relative to purely private models was less significant due to the already good performance of these models and the expected small domain overlap between the private test space and the public data.
Experiment 3: Combining statistical models with an expert model
In this experiment, we evaluated the potential benefit of complementing the statistical models with an expert sys-tem. For that purpose we used the ability of the statistical models to express their confidence in a prediction; when this confidence dropped below a defined threshold, we used the expert system as a fall-back predictor. The con-fidence metrics were specific to each statistical model. However both metrics ranged from 0 to 1 and correlate strongly with the observed accuracy of the predictions. Therefore, we will assume, for the sake of simplification, that confidence values can be compared.
0 0.1 0.2 0.3 0.4 0.5 0.6 0.7 0.8 0.9 1
ACC BA SENS SPEC PPV NPV MCC
Derek RF-ChEMBL RF-Merck SOHN-ChEMBL SOHN-Merck
Fig. 3 Individual models (Derek Nexus, RF and SOHN) using respectively public and private data. The positive impact in performance of using private data versus public data appears clearly in these results. The expert system Derek Nexus is used as a baseline
Table 4 Combining public and private data for the RF model
Public + private (RF) ACC BA SENS SPEC PPV NPV MCC KAPPA
5:0 (100% public) 0.74 0.57 0.26 0.88 0.38 0.81 0.16 0.15
5:1 0.83 0.73 0.56 0.91 0.63 0.88 0.49 0.49
5:2 0.83 0.73 0.56 0.91 0.63 0.88 0.49 0.49
5:3 0.82 0.72 0.53 0.90 0.61 0.87 0.45 0.45
5:4 0.82 0.72 0.53 0.91 0.62 0.87 0.46 0.47
5:5 0.83 0.73 0.56 0.91 0.64 0.88 0.49 0.49
4:5 0.82 0.72 0.54 0.90 0.61 0.87 0.47 0.46
3:5 0.83 0.73 0.54 0.91 0.62 0.88 0.47 0.47
2:5 0.84 0.75 0.59 0.91 0.65 0.89 0.52 0.51
1:5 0.82 0.71 0.51 0.91 0.62 0.87 0.46 0.45
We compared the performance of the combined sta-tistical-expert systems at different confidence thresholds (Tables 6 and 7, Fig. 5). For both models, the combination
with the expert system Derek produced the best perfor-mance (based on the MCC) for a confidence threshold value of 0.7. In other words, when the statistical model
Table 5 Combining public and private data for the SOHN model
Public + private (SOHN) ACC BA SENS SPEC PPV NPV MCC KAPPA
5:0 (100% public) 0.73 0.66 0.54 0.78 0.42 0.86 0.30 0.29
5.1 0.84 0.78 0.67 0.88 0.62 0.90 0.54 0.53
5:2 0.83 0.78 0.69 0.87 0.60 0.91 0.53 0.53
5:3 0.83 0.76 0.64 0.86 0.61 0.90 0.51 0.51
5:4 0.81 0.73 0.59 0.87 0.57 0.88 0.46 0.45
5:5 0.83 0.74 0.59 0.89 0.61 0.88 0.49 0.48
4:5 0.83 0.76 0.64 0.88 0.60 0.90 0.51 0.51
3:5 0.83 0.76 0.64 0.88 0.60 0.90 0.51 0.51
2:5 0.93 0.76 0.63 0.89 0.62 0.89 0.52 0.52
1:5 0.84 0.77 0.64 0.89 0.64 0.90 0.53 0.53
0:5 (100% private) 0.82 0.75 0.63 0.87 0.59 0.89 0.49 0.48
0 0.1 0.2 0.3 0.4 0.5 0.6
5:0 5:1 5:2 5:3 5:4 5:5 4:5 3:5 2:5 1:5 0:5
MC
C
ChEMBL : Merck Weighng
RF SOHN
Fig. 4 Combining public and private data with different weights
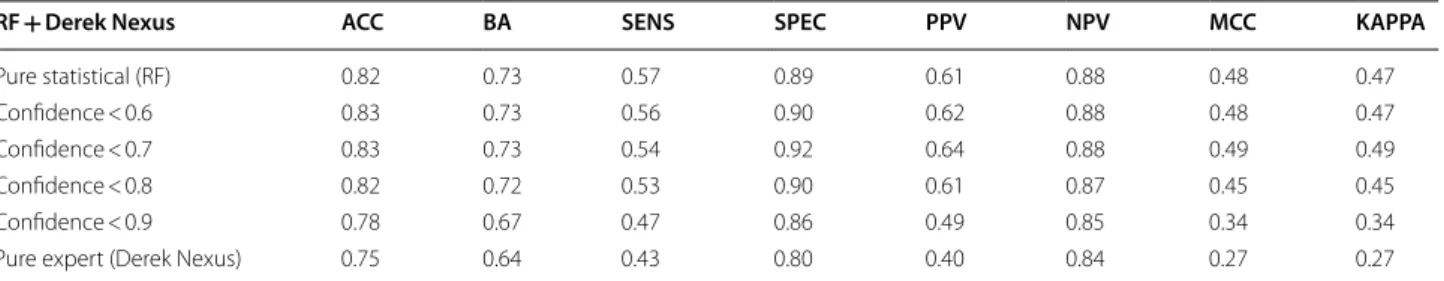
Table 6 Combining the statistical model RF with the expert system Derek Nexus
RF + Derek Nexus ACC BA SENS SPEC PPV NPV MCC KAPPA
Pure statistical (RF) 0.82 0.73 0.57 0.89 0.61 0.88 0.48 0.47
Confidence < 0.6 0.83 0.73 0.56 0.90 0.62 0.88 0.48 0.47
Confidence < 0.7 0.83 0.73 0.54 0.92 0.64 0.88 0.49 0.49
Confidence < 0.8 0.82 0.72 0.53 0.90 0.61 0.87 0.45 0.45
Confidence < 0.9 0.78 0.67 0.47 0.86 0.49 0.85 0.34 0.34
was less confident (confidence < 0.7) then falling back to the Derek prediction improves the performance. We observe that in both cases (RF and SOHN), the resulting combined model is more sensitive and more precise than the pure expert system. This is the effect of the expert model reducing the number of false positives that occur when the confidence level was low in the statistical mod-els. As mentioned earlier, expert systems like Derek have well defined structural scopes based on existing knowl-edge; this allows the expert system to exhibit a stronger precision (positive predictivity). The gain in precision observed when using the expert system also means that statistical models, when less confident, tend to make false positive predictions. This is especially apparent when the test space is biased towards negative instances.
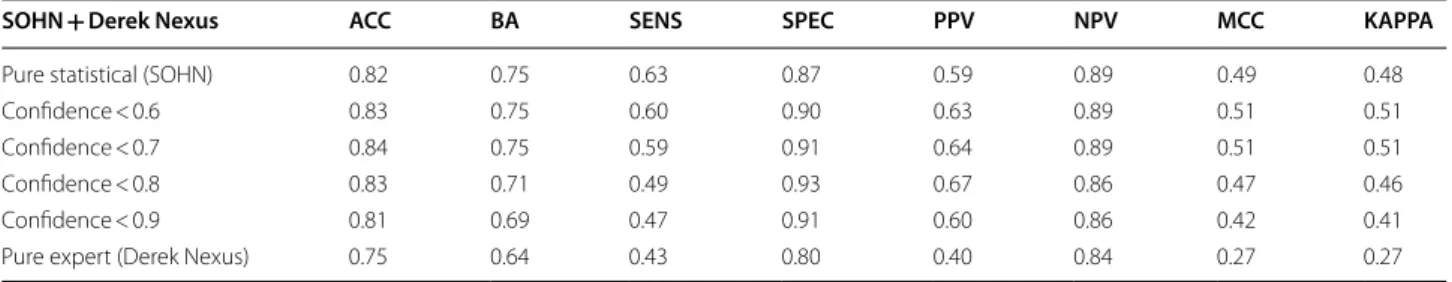
In the case of the RF/Derek combination, the MCC value increased from 0.48/0.27 respectively to 0.49 mainly due to an increased precision from 61%/40% to 64% respectively; for the SOHN/Derek combination the MCC is enhanced from 0.49/0.27 to 0.51 when the pre-cision increased from 59%/40% to 64% respectively. We can see that both statistical models benefited from the support of the expert model when they lack confidence.
Moreover, the expert system benefited greatly from teaming up with statistical models. These results nicely support the ICH-M7 [40] recommendations of using both expert and statistical systems for predicting muta-genicity. Maintaining and expanding an expert system requires significant effort and domain expertise, mak-ing these tasks time consummak-ing. However the resultmak-ing models are usually precise. On the other hand, statis-tical models are easy and fast to build, provided they have access to quality data. Those models are neverthe-less not always very precise due to the statistical nature of their algorithm and in regions of low confidence, their predictivity can be questionable. Therefore, both approaches can complement each other into a better meta-model where expert systems act as a “safety net” for statistical models. It is worth noting that not all the combinations in our example lead to positive syner-gistic effect (i.e. as when the threshold > 0.7). This is a useful reminder that combining an expert model with a statistical model is not guaranteed to produce a bet-ter result and in the context of ICH-M7 [40], it raises a clear need for additional expert input.
Table 7 Combining the statistical model SOHN with the expert system Derek Nexus
SOHN + Derek Nexus ACC BA SENS SPEC PPV NPV MCC KAPPA
Pure statistical (SOHN) 0.82 0.75 0.63 0.87 0.59 0.89 0.49 0.48
Confidence < 0.6 0.83 0.75 0.60 0.90 0.63 0.89 0.51 0.51
Confidence < 0.7 0.84 0.75 0.59 0.91 0.64 0.89 0.51 0.51
Confidence < 0.8 0.83 0.71 0.49 0.93 0.67 0.86 0.47 0.46
Confidence < 0.9 0.81 0.69 0.47 0.91 0.60 0.86 0.42 0.41
Pure expert (Derek Nexus) 0.75 0.64 0.43 0.80 0.40 0.84 0.27 0.27
0 0.1 0.2 0.3 0.4 0.5 0.6
Pure
Statistical Confidence< 0.6 Confidence< 0.7 Confidence< 0.8 Confidence< 0.9 Pure Expert
MC
C
RF + Derek SOHN + Derek
In this experiment, we saw how the statistical models benefited from the knowledge offered by the expert sys-tem when they are not confident. However when the sta-tistical models are confident it is preferable not to use the expert system. By choosing the right confidence thresh-old, it is possible to build a combination between statis-tical model and expert model that leverages accuracy of the statistical model when they are confident and the pre-cision of the expert system otherwise.
Experiment 4: Combining statistical models
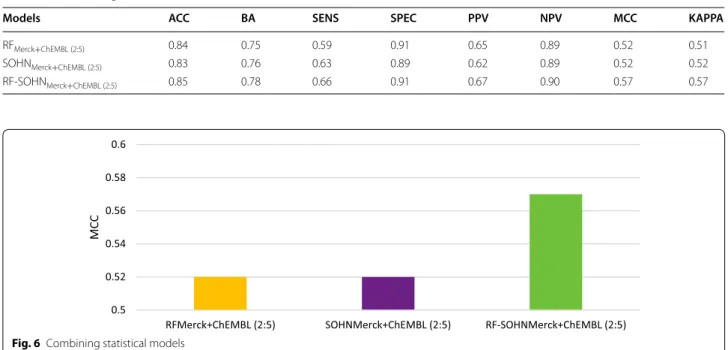
The purpose of this experiment was to analyse the impact of combining the predictions of the statistical models together. For that purpose, we used the models (RF and SOHN) trained on combined public and private data, using the same weighting ratio (2:5) to ensure an opti-mum performance. Thus we should see if their combi-nation is able to further improve the performance. The models were combined by keeping the prediction of the most confident model, i.e. the final call is the call of the model reporting the highest confidence score. The results from Table 8 and Fig. 6 show that the combined model improved both individual models reaching an MCC of 0.57 with a balanced accuracy of 85% and a sensitivity of 66% whilst offering a good precision (67%). This very good overall performance showed the complementarity of the models toward each other thanks to their ability to assign a confidence in their prediction. Estimating the confidence in individual predictions is a challenging task [41], yet it is vital information when combining models.
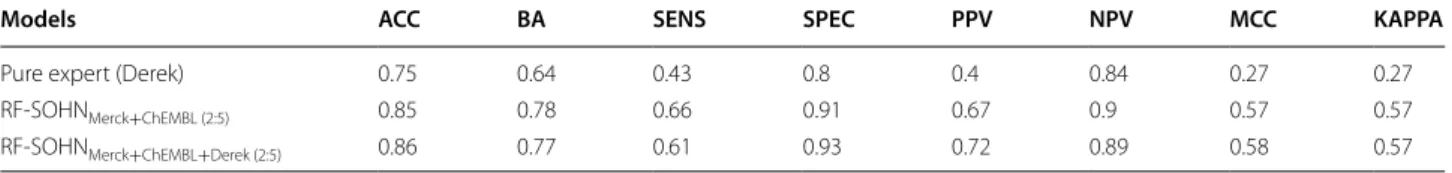
Experiment 5: Combining all the models and data sources For the final experiment, we combined all three models to see if we could further extend the synergistic effect. For this purpose, we used the most confident model call as the final call. Both statistical models (RF, SOHN) were trained with a combination of private/public data; we used the best common ratio identified in experiment 2, i.e. 2:5 for public and private data respectively. Given that the Derek Nexus expert system did not provide a normal-ised confidence metric comparable to the statistical mod-els (Derek uses discrete likelihood range), we used the best confidence threshold when combining Derek with the RF and SOHN models (experiment 3). This threshold of 70% was a logical choice since we have seen that if the statistical models are more confident than 70% we should use their call rather than the Derek call. Table 9 and Fig. 7 show that the overall combination of all three models and both public and private data lead to the best performance. In accordance with experiment 3, the additional use of an expert system on top of statistical models improved the precision or positive predictivity (PPV: + 5%) at the expense of sensitivity (SENS: − 5%) resulting, in this final experiment, with a slight improvement in the Matthew correlation coefficient (MCC: + 0.01) which was our ref-erence metric.
Conclusion
In this work, we have explored different combinations of statistical and expert models with private and public data sources. Individually, each model performed significantly
Table 8 Combining statistical models
Models ACC BA SENS SPEC PPV NPV MCC KAPPA
RFMerck+ChEMBL (2:5) 0.84 0.75 0.59 0.91 0.65 0.89 0.52 0.51
SOHNMerck+ChEMBL (2:5) 0.83 0.76 0.63 0.89 0.62 0.89 0.52 0.52
RF-SOHNMerck+ChEMBL (2:5) 0.85 0.78 0.66 0.91 0.67 0.90 0.57 0.57
0.5 0.52 0.54 0.56 0.58 0.6
RFMerck+ChEMBL (2:5) SOHNMerck+ChEMBL (2:5) RF-SOHNMerck+ChEMBL (2:5)
MC
C
better when trained with private data as opposed to trained with public data. This can be explained by the lack of homogeneity from the public source being com-piled from many different assays and quality standards. Another important benefit of private data was the prox-imity of the chemical space between the private data and the target domain. When the models were trained using both public and private data [39], they usually showed an additional improvement compared to either data. We would therefore recommend combining public and pri-vate data whenever possible.
Combining statistical models with the expert model Derek, lead to a good consensus model, if the expert model was used when the statistical model was not confi-dent. The resulting combination outperformed either sys-tem on its own. The positive synergistic effect observed was mainly due to a reduction of the false positive pre-dictions, since the expert system tended to be more consistently precise. This result reinforces the ICH-M7 recommendation to use statistical and expert prediction systems in conjunction. When combining statistical sys-tems, using the prediction of the most confident model, we observed another positive synergistic effect. This can
be explained by the ability of the two predictors to mutu-ally compensate each other in case of low confidence. When one model is not confident, the other model might be more assertive and vice versa. Both models therefore complemented each other, increasing the overall domain of high confidence and the associated performance.
Finally, we showed in the last experiment that com-bining all the above models and data sources further increased the performance. The different positive effects from the different nature of the models and the data source were additive. This study allowed us to evaluate the SOHN methodology in the context of a classification task for the hERG endpoint; we demonstrated that the performance of this approach is comparable to the well-established RF algorithm when challenged with a pro-spective exercise. The SOHN methodology is successfully used to predict mutagenic compounds in the form of the Sarah Nexus software. The good predictivity observed in this study indicates the SOHN to be a promising candi-date for binding driven endpoints.
The best model built in this study, by combining the RF and SOHN models both trained with public and pri-vate data and backed-up with the Derek expert system, Table 9 Combining all the models
Models ACC BA SENS SPEC PPV NPV MCC KAPPA
Pure expert (Derek) 0.75 0.64 0.43 0.8 0.4 0.84 0.27 0.27
RF-SOHNMerck+ChEMBL (2:5) 0.85 0.78 0.66 0.91 0.67 0.9 0.57 0.57 RF-SOHNMerck+ChEMBL+Derek (2:5) 0.86 0.77 0.61 0.93 0.72 0.89 0.58 0.57
0 0.1 0.2 0.3 0.4 0.5 0.6 0.7 0.8 0.9 1
SENS PPV ACC MCC
Pure Expert (Derek) RF-SOHN (Merck + ChEMBL 2:5) Derek + RF-SOHN (Merck + ChEMBL 2:5)
reached a very good accuracy (86%) with a high MCC value (0.58). This performance clearly demonstrates the potential for in silico predictions to improve safety assessment of drugs and reduce the risk of late stage failure in the drug development process. As we saw, one important contribution to this performance is the inclusion of corporate data in the training set. Hence, sharing this valuable “statistical knowledge” across pharmaceutical companies could further improve the models. The main obstacle of such an initiative is the confidentiality of the data, however the huge benefit associated is a strong driver to find new ways to trans-fer private data into non-confidential models that can be shared across contributors. This is an active field and will be addressed in future collaborative work between Merck KGaA and Lhasa Limited.
Additional file
.Additional file 1. RDKit descriptors used for the Random Forest model.
Abbreviations
ACC : accuracy; BA: balanced accuracy; hERG: human ether a go go; KAPPA: Cohens kappa coefficient; kNN: k nearest neighbours; MCC: Matthews correla-tion coefficient; NPV: negative predictive value; PPV: positive predictive value; RF: random forest; SENS: sensitivity; SPEC: specificity; SOHN: self organised hypothesis network; TdP: torsade de pointes.
Authors’ contributions
FS and MK developed the RF model and gathered the private data for the challenge. TH and JP gathered the ChEMBL data and implemented the SOHN model. FR supervised FS and MK enabling the data sharing between Lhasa and Merck. All authors read and approved the final manuscript.
Author details
1 Lhasa Limited, Leeds, UK. 2 Merck KGaA, Darmstadt, Germany.
Acknowledgements
We thank Nina Glaser for providing us with the experimental conditions of the automated whole cell patch clamp assay. The European Bioinformatics Institute (EMBL-EBI) is thanked for maintaining ChEMBL.
Availability of data and materials
Unfortunately the data is unavailable to be shared as it is proprietary informa-tion currently under investigainforma-tion as drug candidates at Merck.
Competing interests
The authors declare that they have no competing interests.
Funding
All authors are employed by their associated institutions with no other fund-ing sources to report.
Publisher’s Note
Springer Nature remains neutral with regard to jurisdictional claims in pub-lished maps and institutional affiliations.
Received: 26 September 2018 Accepted: 25 January 2019
References
1. Roden DM (1993) Torsade de pointes. Clin Cardiol 16(9):683–686. https :// doi.org/10.1002/clc.49601 60910
2. Warmke JW, Ganetzky B (1994) A family of potassium channel genes related to eag in Drosophila and mammals. Proc Natl Acad Sci 91(8):3438–3442. https ://doi.org/10.1073/pnas.91.8.3438
3. Kaplan WD, Trout WE (1969) The behavior of four neurological mutants of Drosophila. Genetics 61(2):399–409
4. Sanguinetti MC, Tristani-Firouzi M (2006) HERG potassium channels and cardiac arrhythmia. Nature 440:463–469
5. Rampe D, Roy M-L, Dennis A, Brown AM (1997) A mechanism for the proarrhythmic effects of cisapride (Propulsid): high affinity blockade of the human cardiac potassium channel HERG. FEBS Lett 417:28–32. https ://doi.org/10.1016/S0014 -5793(97)01249 -0
6. Roy M-L, Dumaine R, Brown AM (1996) HERG, a primary human ven-tricular target of the nonsedating antihistamine terfenadine. Circulation 94(4):817. https ://doi.org/10.1161/01.CIR.94.4.817
7. Priest B, Bell IM, Garcia M (2008) Role of HERG potassium channel assays in drug development. Channels 2(2):87–93. https ://doi.org/10.4161/ chan.2.2.6004
8. Cavalli A, Poluzzi E, De Ponti F, Recanatini M (2002) Toward a pharmaco-phore for drugs inducing the long QT syndrome: insights from a CoMFA study of HERG K+ channel blockers. J Med Chem 45(18):3844–3853. https ://doi.org/10.1021/jm020 8875
9. Aronov AM (2005) Predictive in silico modeling for HERG channel block-ers. Drug Discov Today 10(2):149–155. https ://doi.org/10.1016/S1359 -6446(04)03278 -7
10. Wang S, Sun H, Liu H, Li D, Li Y, Hou T (2016) ADMET evaluation in drug discovery. 16. Predicting HERG blockers by combining multiple phar-macophores and machine learning approaches. Mol Pharm. https ://doi. org/10.1021/acs.molph armac eut.6b004 71
11. Schyman P, Liu R, Wallqvist A (2016) General purpose 2D and 3D similarity approach to identify HERG blockers. J Chem Inf Model 56(1):213–222. https ://doi.org/10.1021/acs.jcim.5b006 16
12. Anwar-Mohamed A, Barakat K, Bhat R, Noskov S, Lorne Tyrrell D, Tuszynski J, Houghton M (2014) A human ether-á-go-go-related (HERG) ion channel atomistic model generated by long supercomputer molecular dynamics simulations and its use in predicting drug cardiotoxicity. Toxicol Lett 230:382–392. https ://doi.org/10.1016/j.toxle t.2014.08.007
13. Czodrowski P (2013) HERG me out. J Chem Inf Model 53(9):2240–2251. https ://doi.org/10.1021/ci400 308z
14. Gaulton A, Bellis LJ, Bento AP, Chambers J, Davies M, Hersey A, Light Y, McGlinchey S, Michalovich D, Al-Lazikani B et al (2012) ChEMBL: a large-scale bioactivity database for drug discovery. Nucleic Acids Res 40(D1):D1100–D1107. https ://doi.org/10.1093/nar/gkr77 7
15. Li X, Zhang Y, Li H, Zhao Y (2017) Modeling of the HERG K+ channel blockage using online chemical database and modeling environment (OCHEM). Mol Inform. https ://doi.org/10.1002/minf.20170 0074 16. Su B-H, Shen M, Esposito EX, Hopfinger AJ, Tseng YJ (2010) In silico binary
classification QSAR models based on 4D-fingerprints and MOE descrip-tors for prediction of HERG blockage. J Chem Inf Model 50(7):1304–1318. https ://doi.org/10.1021/ci100 081j
17. Senese CL, Duca J, Pan D, Hopfinger AJ, Tseng YJ (2004) 4D-fingerprints, universal QSAR and QSPR descriptors. J Chem Inf Comput Sci 44(5):1526– 1539. https ://doi.org/10.1021/ci049 898s
18. Gavaghan CL, Arnby CH, Blomberg N, Strandlund G, Boyer S (2007) Development, interpretation and temporal evaluation of a global QSAR of HERG electrophysiology screening data. J Comput Aided Mol Des 21(4):189–206. https ://doi.org/10.1007/s1082 2-006-9095-6 19. Passini E, Britton OJ, Lu HR, Rohrbacher J, Hermans AN, Gallacher DJ,
Greig RJH, Bueno-Orovio A, Rodriguez B (2017) Human in silico drug trials demonstrate higher accuracy than animal models in predicting clinical pro-arrhythmic cardiotoxicity. Front Physiol. https ://doi.org/10.3389/fphys .2017.00668
20. Munawar S, Windley MJ, Tse EG, Todd MH, Hill AP, Vandenberg JI, Jabeen I (2018) Experimentally validated pharmacoinformatics approach to pre-dict hERG inhibition potential of new chemical entities. Front Pharmacol. https ://doi.org/10.3389/fphar .2018.01035
•fast, convenient online submission •
thorough peer review by experienced researchers in your field • rapid publication on acceptance
• support for research data, including large and complex data types •
gold Open Access which fosters wider collaboration and increased citations maximum visibility for your research: over 100M website views per year •
At BMC, research is always in progress.
Learn more biomedcentral.com/submissions
Ready to submit your research? Choose BMC and benefit from:
22. Bashir Surfraz M, Fowkes A, Plante JP (2017) A semi-automated approach to create purposeful mechanistic datasets from heterogeneous data: data mining towards the in silico predictions for oestrogen receptor modula-tion and teratogenicity. Mol Inform. https ://doi.org/10.1002/minf.20160 0154
23. Steinmetz FP, Mellor CL, Meinl T, Cronin MTD (2015) Screening chemicals for receptor-mediated toxicological and pharmacological endpoints: using public data to build screening tools within a KNIME workflow. Mol Inform 34(2–3):171–178. https ://doi.org/10.1002/minf.20140 0188 24. Sato T, Yuki H, Ogura K, Honma T (2018) Construction of an integrated
database for HERG blocking small molecules. PLoS ONE 13(7):e0199348. https ://doi.org/10.1371/journ al.pone.01993 48
25. Klimisch H-J, Andreae M, Tillmann U (1997) A systematic approach for evaluating the quality of experimental toxicological and ecotoxicologi-cal data. Regul Toxicol Pharmacol 25(1):1–5. https ://doi.org/10.1006/ rtph.1996.1076
26. Hanser T, Barber C, Rosser E, Vessey JD, Webb SJ, Werner S (2014) Self organising hypothesis networks: a new approach for representing and structuring SAR knowledge. J Cheminform 6(1):21. https ://doi. org/10.1186/1758-2946-6-21
27. Derek Nexus, Lhasa Limited. https ://www.lhasa limit ed.org/produ cts/ derek -nexus .htm
28. Sheridan RP (2013) Time-split cross-validation as a method for estimating the goodness of prospective prediction. J Chem Inf Model 53(4):783–790. https ://doi.org/10.1021/ci400 084k
29. Plante J, Werner S (2018) JPlogP: an improved LogP predictor trained using predicted data. J Cheminform. https ://doi.org/10.1186/s1332 1-018-0316-5
30. Ghose AK, Crippen GM (1986) Atomic physicochemical parameters for three-dimensional structure—directed quantitative structure-activity relationships I. Partition coefficients as a measure of hydrophobicity. J Comput Chem 7(4):565–577. https ://doi.org/10.1002/jcc.54007 0419
31. Landrum G (2006) RDKit: Open-Source Cheminformatics 32. Polonchuk L (2012) Toward a new gold standard for early safety:
automated temperature-controlled HERG test on the PatchLiner. Front Pharmacol 3:3. https ://doi.org/10.3389/fphar .2012.00003
33. Fawcett T (2006) An introduction to ROC analysis. Pattern Recognit Lett 27(8):861–874. https ://doi.org/10.1016/j.patre c.2005.10.010
34. Altman DG, Bland JM (1994) Statistics notes: diagnostic tests 2: predictive values. BMJ 309(6947):102. https ://doi.org/10.1136/bmj.309.6947.102 35. Brodersen KH, Ong CS, Stephan KE, Buhmann JM (2010) The balanced
accuracy and its posterior distribution. IEEE, pp 3121–3124. https ://doi. org/10.1109/ICPR.2010.764
36. Matthews BW (1975) Comparison of the predicted and observed second-ary structure of T4 phage lysozyme. Biochim Biophys Acta BBA Protein Struct 405(2):442–451. https ://doi.org/10.1016/0005-2795(75)90109 -9 37. Cohen J (1960) A coefficient of agreement for nominal scales. Educ
Psychol Meas 20(1):37–46. https ://doi.org/10.1177/00131 64460 02000 104 38. Briggs K, Barber C, Cases M, Marc P, Steger-Hartmann T (2015) Value
of shared preclinical safety studies—the ETOX database. Toxicol Rep 2:210–221. https ://doi.org/10.1016/j.toxre p.2014.12.004
39. Merget B, Turk S, Eid S, Rippmann F, Fulle S (2017) Profiling prediction of kinase inhibitors: toward the virtual assay. J Med Chem 60(1):474–485. https ://doi.org/10.1021/acs.jmedc hem.6b016 11
40. Food and Drug Administration (FDA) (2018) M7(R1) assessment and con-trol of DNA reactive (mutagenic) impurities in pharmaceuticals to limit potential carcinogenic risk guidance for industry, p 131. https ://www. fda.gov/downl oads/Drugs /Guida nceCo mplia nceRe gulat oryIn forma tion/ Guida nces/UCM34 7725.pdf