ORIGINAL INVESTIGATION
Gender differences in the progression
of target organ damage in patients
with increased insulin resistance: the
LOD‑DIABETES study
Manuel Ángel Gómez‑Marcos
1,2,3*, José Ignacio Recio‑Rodríguez
1, Leticia Gómez‑Sánchez
1,
Cristina Agudo‑Conde
1,2, Emiliano Rodríguez‑Sanchez
1,2,3, JoseAngel Maderuelo‑Fernandez
1,2,
Marta Gomez‑Sanchez
1, Luís García‑Ortiz
1,2,3and LOD‑DIABETES Group
4Abstract
Background: The purpose of this study was to analyze the evolution of vascular, cardiac and renal target organ dam‑ age (TOD) in patients with increased insulin resistance over a 3.5 year follow‑up and to investigate gender difference and factors that influence its progression.
Methods: We performed a prospective observational study involving 112 patients (71 men, 41 women) who were followed for 3.5 years. Measurements included blood pressure, blood glucose, lipids, smoking, body mass index (BMI) and HOMA‑Ir Vascular TOD included carotid intima‑media thickness (IMT), pulse wave velocity (PWV) and ankle/bra‑ chial index (ABI). Cardiac TOD included Cornell voltage‑duration product and Sokolow. Renal TOD included creatinine, glomerular filtration and albumin/creatinine ratio.
Results: The IMT increased in both genders. Each year, the IMT increased 0.005 mm in men and 0.011 in women and the PWV 0.024 and 0.020 m/sec, respectively. The highest increase was in women with type 2 diabetes mellitus, who had an increase in TOD carotid (40 %), PWV (24 %) and renal TOD (20 %). Multiple regression analysis, after adjusting for age and gender, showed a negative association between duration since diabetes diagnosis and ABI (β=−0.006;
p = 0.017) and between BMI and glomerular filtration (β=−0.813; p = 0.014). HbA1c was positively associated with
PWV (β= 0.501; p = 0.014).
Conclusions: This study showed that the progression of vascular and renal TOD differs by gender. The increase in vascular and renal TOD was higher in women, especially in diabetic women. The PWV increase showed a positive association with mean HbA1c levels during the follow‑up. Glomerular filtration was associated with BMI and the ABI was associated with duration since type 2 diabetes mellitus diagnosis.
Trial registration: Clinical Trials.gov Identifier NCT01065155
Keywords: Insulin resistance, Target organ damage, Gender difference, Drug treatment
© 2015 Gómez‑Marcos et al. This article is distributed under the terms of the Creative Commons Attribution 4.0 International License (http://creativecommons.org/licenses/by/4.0/), which permits unrestricted use, distribution, and reproduction in any medium, provided you give appropriate credit to the original author(s) and the source, provide a link to the Creative Commons license, and indicate if changes were made. The Creative Commons Public Domain Dedication waiver (http://creativecommons. org/publicdomain/zero/1.0/) applies to the data made available in this article, unless otherwise stated.
Background
Cardiovascular disease (CVD) morbidity and mortality is greater in people with increased insulin resistance [(type
2 diabetes mellitus (T2DM) or metabolic syndrome (MetS)] [1–3]. The presence of vascular [4–6], cardiac [7] and renal [8, 9] target organ damage (TOD) increases the risk of cardiovascular complications independent of the existing estimated risk [10]. In the general popu-lation the overall median age for evident CVD is about 9 years lower in men than in their women counterparts
Open Access
*Correspondence: magomez@usal.es
3 Medicine Department, University of Salamanca, Salamanca, Spain
worldwide [11], except in diabetic women who have a higher risk of CVD than diabetic men [12].
In the general population, left ventricular hypertrophy (LVH) is more prevalent in men [13] and peripheral arte-rial disease is more prevalent in women [14]. However, carotid intima-media thickness (IMT) and pulse wave velocity (PWV) are higher in men, although this differ-ence is attenuated with age [15]. Measurement of IMT increases the capacity to identify individuals with dia-betes [16] or MetS [17] who are at a high risk of devel-oping cardiovascular disease. Measurement of PWV increases the capacity to identify individuals with dia-betes [16] or glucose intolerance [18], healthy individu-als [19] and subjects with moderate or intermediate risk [20] who are at a high risk of developing cardiovascular disease. Patient age and gender are the most important determinants of IMT [21]. In the general population, the mean estimates of IMT progression ranged from 0.001 to 0.030 mm per year for the common carotid artery IMT, the mean estimates of IMT progression ranged from 0.001 to 0.030 mm per year for common carotid artery IMT, decreasing with control of the risk factors in dia-betic individuals [22]. Postprandial blood glucose and HbA1c have a greater influence upon IMT than basal blood glucose [23], but there was no association to car-diovascular events [24]. The predictors of PWV include abdominal obesity, hyperglycemia and dyslipidemia [15]. It has also been reported that adequate glucose and blood pressure control decreases the PWV progression in dia-betic patients [25].
In diabetic men, albuminuria occurs more frequently and with a greater reduction in glomerular filtration rate than in diabetic women [26, 27], but LVH is more preva-lent in diabetic women than in diabetic men [25].
However, differences in the evolution of the TOD between T2DM and MetS have been little studied [28], and the role that the gender plays in vascular, cardiac and renal TOD in patients with increased insulin resistance, remains unclear and there have been few longitudinal studies.
Therefore, we analyzed the evolution of vascular, car-diac and renal TOD in patients with increased insulin resistance over a 3.5-year follow-up and investigated gender differences and factors that influence TOD progression.
Methods Study design
A prospective observational study was performed in a primary care setting, with a median of fol-low up of 3.5 years (range, 2.9–3.9 years). This study included 112 subjects from the LOD-DIABETES study (NCT01065155) [29].
Study population
Using consecutive sampling, we included 112 patients with increased insulin resistance considering clinical criteria, i.e. with diagnosis of T2DM (n = 68) or MetS (n = 44). Type 2 diabetes mellitus (T2DM) defined using the American Diabetes Association criteria [30] or MetS defined according to the National Cholesterol Education Program, ATP III [31]. The study included patients with diabetes or metabolic syndrome, who visited their family physician between January 2009 and January 2010, and these patients included 71 men (63.4 %) and 41 women (36.6 %). Exclusion criteria were as follows: patients who were unable to comply with the protocol require-ments (psychological and/or cognitive disorders; failure to cooperate; educational limitations and problems in understanding written language; and failure to sign the informed consent document). Patients participating in a clinical trial during the study were also excluded, as were patients with serious life-threatening comorbidities in the previous 12 months.
The sample size was estimated to detect a statistically significant difference in the carotid IMT that was greater than or equal to 0.03 mm between baseline and the fourth assessment. Accepting an alpha risk of 0.05 and a beta risk of 0.2 in a two-sided test, 112 subjects were necessary to achieve a statistically significant difference. The standard deviation was estimated to be 0.11 mm, and the drop-out rate was estimated as 5 %. An inde-pendent ethics committee of Salamanca Health Area (Spain) approved the study. All participants gave written informed consent, according to the general recommen-dations of the Declaration of Helsinki [32].
Measurements
A detailed description has been published elsewhere of how clinical data were collected, including anthropomet-ric measurements, blood pressure and TOD assessment [29].
Blood pressure
Three measurements of systolic (SBP) and diastolic blood pressure (DBP) were collected using a validated OMRON model M7 sphygmomanometer (Omron Health Care, Kyoto, Japan). We used the average of the last two meas-urements according to the recommendations of the Euro-pean Society of Hypertension [33]. Mean blood pressure (MBP) was calculated as the sum of SBP + 2 × DBP, divided by 3.
Vascular assessment
Carotid femoral pulse wave velocity
Australia), with patients in the supine position. The pulse wave of the carotid and femoral arteries were analyzed to estimate the ECG wave delay and calculate the PWV. Distance measurements from the sternal notch to the carotid and femoral arteries at the sensor location were collected using a measuring tape and multiplied by 0.8, as recommended by expert consensus [34]. TOD was indi-cated if the PWV was greater than 10 m/sec [33].
Carotid intima media thickness
Carotid ultrasound to assess carotid IMT was performed by two investigators trained for this purpose before start-ing the study. A Sonosite Micromax ultrasound (Son-osite Inc., Bothell, Washington, USA) device paired with a 5–10 MHz multi-frequency high-resolution linear transducer with Sonocal software was used for auto-matic measurement of IMT to optimize reproducibil-ity. Common carotid artery measurements were made after examining a 10-mm longitudinal section 1 cm from the bifurcation. Measurements were performed at the proximal and distal wall in the lateral, anterior and pos-terior projections. They followed an axis perpendicular to the artery to discriminate between two lines: one for the intima-blood interface and the other for the media-adventitious interface. A total of 6 measurements were obtained for the right carotid and 6 measurements for the left carotid. We used the average values (average IMT) that were automatically calculated using the software [35]. The measurements were obtained with the subject lying down, with their head extended and slightly turned opposite of the carotid artery under study. Average IMT values were considered abnormal if they were >0.90 mm, if there were atherosclerotic plaques with a diameter of 1.5 mm or if there was a focal increase of 0.5 mm or 50 % of the adjacent IMT [33].
Evaluation of peripheral artery involvement
Peripheral artery involvement was assessed using the ankle-brachial index (ABI) and was calculated in the morning for patients who had not drank coffee or smoked tobacco for at least 8 h prior to the measurement. The room temperature was 22–24 °C. Patients were supine with the feet uncovered. The pressure in the lower limbs was measured after resting for 20 min using a portable Watch BP Office for assessing the ABI (Microlife AG Swiss Corporation Espenstrasse 139; CH-9443 Widnau/ Switzerland). The ABI was calculated automatically for each foot by dividing the higher of the two systolic sures in the ankle by the higher of the two systolic pres-sures in the arm. An ABI < 0.9 was considered abnormal [33].
Renal assessment
Kidney damage was assessed by measuring creatinine plasma concentration and glomerular filtration rate (eGFR) as estimated according to the Modification of Diet in Renal Disease-Isotopic Dilution Mass Spectrom-etry (MDRD-IDMS) [36]. Proteinuria was assessed by the albumin/creatinine ratio, (performing a measure-ment every year), following the 2013 European Society of Hypertension/European Society of Cardiology Guide-lines criteria. TOD was defined as a plasma creatinine of 1.3 mg per 100 ml or higher in men and 1.2 mg per 100 ml or higher in women and an eGFR below 60 ml per min or albumin/creatinine ratio ≥30 mg/g [33].
Cardiac assessment
The electrocardiographic examination was performed using a General Electric MAC 3.500 ECG System (Gen-eral Electric, Niskayuna, NY, USA) that automatically measures the voltage and duration of waves and esti-mates the criteria of the Cornell voltage–duration prod-uct (Cornell VDP) and Sokolow Lyon prodprod-uct [37]. The TOD was defined according to the 2013 European Soci-ety of Hypertension/European SociSoci-ety of Cardiology Guidelines criteria [33].
Laboratory determinations
Venous blood sampling was performed between 08:00 and 09:00 after the individuals had fasted and abstained from smoking and the consumption of alcohol and caf-feinated beverages for the previous 12 h. Fasting plasma glucose, HbA1c, homeostasis model assessment-insulin resistance (HOMA-IR), creatinine, total cholesterol, triglycerides and high-density lipoprotein (HDL) cho-lesterol concentrations were measured using standard enzymatic automated methods. Low-density lipoprotein (LDL) cholesterol was estimated using the Friedewald equation. The atherogenic index was estimated by total cholesterol/HDL cholesterol.
The average annual increase in TOD was estimated by dividing the difference between the final and baseline evaluations by the years of follow-up. The individuals performing the various tests were blinded to the clinical data. All assessments were made within 10 days.
Statistics
The Student’s t test was used to analyze the difference between quantitative variables by gender. The evolution of quantitative variables was analyzed using an analysis of variance for repeated measures, corrected by the Bonfer-roni method. The presence or absence of sphericity was taken into account and the Greenhouse and Geisser cor-rection was performed.
We used the McNemar and Cochran tests to contrast the hypothesis of two or more related proportions. In addition, we have analyzed the differences in the yearly increase in intima-media thickness (IMT), PWV and esti-mated glomerular filtration rate (eGFR) in the group of diabetic individuals according to gender. We performed a multiple linear regression analysis, which was adjusted for age and gender, using the stepwise method, one for each of the dependent variable and differences between the fourth measure and baseline (IMT, ABI, cf-PWV, eGFR, Cornell VDP). The independent variables included were: years since diagnosis of diabetes, smoker and mean values taken at the four visits during the 3.5 years of follow-up (atherogenic index, mean blood pressure, body mass index, HbA1C, HOMA-IR, mean number of antihypertensive, lipid lowering and antidiabetic drugs). Data were analyzed using the SPSS version 20.0 statisti-cal package (SPSS Inc., Chicago, Illinois, USA). A value of p < 0.05 was considered statistically significant.
Results
In the first year of follow-up, two men died as result of acute myocardial infarction. Subsequently, two non-fatal cardiovascular events occurred in the male group. In the female group, there was a non-fatal cardiovascular event. The flow chart is shown in Fig. 1.
The median time from diagnosis of type 2 diabetes mel-litus was 9.20 ± 4.16 years. At baseline, the 60.9 % of men and 61.0 % of women had diabetes; 39.1 and 39.0 % had metabolic syndrome; 79.7 and 90.2 % had hypertension; 78.3 and 75.6 % had dyslipidemia and 55.1 and 53.7 % were obese. The mean age was 61 ± 11 years in men and 62 ± 12 in women. We found no statistical differences for gender in any risk factors evaluated.
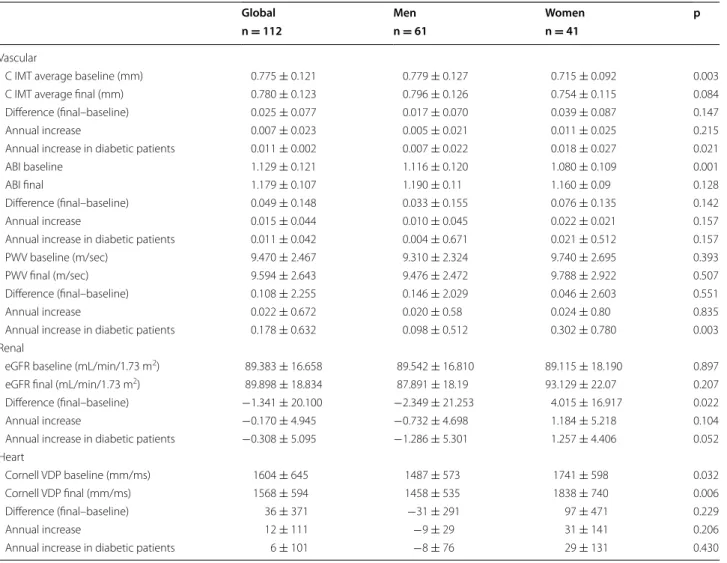
Table 1 shows the cardiovascular risk factors, bio-chemical data and drugs analyzed at each of the four evaluations by gender. Table 2 shows the basal and the annual assessments of vascular, cardiac and renal TOD by gender. In men, we observed an increase in IMT in the fourth assessment. In woman, we observed an increase in IMT and in the number of plaques.
Each year in men and women, the IMT increased 0.005 mm and 0.011, the PWV increased 0.024 and 0.020 m/sec and the eGFR increased -2.35 and 4.02 mL/ min/1.73 m, respectively. The highest increase was in women with type 2 diabetes mellitus (Table 3).
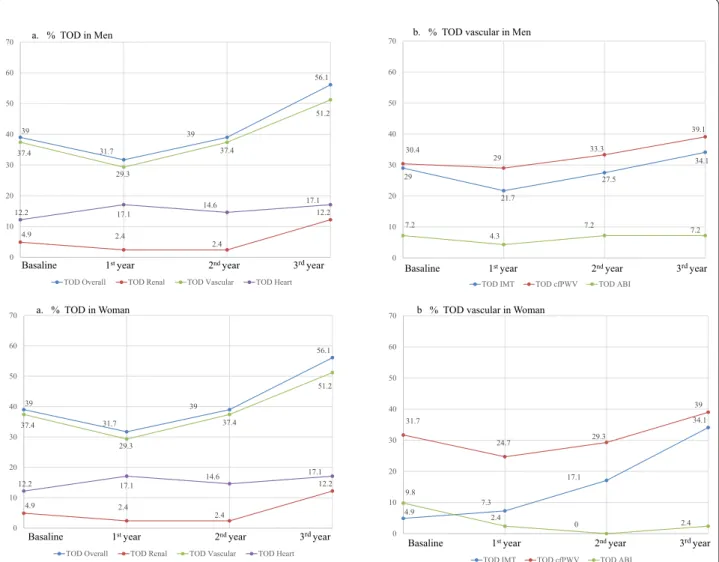
Figure 2 shows the trend and the percentage of par-ticipants, by gender, who had vascular, cardiac and renal TOD at each of the four time points. The over-all TOD increased in men and women by 10 and 17 %, respectively. In men and women, the overall vascular TOD increased by 11.5 and 14 %, the overall renal TOD increased by −8 and 7 %, and the overall cardiac TOD increased by 1.5 and 5 %, respectively.
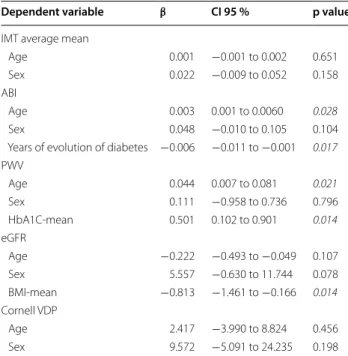
Multiple regression analysis, using the Stepwise method, was performed after adjusting for age and gen-der, and it showed a negative association between the duration since diagnosis of diabetes and ABI changes dur-ing the follow up (β = −0.006; p = 0.017), and between the BMI and glomerular filtration changes (β = −0.813; p = 0.014). The HbA1c was positivenly associated with PWV changes (β = 0.501; p = 0.014; Table 4).
Discussion
This study included a 3.5-year median follow-up period of patients with increased insulin resistance, and it showed five important findings: (1) increased carotid TOD was higher in women; (2) increased renal TOD was higher in women and eGFR had a negative associa-tion with BMI; (3) the largest increase in IMT, PWV and renal TOD was in the group of diabetic women; (4) poor
Basaline
Evaluation 1styear
Evaluation 2ndyear
Evaluation 3rdyear
Men
71
Two male died acute myocardial infarction (76 and 65 years)
69
One ischemic heart disease
69
One CV disease
69
Women
41
No cardiovascular events
41
No cardiovascular events
41
One ischemic heart disease
39
Table 1 Changes in cardiovascular risk factors and medications used by gender
Data for qualitative variables are expressed as n: number (%) and quantitative variables as mean ± standard deviation
BMI body mass index, LDL low density lipoprotein, HDL high density lipoprotein, HbA1C glycosylated hemoglobin, HOMA-IR homeostasis model assessment insulin resistance, SBP systolic blood pressure, DBP diastolic blood pressure
p < 0.05: between * baseline and 1st year; †baseline and 2nd year; ‡ baseline and 3rd year
p < 0.05: between §1st and 2nd year; ||1st and 3rd year
p < 0.05 between ¶2nd and 3rd year
Baseline (n=71) 1st year (n=69) 2nd y (n=69) 3rd y (n=69) p
Men
Smoker’s, n (%)†‡§|| 20 (29) 20 (29) 14 (20) 14 (20) <0.001
Ischemic heart disease n (%) 8 (11) 8 (12) 9 (13) 9 (13) 1.00
Cerebrovascular disease n (%) 2 (3) 2 (3) 2 (3) 3 (4) 0.392
BMI (kg/m2) 30.0 ± 4.1 30.3 ± 4.2 30.4 ± 4.4 30.3 ± 4.5 0.526
Total cholesterol (mg/dL)‡ 198.3 ± 39.3 191.5 ± 41.6 188.9 ± 36.7 183.4 ± 34.4 <0.001
Tryglicerides (mg/dL) 160.6 ± 65.6 153.9 ± 92.8 153.5 ± 101.2 151.7 ± 129.2 0.864 LDL cholesterol (mg/dL)‡ 121.5 ± 36.2 114.6 ± 34.9 110.6 ± 34.8 109.2 ± 32.9 0.026
HDL cholesterol (mg/dL)†‡§|| 44.6 ± 9.2 45.4 ± 10.0 48.1 ± 11.4 48.3 ± 11.7 <0.001
Atherogenic index†‡|| 4.6 ± 1.3 4.4 ± 1.5 4.2 ± 1.3 4.0 ± 1.2 <0.001
Serum glucose (mg/dL) 111.4 ± 32.3 115.3 ± 43.8 112.1 ± 40.7 114.1 ± 37.4 0.759 HbA1c (%) 6.36 ± 1.23 6.51 ± 1.34 6.51 ± 1.06 6.46 ± 1.08 0.493
HOMA‑IR 3.2 ± 2.3 4.3 ± 10.5 2.2 ± 1.9 3.0 ± 2.2 0.284
Office SBP (mm Hg)*ঠ141
± 11 134 ± 15 138 ± 16 132 ± 16 <0.001 Office DBP (mm Hg)*†‡||¶ 86
± 10 81 ± 9 82 ± 10 77 ± 9 <0.001
Mean blood pressure (mmHg)‡||¶ 101
± 11 99 ± 10 101 ± 10 96 ± 10 <0.001 Mean Antihypertensive drugs*†‡ 1.07
± 1.06 1.49 ± 1.26 1.61 ± 1.32 1.64 ± 1.31 <0.001 Antihypertensive drugs n (%)†‡ 42 (60.9) 50 (72.5) 51 (73.9) 52 (75.4) <0.001
Mean Lipid lowering drugs†‡ 0.54
± 0.53 0.62 ± 0.55 0.68 ± 0.61 0.68 ± 0.58 <0.001 Lipid lowering drugs n (%)†‡ 36 (52.2) 41 (59.4) 42 (60.9) 43 (62.3) 0.048
Mean antidiabetic drugs†‡ 0.75
± 0.81 0.83 ± 0.82 0.91 ± 0.92 0.86 ± 0.88 0.048 Antidiabetic drugs, n (%) 38 (55.1) 42 (60.9) 42 (60.9) 42 (60.9) 0.875
Baseline (n = 41) 1st year (n = 41) 2nd year (n = 41) 3rd year (n = 41) p
Women
Smoker’s, n (%) 5 (12.2) 5 (12.2) 5 (12.2) 5 (12.2) 1.00
Ischemic heart disease, n (%) 2(5) 2 (5) 3 (7) 3 (7) 0.392
Cerebrovascular disease, n (%) 0 0 0 0 –
BMI (kg/m2) 30.0 ± 4.1 30.3 ± 4.2 30.4 ± 4.4 30.3 ± 4.5 0.526
Total cholesterol (mg/dL) 204.1 ± 43.8 201.2 ± 37.4 196.2 ± 26.8 188.4 ± 27.2 0.099 Tryglicerides (mg/dL) 140.8 ± 58.7 129.9 ± 40.5 138.4 ± 61.1 129.6 ± 50.5 0.671 LDL cholesterol (mg/dL) 121.9 ± 37.5 121.8 ± 31.1 112.8 ± 25.6 109.9 ± 24.0 0.084 HDL cholesterol (mg/dL)†§ 51.9 ± 13.6 53.5 ± 13.6 55.8 ± 14.1 53.3 ± 11.4 0.027
Atherogenic index 4.1 ± 1.1 3.9 ± 1.0 3.7 ± 1.1 3.7 ± 1.1 0.069 Serum glucose (mg/dL) 116.7 ± 34.7 114.5 ± 39.3 117.4 ± 40.4 110.6 ± 28.9 0.606 HbA1c (%) 6.37 ± 1.11 6.39 ± 1.04 6.53 ± 1.04 6.51 ± 1.04 0.220
HOMA‑IR 3.1 ± 2.5 4.2 ± 11.6 2.9 ± 5.0 2.6 ± 2.2 0.175
Office SBP (mm Hg) 134 ± 17 133 ± 21 131 ± 15 131 ± 17 0.738 Office DBP (mm Hg)‡ 83 ± 12 81 ± 12 78 ± 10 77 ± 10 <0.001
Mean Blood Pressure (mmHg) 97 ± 10 98 ± 13 97 ± 10 95 ± 11 0.260 Mean Antihypertensive Drugs 1.46 ± 1.27 1.54 ± 1.12 1.78 ± 1.17 1.66 ± 0.94 0.133 Antihypertensive Drugs n (%)† 29(70.7) 32 (78.0) 34 (82.9) 36 (87.8) <0.001
Mean Lipid lowering drugs‡|| 0.56 ± 0.59 0.56 ± 0.59 0.68 ± 0.57 0.71 ± 0.56 0.017
Lipid lowering drugs, n (%)†‡ 21 (51.2) 22 (53.7) 26 (63.4) 27 (65.9) 0.033
Mean antidiabetic drugs† 0.95
glycemic control involves greater progression of PWV; and (5) the ABI had a negative association with the dura-tion since diagnosis of diabetes.
We found that IMT progressed 0.005 mm annually in men, 0.011 mm in women and 0.018 mm in diabetic women. Our results are consistent with those pub-lished by Zhao et al. [38] in diabetic women (0.022 mm/ year), but lower than the increase IMT observed in men (0.030 mm/year). This could be because of differences in age, ethnicity, BMI and the number of comorbidities. As in other studies with the general population [24] and dia-betics [38], we have not found any variable that explains the progression of IMT in patients with insulin resist-ance. The increase in IMT and the number of plaques during the follow-up period was higher in females with type 2 diabetes, supporting the results of previous studies
that showed that women with diabetes have a risk of car-diovascular events that is 2-times greater than that in men [12, 39].
The global annual progression of PWV in our study was 0.020 m/sec in men, 0.024 m/sec in women and 0.302 m/sec in diabetic women. Our results are similar to those published by Marcel et al. [25] in type 2 dia-betic patients (the annual increase of PWV was 0.11 m/ sec) and support the data reported by De Angelis et al. [40], which suggests that arterial stiffness and its progres-sion is greater in women with type 2 diabetes mellitus. Similar to previous study results [25], our multivariate linear regression analysis showed a direct association between changes in PWV and mean HbA1c during fol-low-up. These findings have important clinical implica-tions because the improvement in glycemic control could
Table 2 Changes in target organ damage and arterial stiffness by gender
Data for qualitative variables are expressed as n: number and (%) and quantitative variables as mean ± standard deviation
C Carotid, IMT intima media thickness carotid, ABI ankle brachial index, PWV pulse wave velocity, eGFR estimated glomerular filtration rate, Cornell VDP cornell voltage duration product
p < 0.05: between * baseline and 1st year; †baseline and 2nd year; ‡ baseline and 3rd year
p < 0.05: between §1st and 2nd year; ||1st and 3rd year
p < 0.05 between ¶2nd and 3rd year
Men Baseline (n = 71) 1st year (n = 69) 2nd year (n = 69) 3rd year (n = 69) p
Vascular
C‑IMT average (mm)¶ 0.779 ± 0.127 0.776 ± 0.123 0.769 ± 0.123 0.796 ± 0.126 0.005
Plaques carotid n (%) 16 (23.2) 15 (21.7) 19 (27.5) 21 (30.4) 0.148
ABI* 1.15 ± 0.11 1.19 ± 0.12 1.18 ± 0.13 1.16 ± 0.11 <0.001
PWV (m/s) 9.31 ± 2.32 9.33 ± 2.64 9.68 ± 2.37 9.48 ± 2.47 0.661
Renal
Serum creatinine (mg/dL) 0.95 ± 0.14 0.97 ± 0.18 0.93 ± 0.17 0.96 ± 0.18 0.110
eGFR (mL/min/1.73 m2) 89.5 ± 16.8 88.5 ± 18.3 92.3 ± 19.8 87.9 ± 18.2 0.072
Albumin/creatinine ratio (mg/g) 34.8 ± 81.4 44.0 ± 122.9 37.7 ± 113.8 45.9 ± 156.8 0.826
Heart
Cornell VDP (mm/ms) 1487 ± 573 1538 ± 506 1515 ± 543 1458 ± 535 0.285
Sokolow (mm/ms)*§|| 20.3 ± 5.9 18.7 ± 6.2 21.3 ± 6.6 20.4 ± 6.8 <0.001
Women Baseline (n = 41) 1st year (n = 41) 2nd year (n = 41) 3rd year (n = 41) p
Vascular
C‑MT average (mm)§ 0.715 ± 0.092 0.728 ± 0.076 0.726 ± 0.099 0.754 ± 0.115 0.034
Plaques carotid, n (%)†§ 3 (7.3) 3 (7.3) 6 (14.6) 11 (26.8) <0.001
ABI*†‡ 1.07 ± 0.10 1.17 ± 0.09 1.18 ± 0.10 1.14 ± 0.09 <0.001
PWV (m/s) 9.74 ± 2.70 9.21 ± 2.11 9.14 ± 2.34 9.79 ± 2.92 0.286
Renal
Serum creatinine (mg/dL) 0.73 ± 0.11 0.73 ± 0.12 0.70 ± 0.13 0.72 ± 0.14 0.285
eGFR (mL/min/1.73 m2) 89.1 ± 16.6 93.2 ± 22.6 95.0 ± 16.6 93.1 ± 22.1 0.163
Albumin/creatinine ratio (mg/g) 14.6 ± 37.4 6.6 ± 6.6 3.0 ± 5.6 9.1 ± 14.8 0.122
Heart
Cornell VDP (mm/ms) 1741 ± 598 1756 ± 542 1852 ± 680 1838 ± 740 0.430
reduce aortic stiffness, thus reducing the burden of mor-bidity and mortality associated with type 2 diabetes.
We also found a negative association between age, BMI and eGFR, which is in line with previously-published results in patients with type 2 diabetes mellitus [26, 41]. The trend for the ABI was similar in both sexes, for the absolute values and the percentage of patients with ABI < 0.9.
The evaluation of left ventricular hypertrophy was based on the Sokolow criteria and it showed differences between the four measurements in both sexes. However, the results did not show a clear trend, and there was no variable explaining these changes [13].
In summary, our results were similar to previously-published results [12, 42], indicating that women with type 2 diabetes are more vulnerable than men to develop
vascular and renal TOD in the pre-occurrence phases of cardiovascular disease.
The poorer evolution of vascular and renal TOD in females, particularly among those with diabetes, may be due to the fact that women show greater stiffness values in the prepubertal period, and this stiffness moreover increases after menopause. This suggests that women intrinsically have stiffer large arteries than men—though these effects are mitigated by the sexual steroids during the reproductive years [43, 44]. Other factors that can influence the gender differences are: the sexual dimor-phism of lipid metabolism, these differences include how dietary fatty acids are handled, the secretion and clear-ance of very low-density lipoprotein-triglycerides, the release rates of free fatty acids from adipose tissue rela-tive to energy needs, and the removal of free fatty acids
Table 3 Changes in target organ damage by gender
Data for qualitative variables are expressed as n: number and (%) and quantitative variables as mean ± standard deviation
Y year, C carotid, IMT intima media thickness carotid, ABI ankle brachial index, PWV pulse wave velocity, eGFR estimated glomerular filtration rate, Cornell VDP cornell voltage duration product, p gender differences
Global Men Women p
n = 112 n = 61 n = 41
Vascular
C IMT average baseline (mm) 0.775 ± 0.121 0.779 ± 0.127 0.715 ± 0.092 0.003
C IMT average final (mm) 0.780 ± 0.123 0.796 ± 0.126 0.754 ± 0.115 0.084
Difference (final–baseline) 0.025 ± 0.077 0.017 ± 0.070 0.039 ± 0.087 0.147
Annual increase 0.007 ± 0.023 0.005 ± 0.021 0.011 ± 0.025 0.215
Annual increase in diabetic patients 0.011 ± 0.002 0.007 ± 0.022 0.018 ± 0.027 0.021
ABI baseline 1.129 ± 0.121 1.116 ± 0.120 1.080 ± 0.109 0.001
ABI final 1.179 ± 0.107 1.190 ± 0.11 1.160 ± 0.09 0.128
Difference (final–baseline) 0.049 ± 0.148 0.033 ± 0.155 0.076 ± 0.135 0.142
Annual increase 0.015 ± 0.044 0.010 ± 0.045 0.022 ± 0.021 0.157
Annual increase in diabetic patients 0.011 ± 0.042 0.004 ± 0.671 0.021 ± 0.512 0.157
PWV baseline (m/sec) 9.470 ± 2.467 9.310 ± 2.324 9.740 ± 2.695 0.393
PWV final (m/sec) 9.594 ± 2.643 9.476 ± 2.472 9.788 ± 2.922 0.507
Difference (final–baseline) 0.108 ± 2.255 0.146 ± 2.029 0.046 ± 2.603 0.551
Annual increase 0.022 ± 0.672 0.020 ± 0.58 0.024 ± 0.80 0.835
Annual increase in diabetic patients 0.178 ± 0.632 0.098 ± 0.512 0.302 ± 0.780 0.003
Renal
eGFR baseline (mL/min/1.73 m2) 89.383 ± 16.658 89.542 ± 16.810 89.115 ± 18.190 0.897
eGFR final (mL/min/1.73 m2) 89.898 ± 18.834 87.891 ± 18.19 93.129 ± 22.07 0.207
Difference (final–baseline) −1.341 ± 20.100 −2.349 ± 21.253 4.015 ± 16.917 0.022
Annual increase −0.170 ± 4.945 −0.732 ± 4.698 1.184 ± 5.218 0.104
Annual increase in diabetic patients −0.308 ± 5.095 −1.286 ± 5.301 1.257 ± 4.406 0.052
Heart
Cornell VDP baseline (mm/ms) 1604 ± 645 1487 ± 573 1741 ± 598 0.032
Cornell VDP final (mm/ms) 1568 ± 594 1458 ± 535 1838 ± 740 0.006
Difference (final–baseline) 36 ± 371 −31 ± 291 97 ± 471 0.229
Annual increase 12 ± 111 −9 ± 29 31 ± 141 0.206
from the circulation, including the storage of free fatty acids into adipose tissue via the direct uptake process [45, 46] and inflammatory factors [47].
The results of this study will help medical professionals in their routine practice to consider gender differences, particularly as regards the group of diabetic women, with a view to performing better evaluation of vascular, renal and cardiac TOD, and thus affording better treatment suited to each individual case.
This study has some limitations that must be consid-ered. First, the small number of subjects per group lim-its the power of analysis. Second, creatine albumin index
was determined in a single sample each year. Also, at the time of viewing these results, the subjects included in the study had multiple associated pathologies and were being treated with many drugs, which may have affected the TOD values. It is also limited to 3.5 years of follow-up. In addition, these patients were not randomized but were involved consecutive sampling.
In conclusion, this study showed that the progression of vascular and renal TOD differs by gender. The increase of vascular and renal TOD was higher in women, espe-cially in diabetic women. The increase in PWV showed a positive association with mean HbA1c in the follow-up a. %
39
31.7
39
56.1
4.9 2.4
2.4
12.2 37.4
29.3
37.4
51.2
12.2 17.1 14.6
17.1
0 10 20 30 40 50 60 70
TOD Overall TOD Renal TOD Vascular TOD Heart
a. % TOD in Men
Basaline 1st year 2nd year 3rdyear
39
31.7
39
56.1
4.9 2.4
2.4
12.2 37.4
29.3
37.4
51.2
12.2 17.1 14.6
17.1
0 10 20 30 40 50 60 70
TOD Overall TOD Renal TOD Vascular TOD Heart
a. % TOD in Woman
Basaline 1st year 2nd year 3rdyear
29
21.7
27.5
34.1 30.4
29 33.3
39.1
7.2
4.3
7.2 7.2
0 10 20 30 40 50 60 70
TOD IMT TOD cfPWV TOD ABI
Basaline 1st year 2nd year 3rdyear b. % TOD vascular in Men
4.9 7.3
17.1
34.1 31.7
24.7 29.3
39
9.8
2.4
0 2.4
0 10 20 30 40 50 60 70
TOD IMT TOD cfPWV TOD ABI
b % TOD vascular in Woman
Basaline 1st year 2nd year 3rdyear
period. Glomerular filtration was associated with BMI and the ABI was associated with duration since type 2 diabetes mellitus diagnosis.
Abbreviations
ABI: ankle‑brachial index; BMI: body mass index; BP: blood pressure; cf‑PWV: carotid femoral pulse wave velocity; CVD: cardiovascular disease; Cornell VDP: cornell voltage‑duration product; DBP: diastolic blood pressure; MDRD‑IDMS: modification of diet in renal disease‑isotopic dilution mass spectrometry; eGFR: glomerular filtration rate; IMT: ntima‑media thickness; LVH: left ventricu‑ lar hypertrophy; PWV: pulse wave velocity; TOD: target organ damage; SBP: systolic blood pressure; T2DM: type 2 diabetes mellitus.
Authors’ contributions
MAGM designed the study, wrote the protocol, participated in fund raising, interpreted the results, prepared the manuscript draft, performed all analytical testing, interpreted the results and reviewed the manuscript. and corrected the final version of the manuscript. JIRR and CAC participated in the study design, data collection and manuscript review. LGS, MGS, ERS and JAMF participated in the study design, interpretation of results and manuscript review. LGO participated in the protocol design, fund raising, analysis of results
and final review of the manuscript. All authors read and approved the final manuscript.
Author details
1 Primary Care Research Unit, The Alamedilla Health Center, Avda. Comuneros
27, 37003 Salamanca, Spain. 2 Castilla and León Health Service–SACYL. REDI‑
APP, IBSAL, Salamanca, Spain. 3 Medicine Department, University of Salamanca,
Salamanca, Spain. 4 LOD‑DIABETES Group, redIAPP: Research Network on Pre‑
ventive Activities and Health Promotion, 37003 Salamanca, Spain.
Acknowledgements
We thank all professionals participating in the LOD‑DIABETES study, as follows: Coordinating Center: Manuel A Gómez‑Marcos, La Alamedilla Health Center (Castilla y León Health Service‑SACYL, Salamanca, Spain); and Cristina Agudo‑ Conde, Leticia Gomez‑Sanchez, Marta Gomez‑Sanchez, Carmen Castaño‑ Sanchez, Carmela Rodriguez‑Martin, Benigna Sanchez‑Salgado, Angela de Cabo Laso, Emiliano Rodriguez‑Sanchez, Jose Angel Maderuelo‑Fernandez, Emilio Ramos‑Delgado, Carmen Patino‑Alonso, Jose I Recio‑Rodriguez, and Luis Garcia‑Ortiz.
Compliance with ethical guidelines
Competing interests
The authors declare that they have no competing interests.
Sources of funding
The project has been funded by the Institute of Health Carlos III, (ISCiii) of the Ministry of Economy and Competitiveness (Spain) through the Network for Prevention and Health Promotion in Primary Care (redIAPP, RD12/0005), co‑financed with European Union ERDF and the Autonomous Government of Castilla and León in 2009 and 2013 (GRS. 428/A/09; GRS 768/B/13), and the Intensification of Research Program.
Received: 3 July 2015 Accepted: 17 September 2015
References
1. Barnett KN, Ogston SA, McMurdo ME, Morris AD, Evans JM. A 12‑year follow‑up study of all‑cause and cardiovascular mortality among 10,532 people newly diagnosed with Type 2 diabetes in Tayside, Scotland. Diabet Med. 2010;27(10):1124–9.
2. Novo S, Peritore A, Guarneri FP, Corrado E, Macaione F, Evola S, Novo G. Metabolic syndrome (MetS) predicts cardio and cerebrovascular events in a 20 years follow‑up. A prospective study. Atherosclerosis. 2012;223(2):468–72.
3. Novo S, Peritore A, Trovato RL, Guarneri FP, Di Lisi D, Muratori I, Novo G. Preclinical atherosclerosis and metabolic syndrome increase cardio‑ and cerebrovascular events rate: a 20‑year follow up. Cardiovasc Diabetol. 2013;12:155.
4. Ben‑Shlomo Y, Spears M, Boustred C, May M, Anderson SG, Benjamin EJ, Boutouyrie P, Cameron J, Chen CH, Cruickshank JK. Aortic pulse wave velocity improves cardiovascular event prediction: an individual participant meta‑analysis of prospective observational data from 17,635 subjects. J Am Coll Cardiol. 2014;63(7):636–46.
5. Maeda Y, Inoguchi T, Etoh E, Kodama Y, Sasaki S, Sonoda N, Nawata H, Shimabukuro M, Takayanagi R. Brachial‑ankle pulse wave velocity predicts all‑cause mortality and cardiovascular events in patients with diabetes: the Kyushu Prevention Study of Atherosclerosis. Diabetes Care. 2014;37(8):2383–90.
6. van den Oord SC, Sijbrands EJ, ten Kate GL, van Klaveren D, van Domburg RT, van der Steen AF, Schinkel AF. Carotid intima‑media thickness for cardiovascular risk assessment: systematic review and meta‑analysis. Atherosclerosis. 2013;228(1):1–11.
7. Somaratne JB, Whalley GA, Poppe KK, ter Bals MM, Wadams G, Pearl A, Bagg W, Doughty RN. Screening for left ventricular hypertrophy in patients with type 2 diabetes mellitus in the community. Cardiovasc Diabetol. 2011;10:29.
Table 4 With multiple regression analysis evolution
of TOD and vascular structure and function parameters as dependent variables and average risk factors and drugs used as independent variable
Dependent variable: Differences between the final and baseline assessment: (IMT intima‑media thickness of common carotid artery, ABI ankle brachial index,
PWV pulse wave velocity, eGFR estimated glomerular filtration rate, Cornell VDP
cornell voltage duration product)
Muliple linear regression by Stepwise method adjusted for: Age and gender (1 = men, 2 = women)
Indepedent variable: years of evolution of diabetes. Smoker’s (1 = Yes, 0 = No). Mean values of the four measurements taken during the follow‑up: (atherogenic index. Mean blood pressure. Body mass index. HbA1c; HOMA‑IR mean: (Homeostasis Model Assessment Insulin Resistance). Antihypertensive drugs mean. Lipid lowering drugs mean and antidiabetic drugs mean)
Italic values indicate statistical association
Dependent variable β CI 95 % p value
IMT average mean
Age 0.001 −0.001 to 0.002 0.651
Sex 0.022 −0.009 to 0.052 0.158
ABI
Age 0.003 0.001 to 0.0060 0.028
Sex 0.048 −0.010 to 0.105 0.104
Years of evolution of diabetes −0.006 −0.011 to −0.001 0.017
PWV
Age 0.044 0.007 to 0.081 0.021
Sex 0.111 −0.958 to 0.736 0.796
HbA1C‑mean 0.501 0.102 to 0.901 0.014
eGFR
Age −0.222 −0.493 to −0.049 0.107
Sex 5.557 −0.630 to 11.744 0.078
BMI‑mean −0.813 −1.461 to −0.166 0.014
Cornell VDP
Age 2.417 −3.990 to 8.824 0.456
8. Rodriguez‑Poncelas A, Coll‑De Tuero G, Turro‑Garriga O, Barrot‑de la Puente J, Franch‑Nadal J, Mundet‑Tuduri X. Impact of chronic kidney disease on the prevalence of cardiovascular disease in patients with type 2 diabetes in Spain: PERCEDIME2 study. BMC Nephrol. 2014;15:150. 9. Fox CS, Matsushita K, Woodward M, Bilo HJ, Chalmers J, Heerspink HJ, Lee
BJ, Perkins RM, Rossing P, Sairenchi T, et al. Associations of kidney disease measures with mortality and end‑stage renal disease in individuals with and without diabetes: a meta‑analysis. Lancet. 2012;380(9854):1662–73. 10. Cosson E, Nguyen MT, Chanu B, Banu I, Chiheb S, Balta C, Takbou K,
Valensi P. Cardiovascular risk prediction is improved by adding asymp‑ tomatic coronary status to routine risk assessment in type 2 diabetic patients. Diabetes Care. 2011;34(9):2101–7.
11. Anand SS, Islam S, Rosengren A, Franzosi MG, Steyn K, Yusufali AH, Keltai M, Diaz R, Rangarajan S, Yusuf S. Risk factors for myocardial infarction in women and men: insights from the INTERHEART study. Eur Heart J. 2008;29(7):932–40.
12. Huxley R, Barzi F, Woodward M. Excess risk of fatal coronary heart disease associated with diabetes in men and women: meta‑analysis of 37 pro‑ spective cohort studies. BMJ. 2006;332(7533):73–8.
13. Cuspidi C, Rescaldani M, Sala C, Negri F, Grassi G, Mancia G. Prevalence of electrocardiographic left ventricular hypertrophy in human hypertension: an updated review. J Hypertens. 2012;30(11):2066–73.
14. Fowkes FG, Murray GD, Butcher I, Heald CL, Lee RJ, Chambless LE, Folsom AR, Hirsch AT, Dramaix M, deBacker G, et al. Ankle brachial index com‑ bined with Framingham Risk Score to predict cardiovascular events and mortality: a meta‑analysis. JAMA. 2008;300(2):197–208.
15. Gottsäter M, Östling G, Persson M, Engström G, Melander O, Nilsson PM. Non‑hemodynamic predictors of arterial stiffness after 17 years of follow‑ up: the Malmo Diet and Cancer study. J Hypertens. 2015;33(5):957–65. doi:10.1097/HJH.0000000000000520.
16. Katakami N, Osonoi T, Takahara M, Saitou M, Matsuoka TA, Yamasaki Y, Shimomura I. Clinical utility of brachial‑ankle pulse wave velocity in the prediction of cardiovascular events in diabetic patients. Cardiovasc Diabetol. 2014;13(128). doi:10.1186/s12933‑014‑0128‑5.
17. Novo S, Peritore A, Trovato RL, Guarneri FP, Di Lisi D, Muratori I, Novo G. Preclinical atherosclerosis and metabolic syndrome increase cardio‑ and cerebrovascular events rate: a 20‑year follow up. Cardiovasc Diabetol. 2013;12(155). doi:10.1186/1475‑2840‑12‑155.
18. Fang FS, Liu MY, Cheng XL, Zhong WW, Miao XY, Li J, Li CL, Tian H. Insulin resistance correlates with the arterial stiffness before glucose intolerance. Intern Med. 2014;53(3):189–94.
19. Noon JP, Trischuk TC, Gaucher SA, Galante S, Scott RL. The effect of age and gender on arterial stiffness in healthy Caucasian Canadians. J Clin Nurs. 2008;17(17):2311–7. doi:10.1111/j.1365‑2702.2007.02155.x. 20. Greve SV, Marie KB, Blyme A, Sehestedt T, Hansen TW, Rassmusen S,
Vishram JKK, Ibsen H, Torp‑Pedersen C, Olsen MH. Association between albuminuria, atherosclerotic plaques, elevated pulse wave velocity, age, risk category and prognosis in apparently healthy individuals. J Hyper‑ tens. 2014;32(5):1034–41. doi:10.1097/HJH.0000000000000147. 21. Timóteo AT, Carmo MM, Ferreira RC. Can metabolic syndrome presence
predict carotid intima‑media thickness? J Clin Hypertens. 2012;14(8):507– 13. doi:10.1111/j.1751‑7176.2012.00630.x.
22. Tripolt NJ, Narath SH, Eder M, Pieber TR, Wascher TC, Sourij H. Multiple risk factor intervention reduces carotid atherosclerosis in patients with type 2 diabetes. Cardiovasc Diabetol. 2014;13:95. doi:10.1186/1475‑2840‑13‑95. 23. Ydin Y, Berker D, Ustün I, Gül K, Erden G, Kutlucan A, Yilmaz AL, Güler S.
Evaluation of carotid intima media thickness in impaired fasting glucose and impaired glucose tolerance. Minerva Endocrinol. 2011;36(3):171–9. 24. Lorenz MW, Polak JF, Kavousi M, Mathiesen EB, Volzke H, Tuomainen TP, Sander D, Plichart M, Catapano AL, Robertson CM, et al. Carotid intima‑ media thickness progression to predict cardiovascular events in the general population (the PROG‑IMT collaborative project): a meta‑analysis of individual participant data. Lancet. 2012;379(9831):2053–62. 25. Mt F, Nc L, Cr C, Gf S. Correlates of aortic stiffness progression in patients
with type 2 diabetes: importance of glycemic control: the Rio de Janeiro type 2 diabetes cohort study. Diabetes Care. 2015;38(5):897–904. 26. Medina‑Escobedo M, Romero‑Campos S, Sansores‑Espana D, Viveros‑
Cortes A, Villanueva‑Jorge S. Changes in body composition according to kidney damage in patients with type 2 diabetes mellitus. Rev Med Inst Mex Seguro Soc. 2013;51(1):26–33.
27. de Hauteclocque A, Ragot S, Slaoui Y, Gand E, Miot A, Sosner P, Halimi JM, Zaoui P, Rigalleau V, Roussel R, et al. The influence of sex on renal function decline in people with Type 2 diabetes. Diabet Med. 2014;31(9):1121–8. 28. Ring M, Eriksson MJ, Fritz T, Nyberg G, Östenson CG, Krook A, Zierath JR, Caidahl K. Influence of physical activity and gender on arterial function in type 2 diabetes, normal and impaired glucose tolerance. Diab Vasc Dis Res. 2015;12(5):315–24.
29. Gomez‑Marcos MA, Recio‑Rodriguez JI, Rodriguez‑Sanchez E, Castano‑ Sanchez Y, deCabo‑Laso A, Sanchez‑Salgado B, Rodriguez‑Martin C, Castano‑Sanchez C, Gomez‑Sanchez L, Garcia‑Ortiz L. Central blood pressure and pulse wave velocity: relationship to target organ damage and cardiovascular morbidity‑mortality in diabetic patients or metabolic syndrome. An observational prospective study. LOD‑DIABETES study protocol. BMC Public Health. 2010;10:143.
30. American Diabetes Association. Diagnosis and classification of diabetes mellitus. Diabetes Care 2010;33(Suppl 1):S62–9. doi:10.2337/dc10‑S062. 31. Grundy SM, Cleeman JI, Daniels SR, Donato KA, Eckel RH, Franklin BA,
Gordon DJ, Krauss RM, Savage PJ, Smith SC Jr, et al. Diagnosis and man‑ agement of the metabolic syndrome: an American Heart Association/ National Heart, Lung, and Blood Institute Scientific Statement. Circulation. 2005;112(17):2735–52.
32. World Medical Association Declaration of Helsinki. ethical principles for medical research involving human subjects. JAMA. 2013;310(20):2191–4. 33. Mancia G, Fagard R, Narkiewicz K, Redon J, Zanchetti A, Bohm M,
Christiaens T, Cifkova R, De Backer G, Dominiczak A, et al. 2013 ESH/ESC Guidelines for the management of arterial hypertension: the Task Force for the management of arterial hypertension of the European Society of Hypertension (ESH) and of the European Society of Cardiology (ESC). J Hypertens. 2013;31(7):1281–357.
34. Van Bortel LM, Laurent S, Boutouyrie P, Chowienczyk P, Cruickshank JK, De Backer T, Filipovsky J, Huybrechts S, Mattace‑Raso FU, Protogerou AD, et al. Expert consensus document on the measurement of aortic stiffness in daily practice using carotid‑femoral pulse wave velocity. J Hypertens. 2012;30(3):445–8.
35. Gomez‑Marcos MA, Recio‑Rodriguez JI, Patino‑Alonso MC, Agudo‑ Conde C, Gomez‑Sanchez L, Gomez‑Sanchez M, Rodriguez‑Sanchez E, Garcia‑Ortiz L. Protocol for measuring carotid intima‑media thickness that best correlates with cardiovascular risk and target organ damage. Am J Hypertens. 2012;25(9):955–61.
36. Levey AS, Bosch JP, Lewis JB, Greene T, Rogers N, Roth D. A more accurate method to estimate glomerular filtration rate from serum creatinine: a new prediction equation. Modification of Diet in Renal Disease Study Group. Ann Intern Med. 1999;130(6):461–70.
37. Okin PM, Roman MJ, Devereux RB, Kligfield P. Electrocardiographic iden‑ tification of increased left ventricular mass by simple voltage‑duration products. J Am Coll Cardiol. 1995;25(2):417–23.
38. Zhao B, Liu Y, Zhang Y, Chen Y, Yang Z, Zhu Y, Zhan W. Gender difference in carotid intima‑media thickness in type 2 diabetic patients: a 4‑year follow‑up study. Cardiovasc Diabetol. 2012;16(11):11–51.
39. Dantas APV, Fortes ZB, de Carvalho MHC. Vascular disease in diabetic women: why do they miss the female protection? Exp Diabetes Res. 2012;570598(10):3.
40. De Angelis L, Millasseau SC, Smith A, Viberti G, Jones RH, Ritter JM, Chowienczyk PJ. Sex differences in age‑related stiffening of the aorta in subjects with type 2 diabetes. Hypertension. 2004;44(1):67–71. 41. Ito H, Komatsu Y, Mifune M, Antoku S, Ishida H, Takeuchi Y, Togane M. The
estimated GFR, but not the stage of diabetic nephropathy graded by the urinary albumin excretion, is associated with the carotid intima‑media thickness in patients with type 2 diabetes mellitus: a cross‑sectional study. Cardiovasc Diabetol. 2010;9:18.
42. Gyárfás I, Keltai M, Salim Y. Effect of potentially modifiable risk factors associated with myocardial infarction in 52 countries in a case‑control study based on the INTERHEART study. Orv Hetil. 2006;147(15):675–86. 43. Marlatt KL, Kelly AS, Steinberger J, Dengel DR. The influence of gender on
carotid artery compliance and distensibility in children and adults. J Clin Ultrasound. 2013;41(6):340–6.
45. Anoop S, Misra A, Bhardwaj S, Gulati S. High body fat and low muscle mass are associated with increased arterial stiffness in Asian Indians in North India. J Diabetes Complications 2014.
46. Santosa S, Jensen MD. The sexual dimorphism of lipid kinetics in humans. Front Endocrinol (Lausanne). 2015;6:103.
47. Gomez‑Marcos MA, Recio‑Rodriguez JI, Patino‑Alonso MC, Agudo‑Conde C, Gomez‑Sanchez L, Rodriguez‑Sanchez E, Gomez‑Sanchez M, Martinez‑ Vizcaino V, Garcia‑Ortiz L. Relationships between high‑sensitive C‑reactive protein and markers of arterial stiffness in hypertensive patients. Differ‑ ences by sex. BMC Cardiovasc Disord. 2012;12:37.
Submit your next manuscript to BioMed Central and take full advantage of:
• Convenient online submission • Thorough peer review
• No space constraints or color figure charges • Immediate publication on acceptance
• Inclusion in PubMed, CAS, Scopus and Google Scholar • Research which is freely available for redistribution