ISSN:1991-8178
Australian Journal of Basic and Applied Sciences
Journal home page: www.ajbasweb.com
Corresponding Author: Yah-ya Abubakar, Universiti Putra Malaysia, Department of Agribusiness and Information Systems, Faculty of Agriculture, 43400 Serdang, Selangor, Malaysia.
Tel: +601-123272603, Fax: +603-89408213, E-mail: [email protected]
Malaysian Consumers’ Demand for Quality Attributes of Imported Rice
Yah-ya Abubakar, Golnaz Rezai, Mad Nasir Shamsudin and Zainalabidin Mohamed
Universiti Putra Malaysia, Department of Agribusiness and Information Systems, Faculty of Agriculture, 43400 Serdang, Selangor, Malaysia
A R T I C L E I N F O A B S T R A C T
Article history:
Received 10 October 2015 Accepted 30 November 2015 Available online 31 December 2015
Keywords:
Rice attributes; consumers’ demand; Conjoint Analysis
Background: Growing per capital income, life style changes and better standard of living has led to changes in Malaysian consumers’ food choices. Consumers have become more empowered and demand for higher quality food. As a result, rice importation has increased to supply consumers with quality varieties not available locally. The analysis of demand for the attributes of these imported varieties takes on particular importance due to increasing cost of importation and subsequent attempts for local production of some of the imported varieties. Objective: The present study was aimed at investigating consumers’ demand for the quality attributes of imported rice varieties now apparent in the market Results: It was found that texture is the most important attribute, followed by grain size, taste, aroma and colour is the least important. It was also found that consumers are willing to pay for all attributes except colour that gives a negative utility. Conclusion: The result shows a possible internal substitution and increase demand for higher quality rice. Even though consumers are price sensitive, they still prefer quality and are willing to pay for better quality rice.
© 2015 AENSI Publisher All rights reserved. To Cite This Article: Yah-ya Abubakar, Golnaz Rezai, Mad Nasir Shamsudin and Zainalabidin Mohamed., Malaysian Consumers’ Demand for Quality Attributes of Imported Rice. Aust. J. Basic & Appl. Sci., 9(37): 317-322, 2015
INTRODUCTION
In Malaysia, rice is not just a staple food but synonymous with food itself. It is the most important source of calorie intake for majority of Malaysians (Abdullahi et al., 2011). Rice production has increased over the years, however, the country still import rice. About 30-40% of domestic rice demand is imported annually not only to suffice shortfall in supply but to meet the taste of consumers for quality varieties not produced locally (Bernas, 2015). Recently, spending on importation has become a marked concern as the country’s rising per capital income stimulates increase in the demand and consumption of imported quality rice rather than quantity proportionally which consequently led to increased importation to satisfy consumers taste. In response, the government is investing effort to restrict importation through the introduction of hybrids with attributes similar to some of the imported varieties (Abidin et al., 2012).
Malaysian market is deluged with various types of imported rice varieties such as jasmine, basmati, normal white rice, glutinous rice, parboiled and brown rice from different countries such as Thailand, Vietnam, India, Pakistan and USA at varying prices (Jamal et al., 2013). The existence of this wide variety of imported rice available to consumers was
the background context to this study, which inquired in to consumers’ demand for rice attributes such as texture, taste, aroma, colour and grain size. The mythological approach allowed us to analyze the importance of these attributes to Malaysian consumers and subsequently, the overall utility that each of these attributes provides. Since the introduction of new varieties involves more cost and effort, it is equally important to know what consumers are willingness to pay for the improved varieties and what price they are unwilling to pay.
Chinese/Taiwanese prefer both the long and short grain and about one third of the American also prefer the short grain. He also reported that European consumers prefers long grain, well milled rice with strong aroma, while long grain rice with no scent is preferred in the Middle East. Azabagaoglu et al. (2009) analyze consumer preference to different rice varieties in turkey, he found out that consumer have priority for attributes such as long grain, freshness, cleanliness, palatability and flavour of the rice grain. Walissinghe et al. (2012) conducted a research on consumer preferences for quality attributes of rice in Sri Lanka, he concluded that White colour, purity and type (samba) are the most significant attributes for consumers. Fiamohe et al. (2013) also look at consumer purchasing criteria for types of rice in Togo and concluded that consumers are willing to pay for whiteness, minimum breakage, aroma and conservation after cooking
MATERIALS AND METHODS
Data sources:
The data are collected from a survey conducted in early 2015 consisting of 500 Malaysian rice consumers mostly responsible for their household food purchases. The sample population is related to the Klan valley area of Malaysia where proportionate individuals were interviewed in both the urban and the suburban areas.
The design was a systematic random sampling used to select every first three supermarket and hypermarket in each area and every 10th person who enters each of the selected supermarket and hypermarket was interviewed. The criterion used, adopted due to the fact that imported rice brands are widely available at the supermarkets and hypermarkets and consumers from all walk of life shop there. In cases of refusal, the next person was assumed the 10th person and interviewed.
Conjoint analysis:
The study employs conjoint analysis (CA). It is a technique used to explore consumers’ product preferences based on the important attributes that defines the product. The model allows alternative product concept to be described as a series of specific
levels of a common set of attributes (Ness & Gerhardy, 1994). The aim of CA is to identify attribute combinations most preferred by the consumers and to establish their relative importance based on their contribution to total satisfaction (utility). Since its introduction to marketing research 1971 (Green and Rao, 1971), it has become an important marketing technique with many application in marketing research projects (Rao, 2014). Conjoint analysis has been applied to a range of food products; eggs (Ness & Gerhardy, 1994), fruit and vegetable (Van der pol et al., 1996) honey (Murphy et al., 2000), organic rice (Ara, 2003), farm house cheese (Murphy et al., 2004), genetically modified tofu (Jan et al., 2007), beef products (Mennecke et al., 2007), rice (Walisinghe & Gunaratne, 2012), beef and broiler (Hanis et al., 2013)
Central to conjoint analysis is consumers’ trade off among attribute level combinations when choosing among alternative products, according to Ness and Gerhardy (1994), Van Der Pol et al. (1996) and Mesías et al. (2011), the main assumption of CA are as follows
1. Every product can be delineated as a set of attributes
2. Products of the same set of common attributes can be delineated as a set of different attribute levels 3. Consumers evaluate a product when making purchase decision based on the value attached to the different attributes
4. The total utility consumer derives from a product is the sum of utility contributed by each attribute level (part-worth utility)
The first step in the research design is to determine the relevant attributes and specify their possible levels (Hair et al., 2009). These attributes should be communicable and actionable from R&D viewpoint (Rao, 2014). In the present study, attributes and levels were determined from a prior group discussion session and information was collected on the most commonly consumed imported rice varieties which are feasible for the given attributes and after which appropriate levels were determined, these attributes and levels are listed in Table 1.
Table 1: Attributes of imported rice and their levels.
Attribute levels
1. Texture Sticky Non-sticky
2. Taste Plain taste Tasteful
3. Aroma Non-aromatic Aromatic
4. Colour White Creamy white
5. Grain size Short Medium Long
6. Price No increase 5% increase 10% increase
Having specified the attributes and their levels, hypothetical scenarios with different combination of attributes was generated and presented to the respondents. The study gave rise to 144 possible
design, using SPSS conjoint was used to reduce the scenarios to 12 while also controlling for unrealistic profiles such as profiles with more desirable
attributes offered at low price level. Table 2 present an example of one of the profiles presented to the respondents.
Table 2: Example of final card presented to consumer.
Card 8 Non-sticky
Tasteful Aromatic Creamy white
Short 10% increase Consumers were asked to rate the profiles according to their preferences for the combination of levels that defined each profile. The study utilizes verbal description with a rating scale anchored from one to ten with one being “least preferred” and ten being “most preferred” respectively
The model was estimated using ordinary least square regression, this model provides the opportunity of establishing the relative importance of the attributes and their respective part-worth utilities. The combination of the desired attribute level yielded the ideal product most preferred by the consumers. In establishing the relative importance of the various attributes, relationship was specified between attributes and utility using the linear additive model. The model assumed part-worth of each attribute level to be independent and total utility is the sum of attributes level part-worths. The linear additive model is specified as:
U = β0 + β1 Texture + β2 Taste + β3 Aroma + β4 Colour + β5 Grain size + β6 Price
Where U is the utility or preference score for a rice variety with a given level of each attributes; Texture takes on a value of 1 for sticky, 2 for non-sticky; Taste takes on the value of 1 for plain taste, 2 for tasteful; Aroma takes on a value of 1 for non-aromatic and a value of 2 for non-aromatic; Colour pertains to the appearance of the rice grain (1 for white and 2 for creamy white); Grain size indicates whether the rice is short, medium or long (1 if short, 2 if medium and 3 if long) and price represents the three price levels used (no increase in current price, 5% increase in current and 10% increase in current price). The parameters β0 to β6 are coefficients of the model to be estimated.
Willingness to pay:
Willingness to pay pertain to the economic viability of the ideal product. The demanded rice needs to be economically viable and thus, tradeoff will have to be made between quality and price. That is, the aim of estimating willingness to pay is to determine the maximum value of money that an individual is willingness to give to equalize utility (Galawat et al., 2010)
The inclusion of cost as an attribute in a conjoint study allows for estimation of the willingness to pay of all other attributes included in the study. It
indicates how much consumers are willing to pay for a unit increase in each attribute. It is calculated by dividing the coefficient value of each non-price attribute by the coefficient value of price attribute. For this study, willingness to pay was estimated for four attributes- texture, taste, aroma and grain size
RESULTS AND DISCUSSION
Profiles of respondents:
The distribution of demographic profile of respondents is shown in Table 3. The total sample comprises 39.1% male and 60.9% female. The age of respondents were grouped into five categories; below 25 years old, 26 to 35 years old, 36-45, 46-55, and more than 56 years old. About 18.6% were below 25years old, 27.8% from 26-35 years old, 25.4% from 36-45, 17.6% from 45-55 with about 10.6% above 51 years old. Respondents’ range of income was grouped into five, below RM2000, RM2000-RM3000, RM3001-RM4000, RM4001-RM5000 and more than RM5000. About 28.7% were from below RM2000, 18.6% from RM2000-RM3000, 15.6% from RM3001-RM4000, 12.2% from RM4001-RM5000 and 25.6% were above RM4001-RM5000. In terms of ethnic, 59.8% were Malay, 22.0% were Chinese, 14.0% were Indian, and 4.2% were from other ethnics. For respondents’ occupation, the categories of occupation were divided into five categories. The categories were; the government sector, private sector, self-employed, unemployed, retired and others. 37.9% were working with the government, 34.2% were from private sector, 13.6% were self-employed, 8.6% were unself-employed, 1.5% was retirees and 4.6% were others. Respondent’s education level was categorized primary school, secondary school and tertiary. About 4.4% have attended primary school, 20.8% have attended secondary school and 74.8 % have tertiary education.
Importance of rice attributes:
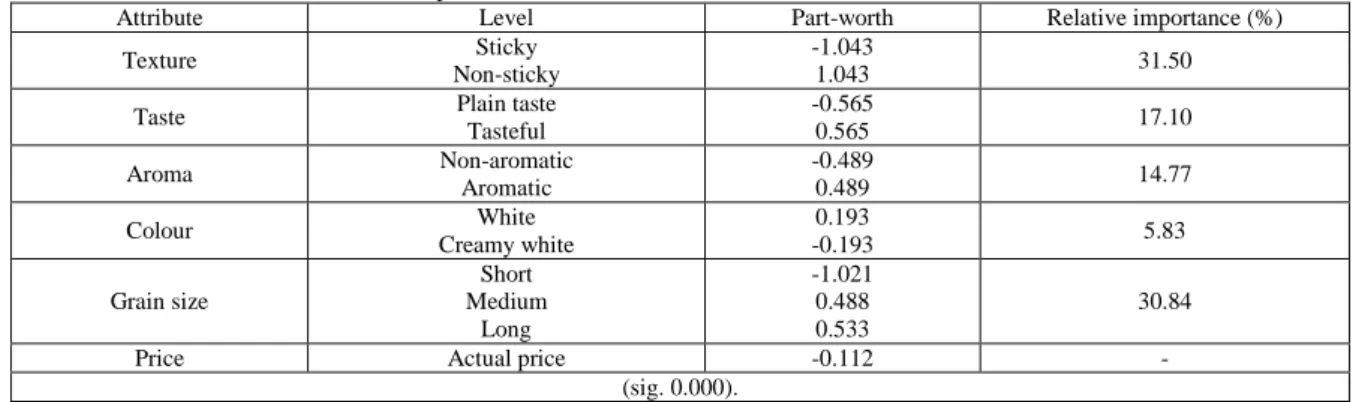
of the part-worth scores indicates the direction in which the attributes influence the preferences. A positive part-worth score signifies higher influence of that attribute on the overall preference or utility score and vice versa. Texture (31.50 per cent) is the most important attribute, followed by grain size
(30.84 per cent), taste (17.10 per cent), aroma (14.77 per cent) and colour (5.83 per cent). Texture and grain size was more than twice as important compared to aroma and more than 5 times as important compared to colour.
Table 3: Profile of respondents.
Demographic factors Percentage (n = 500)
Gender Male
Female
39.1 60.9
Age (years old)
Below 25 26-35 36-45 46-55 Above 56
18.6 27.8 25.4 17.6 10.6
Income (RM)
Below 2000 2000 - 3000 3001 - 4000 4001 - 5000 Above 5000
28.7 18.0 15.6 12.2 25.6
Ethnic
Malay Chinese
Indian Others
59.8 22.0 14.0 4.2
Employment
Government sector Private sector Self-employee
Retired Unemployed
Others
37.9 34.2 13.6 1.5 8.3 4.6 Education
Primary Secondary
Tertiary
4.4 20.8 74.8 Within each attributes, the utilities of each level
was also investigated. For example, with grain size, the most utility was obtained from a rice variety with long grain (U = 0.533), whereas the utility of a medium grain rice was lower (U = 0.488) but higher than a small grain rice (U = -1.021). The remaining utilities can be read from table 4 below. The negative sign of price suggest that the higher the price of rice
the lower the preference score. That is, the higher the price, the greater reduction to total utility. This shows that consumers in this survey are price conscious as coefficient of actual price is negative which indicates a reduction in utility with increase in price level. This consistence with previous studies (Hanis et al., 2012; Mesías et al., 2011)
Table 4: Part-worth of levels and relative importance of attributes.
Attribute Level Part-worth Relative importance (%)
Texture Sticky
Non-sticky
-1.043
1.043 31.50
Taste Plain taste
Tasteful
-0.565
0.565 17.10
Aroma Non-aromatic Aromatic -0.489 0.489 14.77
Colour White
Creamy white
0.193
-0.193 5.83
Grain size
Short Medium
Long
-1.021 0.488 0.533
30.84
Price Actual price -0.112 -
(sig. 0.000).
Willingness to pay:
The result of the willingness to pay displayed in Table 5 was calculated based on the average price of imported rice RM3.5 per kilogram. Based on the result, texture has the highest willingness to pay as consumers are willingness to pay extra Rm2.17 per kg for an increase in quality (for instance from sticky to non-stick), Rm1.18 per unit increase in taste,
Table 5: Consumers’ willingness to pay.
Attribute β0/-β
price
WTP (RM/kg)
Texture 0.6212 2.17 (5.67)
Taste 0.3365 1.18 (4.68)
Aroma 0.2912 1.02 (4.52)
Colour -b -b
Grain size 0.6081 2.13 (5.63)
b since colour provides a negative utility, it will unreasonable to calculate its economic value
Conclusions:
The conjoint analysis for the overall 500 consumers, found that the ideal rice variety had the following attributes: a non-sticky texture, tasteful, aromatic, white and long grain. Texture and grain size were felt to be the most important product attributes for the overall 500 consumers, followed by taste of the rice, aroma of the rice and then colour (white preferred over creamy white). There was a considerable variation in utility between the attributes, the two attribute levels that provided the highest positive utility were non-sticky texture (U = 1.043) and long grain rice (U = 1.021) followed by tasteful (U = 0.565), aromatic (U = 0.488) and the least is creamy white colour which gives a negative utility (U= -0.193). The coefficient of actual price was negative implying that consumers in the survey are price sensitive.
The inclusion of price allowed for the estimation of willingness to pay [26]. Consumers are willing to pay Rm2.17 extra per kilogram for a unit increase in texture, Rm1.18 per unit increase in taste, Rm1.02 per unit increase in aroma and Rm2.13 per unit increase in grain size. Since colour provides negative utility, it would make no sense to calculate the economic value of its attribute. The result shows a possible internal substitution and increase demand for higher quality rice. Even though consumers are price sensitive, they still prefer quality and are willing to pay for improved quality rice.
REFERENCES
Abdullahi Farah, A., M. Zainalabidin, A.L. Ismail, 2011. The influence of socio-demographic factors and product attributes on attitudes toward purchasing special rice among Malaysian consumers. International Food Research Journal, 18(3): 1135– 1142.
Abidin, Z., B. Hassan, Crops, I. (n.d.). Issues And Challenges - Strategies To Sustain Rice Industry Through R & D.
Ahmad Hanis, I.A.H., S. Jinap, S. Mad Nasir, R. Alias, A.K. Muhammad Shahrim, 2012. Consumers’ demand and willingness to pay for rice attributes in Malaysia. International Food Research Journal, 19(1): 363–369.
Ahmad Hanis, I.A.H., S. Jinap, S. Mad Nasir, R. Alias, 2013. Consumer preference for food attributes in Malaysia: case studies on broiler and beef. Journal of international food and agribusiness marketing, 25: 137-153
Akpokodje, G., F. Lançon, O. Erenstein, 2003. Nigeria’s rice policy and development. A review.
Ara, S., 2003. Consumer Willingness to Pay for Multiple Attributes of Organic Rice : A Case Study in the Philippines. 25th International Conference of Agricultural Economists, August 16-22, 2003, Durban, South Africa, 1–15.
Azabagaoglu, M.O., O. Gaytancioglu, 2009. Analysing consumer preference to different rice varieties in turkey, 42(3): 118–125.
Baldwin, K., N. Childs, J. Dyck, J. Hansen, 2012. A Report from the Economic Research Service Southeast Asia ’ s Rice Surplus.
Bernas, Padiberas Nasional Berhad. http://www.bernas.com.my/index.php/2014-06-27-15-49-00/2014-06-27-15-49-2.
Diako, C., E. Sakyi-Dawson, B. Bediako-Amoa, F.K. Saalia, J.T. Manful, 2010. Consumer Perceptions, Knowledge and Preferences for Aromatic Rice Types in Ghana. Nature and Science, 8(12): 12–19.
Fiamohe, R., P.A. Seck, T. Nakelse, A. Diagne, 2013. Assessing the effect of consumer purchasing criteria for types of rice in Togo: A choice modelling approach. The 4th International Conference of the African Association of Agricultural Economists, 22-25, 2013, 103.
Fitzgerald, M.A., 2010. Rice: characteristics and quality requirements. Cereal Grains: Assessing and managing quality. Woodhead Publishing Limited. http://doi.org/10.1533/978-1-84569-563-7.2.212.
Galawat, F., M. Yabe, R. Economics, 2010. Assessing Consumer’s Preference for Local Rice in Brunei : an Application of Choice Model. Journal of International Society for Southeast Asian Agricultural Science, 16(2): 104–115.
Green, P.E., V.R. Rao, 1971. Conjoint measurement for quantifying judgmental data. Journal of Marketing Research, 8: 355–363.
Hair, J.F.J., W.C. Black, B.J. Babin, R.E. Anderson, 2009. Multivariate Data Analysis.
Jamal, K., N.H. Kamarulzaman, A.M. Abdullah, M.M. Ismail, M. Hashim, 2013. Farmer’s acceptance towards fragrant rice farming: The case of non-granary areas in the East Coast, Malaysia. International Food Research Journal, 20(5): 2895– 2899.
Louviere. J.J., 1988. Analysing decision making: Metric conjoint analysis. Newbury Park: Sage Publications Inc.
Mennecke, B.E., A.M. Townsend, D.J. Hayes, S.M. Lonergan, 2007. A study of the factors that influence consumer attitudes toward beef products using the conjoint market analysis tool. Journal of Animal Science, 85(10): 2639–2659.
Mesías, F.J., F. Martínez-Carrasco, J.M. Martínez, P. Gaspar, 2011. Functional and organic eggs as an alternative to conventional production: A conjoint analysis of consumers’ preferences. Journal of the Science of Food and Agriculture, 91(3): 532– 538.
Murphy, M., C. Cowan and M. Henchion, 2000. Irish consumer preferences for honey: a conjoint approach. Br Food J., 1028: 585–598.
Murphy, M., Cowan, Cathal, Meehan, Hilary, O’Reilly, Seamus, 2004. A conjoint analysis of Irish consumer preferences for farmhouse cheese. British Food Journal, 106(4): 288–300.
Ness, M.R., Gerhardy, Hubert, 1994. Consumer Preferences for Quality and Freshness Attributes of Eggs. British Food Journal, 96(3): 26–34.
Rao, V.R., 2014. Applied Conjoint Analysis. http://doi.org/10.1007/978-3-540-87753-0
Suwannaporn, 2008. Consumer Preferences and Buying Criteria in Rice. (n.d.). : A Study to Identify Market Strategy for Thailand Jasmine Rice Export.
Van der Pol, M. and M. Ryan, 1996. “Using conjoint analysis to establish consumer preferences for fruit and vegetables”, British Food Journal, 98(8): 5-12.