INSTITUT NATIONAL
DE SANTÉ PUBLIQUE
DU QUÉBEC
Asbestos: Current Knowledge on the Exposure
and Diseases of Workers and the General
Asbestos: Current Knowledge on the Exposure
and Diseases of Workers and the General
Population in Québec from 2003 to 2009
Direction des risques biologiques et de la santé au travail
Ariane Dubé-Linteau, M. Sc., Research, Planning and Programming Officer Institut national de santé publique du Québec
Louise De Guire, M.D., M. Sc., Medical Advisor Institut national de santé publique du Québec Georges Adib, M. Sc., Occupational Hygienist Institut national de santé publique du Québec
WITH THE COLLABORATION OF
Charles Beaudry, M. Sc., Occupational Hygienist Université de Montréal
Denis Bégin, M. Sc., Chemist Université de Montréal
Denis Belleville, M.D., M. Sc., Medical Advisor Institut national de santé publique du Québec Marie-Hélène Bourgault, M. Sc., Biologist Institut national de santé publique du Québec Évelyne Cambron-Goulet, M.D., M. Sc. Université de Sherbrooke
Chantal Dion, Ph. D., Chemist
Institut de recherche Robert-Sauvé en santé et en sécurité du travail
Daniel Drolet, M. Sc., Chemist
Institut de recherche Robert-Sauvé en santé et en sécurité du travail
André Dufresne, Ph. D., Director Université de Montréal
Fabien Gagnon, M.D., Medical Advisor Agence de la santé et des services sociaux de l’Estrie/Direction de la santé publique et de l’évaluation
Michel Gérin, Ph. D., Chemist Université de Montréal
Suzanne Gingras, M. Sc., Statistician
Institut national de santé publique du Québec Claude Huneault, Occupational Hygienist Agence de la santé et des services sociaux de Montréal/Direction de santé publique
France Labrèche, Ph. D., Epidemiologist Institut national de santé publique du Québec Germain Lebel, M.A., M. Sc., Scientific Advisor Institut national de santé publique du Québec François Lemay, Computer Analyst
Institut de recherche Robert-Sauvé en santé et en sécurité du travail
Guy Perrault, Ph. D., Consultant
Consultation en recherche et développement et expertise en santé et sécurité au travail
Simone Provencher, M.D., M. Sc., Medical Advisor Institut national de santé publique du Québec René Veillette, M.D., Medical Advisor
Institut national de santé publique du Québec Stéphanie Viau, Research Assistant
Institut de recherche Robert-Sauvé en santé et en sécurité du travail
TRANSLATION Nancy Dunham
This document is available in its entirety in electronic format (PDF) on the Institut national de santé publique du Québec Web site
a
Reproductions for private study or research purposes are authorized by virtue of Article 29 of the Copyright Act. Any other use must be authorized by the Government of Québec, which holds the exclusive intellectual property rights for this document. Authorization may be obtained by submitting a request to the central clearing house of the Service de la gestion des droits
d’auteur of Les Publications du Québec, using the online form
sending an e-mail t
Information contained in the document may be cited provided that the source is mentioned.
LEGAL DEPOSIT –1st QUARTER 2012
BIBLIOTHÈQUE ET ARCHIVES NATIONALES DU QUÉBEC
LIBRARY AND ARCHIVES CANADA
ISBN:978-2-550-60930-8(FRENCH PRINTED VERSION) ISBN:978-2-550-60931-5(F PDF)
ACKNOWLEDGEMENTS
This document is the result of the synthesis of the studies generated by the surveillance program for asbestos exposures and their related diseases, overseen by the Institut national de santé publique du Québec (INSPQ), and of independent studies, published between 2003 and 2009, that dealt with the subject of asbestos in Québec.
We wish to thank the authors of these works, without whom it would not have been possible to prepare this portrait of the state of knowledge on the asbestos situation in Québec.
We also wish to thank Doctor Maurice Poulin from the INSPQ for the revision of the report and Ms. Tricia Jocelyn for the layout of the document.
SUMMARY
This document reports on the Québec data acquired since 2003 on asbestos exposure and asbestos-related diseases, both among workers and in the general population. However, the aim is not to update the knowledge on asbestos as such. This report also summarizes the status of the Québec surveillance system for asbestos exposures and asbestos-related diseases, which will be introduced by the Institut national de santé publique du Québec (INSPQ), as a result of the adoption of the Policy concerning the increased and safe use of chrysotile asbestos in Québec.
The most recent data (2004) on environmental exposure to asbestos in outdoor air identified no asbestos fibres in Montréal and in the city of Québec. However, in Thetford Mines, the average airborne asbestos concentration was 0.0043 fibre/ml (f/ml) by transmission electron microscopy (TEM). This concentration was 215 times higher than that obtained in the air outside buildings involved in litigation regarding the removal of asbestos-containing materials (ACM) in the United States. Between 1998 and 2005, in the city of Asbestos, average concentrations ranged from 0.003 to 0.007 f/ml, although we do not know if these were of asbestos fibres, since the analytic method was not specified.
No publication later than the year 2000 has been found on the exposure levels of asbestos miners in the areas of Thetford Mines and Asbestos.
With respect to the industrial sector, at the end of 2009, nine Québec factories were identified in which asbestos was used in the manufacturing process or in which workers handled asbestos-containing products. None of the factories used asbestos safely in accordance with one or more criteria defined a priori. These findings show the importance of exposure surveillance among workers in these workplaces.
Material characterization data obtained in 2009 were collected at high-risk construction sites. Of the 2,475 samples that contained asbestos, 75% contained chrysotile only, 15% chrysotile in the presence of other types of asbestos fibre and 10% amphiboles only (i.e. the asbestos family that excludes chrysotile). In another study, 1,251 material samples contained amphiboles only and 10,538 other samples chrysotile alone (95%) or a mix of chrysotile and amphiboles (5%). Therefore, we find chiefly chrysotile in the on-site materials in the buildings studied.
Of the 3,000 air samples collected during work on high-risk construction sites, 43% had concentrations higher than or equal to 1 f/ml, which is the occupational exposure limit value for chrysotile asbestos in Québec. These results show the importance of enforcing the exposure control measures prescribed in the regulations. Of the 2,626 air samples collected in changing rooms on construction sites, during asbestos removal work, 77% had fibre concentrations equal to or higher than 0.01 f/ml compared to 14% in adjacent areas (0.01 f/ml is the threshold level required by regulation before dismantling the sealed enclosures within which demolition work takes place).
with an average annual growth rate of 3.6%. At the regional level, the standardized incidence rates for pleural mesothelioma were significantly higher among men and women in the Chaudière-Appalaches region, and among men in the Montérégie and Lanaudière regions. Between 1982 and 2002, 170 Quebeckers were diagnosed with a peritoneal mesothelioma (98 men and 72 women).
Between 1992 and 2004, 2,072 people (1,993 men and 79 women) were hospitalized with first mention of asbestosis as the primary or secondary diagnosis. Significant excess hospitalizations for asbestosis were observed among men and women in the Chaudière-Appalaches region and among men in the Estrie and Lanaudière regions.
An estimation of lung cancer and mesothelioma risk among residents in the city of Thetford Mines was carried out using two approaches, one based on the Berman and Crump model and the other on the guidelines of the Ministère de la Santé et des Services sociaux. Depending on the approach used, the lifetime excess mortality for these two cancers ranged from 8.2 to 125 per 100,000 persons residing in Thetford Mines with a continuous lifetime exposure to asbestos.
Few studies have documented asbestos-related diseases among Québec workers. A 2009 publication described all new cases of asbestos-related diseases recognized as occupational lung diseases by the Comité spécial des maladies professionnelles pulmonaires (CSMPP- special committee on occupational lung diseases) between 1988 and 2003. During this period, 1,348 workers had 1,512 diseases. The workers were chiefly exposed in the construction industry and in the maintenance and repair of asbestos-containing products or structures (49.4%), thereby surpassing the number of workers exposed in mines (29.1%). Mesothelioma and asbestosis cases recognized as occupational diseases by the CSMPP represent respectively 21.4% of pleural mesothelioma cases registered in the Fichier des Tumeurs du Québec (tumour registry) and 35% of persons hospitalized with mention of asbestosis registered in the MED-ÉCHO system (Maintenance et exploitation des données pour l’étude de la clientèle hospitalière - maintenance and use of data for the study of the hospital clientele).
With respect to asbestos exposure, the surveillance system to be introduced by the INSPQ will prioritize exposure surveillance of miners, workers who transform and process asbestos and construction workers, and the surveillance of environmental exposure to asbestos in the cities of Thetford Mines and Asbestos.
With respect to disease surveillance, the system will prioritize the surveillance of asbestosis, pleural and peritoneal mesothelioma and asbestos-related lung cancer, which are notifiable diseases since 2003. As these diseases are under-reported, a pilot study with the aim to facilitate the reporting of these notifiable diseases by physicians will be introduced in two Québec hospitals. If the pilot study proves effective in identifying and reporting cases, this approach, which requires the collaboration of medical archives departments, would be proposed in all Québec hospitals.
TABLE OF CONTENTS
LIST OF TABLES ... IX LIST OF FIGURES ... XI LIST OF ABBREVIATIONS ... XIII
1 INTRODUCTION... 1
1.1 Mandate ... 1
1.2 Objectives ... 1
2 ASBESTOS ... 3
2.1 Asbestos fibres ... 3
2.2 History of asbestos in Canada... 3
2.3 Measurement techniques for airborne asbestos fibres ... 3
2.4 Asbestos exposure limits and criteria in Québec ... 4
3 ASBESTOS EXPOSURE IN THE GENERAL POPULATION OF QUÉBEC ... 5
3.1 Exposure sources in the mining regions ... 5
3.2 Asbestos concentrations in outdoor air ... 5
3.2.1 City of Asbestos ... 5
3.2.2 Cities of Thetford Mines, Tring-Jonction, Montréal and Québec ... 5
3.2.3 Comparison of concentrations measured in Thetford Mines with those obtained in other cities ... 6
3.2.4 Asbestos concentrations in outdoor air in the city of Thetford Mines close to yards and alleys filled with asbestos tailings ... 7
3.3 Asbestos concentrations in indoor air ... 8
3.3.1 City of Thetford Mines ... 8
3.3.2 Comparison of concentrations measured in Thetford Mines with those measured in other settings ... 8
4 ASBESTOS EXPOSURE IN THE QUÉBEC WORKPLACE ... 11
4.1 Mining sector ... 11
4.2 Industrial sector ... 11
4.2.1 Criteria that define a safe use of asbestos in the Amiante/Secteurs industriels project ... 11
4.2.2 Industrial sectors and factories that use or process asbestos in Québec ... 11
4.3 Construction industry ... 13
4.3.1 Exposure data sources at high-risk construction sites ... 13
4.3.2 Exposure determinants in buildings involving high-risk work... 14
4.3.3 Exposure intensity by tasks performed at high-risk construction sites ... 18
4.3.4 Non-compliance notices issued by the CSST between 2004 and 2008 concerning asbestos construction sites ... 18
4.3.5 Exposure during repair and removal of asbestos-containing asphalt ... 19
5 ASBESTOS HEALTH EFFECTS ON THE GENERAL POPULATION OF
QUÉBEC ... 23
5.1 Mesothelioma ... 23
5.1.1 Data sources ... 23
5.1.2 Incidence between 1982 and 2002 ... 23
5.1.3 Pleural cancer mortality between 1981 and 2003 ... 32
5.2 Asbestosis ... 34
5.2.1 Data sources ... 34
5.2.2 Incidence of hospitalizations with first mention of asbestosis between 1992 and 2004 ... 35
5.2.3 Asbestosis mortality between 1981 and 2003 ... 35
6 ESTIMATION OF HEALTH RISKS FROM ENVIRONMENTAL EXPOSURE TO ASBESTOS IN QUÉBEC ... 37
6.1 Approaches used to assess risk ... 37
6.2 Determination of lifetime excess risk ... 38
6.2.1 Using the methodology proposed in the MSSS guidelines ... 38
6.2.2 Using the Berman and Crump model ... 38
6.2.3 Comparison with the estimated risk in other settings ... 39
6.2.4 Cautious interpretation of the results ... 39
7 ASBESTOS HEALTH EFFECTS ON QUÉBEC WORKERS ... 41
7.1 New cases of occupational lung diseases: 1988-2003 ... 41
7.1.1 Study population ... 41
7.1.2 General description ... 41
7.1.3 Distribution of workers by sectors/occupations ... 42
7.1.4 Distribution of workers by occupation categories ... 44
7.2 Asbestos-related deaths accepted by the CSST from 2005 to 2008 ... 44
7.3 Evaluation of the effects of the asbestosis screening program among construction workers in the Montérégie ... 46
7.3.1 Asbestosis screening ... 46
7.3.2 Evaluation of the screening program’s information component ... 47
8 MATCHING AND COMPARISON OF DATA FROM VARIOUS SOURCES ... 51
8.1 Mesothelioma ... 51
8.2 Asbestosis ... 51
9 SURVEILLANCE SYSTEM FOR ASBESTOS EXPOSURE AND ASBESTOS-RELATED DISEASES ... 53 9.1 Exposure component ... 53 9.1.1 Mining industry ... 54 9.1.2 Industrial sector ... 54 9.1.3 Construction industry ... 55 9.1.4 Other workplaces ... 58 9.1.5 Outdoor environment ... 58
9.2 Asbestos-related diseases component ... 59
9.2.1 Objects of surveillance and data sources selected ... 59
9.2.2 Use of the MADO-Chimique system for future surveillance ... 60
9.2.3 Indicators ... 61
9.3 Evaluation component ... 61
10 CONCLUSION ... 63
REFERENCES ... 65
APPENDIX A HIGHLIGHTS ... 69
APPENDIX B ADDITIONAL RESULTS. STUDY OF NEW CASES OF ASBESTOS-RELATED OCCUPATIONAL LUNG DISEASES IN QUÉBEC: 1988-2003 ... 77
LIST OF TABLES
Table 1 Comparison of asbestos fibre concentrations (f/ml) measured by transmission electron microscopy in the outdoor air of Thetford Mines
with other settings ... 7
Table 2 Comparison of concentrations in PCMe fibres/ml and in structures/ml reported in residences in the city of Thetford Mines with those reported in indoor air in four other studies ... 10
Table 3 Distribution of Québec plants possibly producing asbestos-containing asphalt by different health and social service regions ... 13
Table 4 Materials and air sample distribution by category of buildings ... 14
Table 5 Non-compliance notices issued by the CSST between 2004 and 2008 involving construction sites with asbestos ... 19
Table 6 Distribution of asbestos-containing materials (ACM) in the ACM-supplier database by class of ACM in the three main supplier countries ... 21
Table 7 Incidence of pleural cancer, pleural mesothelioma and peritoneal mesothelioma (1982-2002) and hospitalizations with first mention of asbestosis (1992-2004) in Québec ... 24
Table 8 Standardized rates and standardized incidence ratios (SIR) of mesotheliomas (pleura, peritoneum and pericardium), by province and territory (Canada 1993-1997) compared to Québec ... 30
Table 9 Standardized rates and standardized incidence ratios (SIR) of mesotheliomas (pleura, peritoneum and pericardium), among men by country (1993-1997) compared to Québec ... 31
Table 10 Standardized rates and standardized incidence ratios (SIR) of mesotheliomas (pleura, peritoneum and pericardium), among women by country (1993-1997) compared to Québec ... 32
Table 11 Pleural cancer and asbestosis mortality for the period from 1981 to 2003 in Québec ... 33
Table 12 Estimated lifetime mortality risk based on unit risks per 100,000 persons in the city of Thetford Mines with a continuous lifetime exposure to asbestos fibres ... 38
Table 13 Asbestos-related diseases by sector/occupation. Comité spécial des maladies professionnelles pulmonaires, 1988-2003... 43
Table 14 Deaths accepted by the CSST by cause of death and year ... 45
Table 15 Deaths caused by asbestos by economic activity sector ... 45
Table 16 Deaths caused by asbestos by worker’s age at time of death ... 46
Table 17 Results of available asbestosis screening chest X-rays by region ... 47
Table 18 Participation in the components of the asbestosis screening program among construction workers in the Montérégie, Laval and Lanaudière regions carried out in 2006 and 2007 ... 48
LIST OF FIGURES
Figure 1 Average percentage of asbestos by structure ... 15
Figure 2 Distribution of samples containing chrysotile or amosite by structures ... 15
Figure 3 Frequency of airborne fibre concentrations (n = 3,000) ... 17
Figure 4 Distribution of fibre densities on membranes (n = 3,000) ... 17
Figure 5 Specific incidence rates by five-year age group (/100,000 person-years) of pleural cancer, pleural mesothelioma and peritoneal mesothelioma among men, Québec, 1982-2002 ... 25
Figure 6 Specific incidence rates by five-year age group (/100,000 person-years) of pleural cancer, pleural mesothelioma and peritoneal mesothelioma among women, Québec, 1982-2002 ... 26
Figure 7 Annual incidence rates (age-standardized/100,000 person-years) of pleural cancer, pleural mesothelioma and peritoneal mesothelioma, Québec, 1982-2002 ... 27
Figure 8 Annual mortality rates (age-standardized/100,000 person-years) for pleural cancer, Québec, 1981-2003 ... 34
Figure 9 Asbestos-related diseases by year of decision by the Comité spécial des maladies professionnelles pulmonaires, 1988-2003... 42
LIST OF ABBREVIATIONS
95% CI 95% confidence interval
ACGIH American Conference of Governmental Industrial Hygienists
ACM Asbestos-containing material
AFSSET Agence française de sécurité sanitaire de l'environnement et du travail (France environmental and occupational health safety agency)
AHERA Asbestos Hazard Emergency Response Act
ANDEVA Association nationale de défense des victimes de l’amiante (France national association for the defence of asbestos victims)
ANOVA Analysis of variance
AVAQ Association des victimes de l’amiante du Québec (asbestos victims association)
CCQ Commission de la construction du Québec (construction commission) CRIQ Centre de recherche industrielle du Québec (industrial research centre) CSMPP Comité spécial des maladies professionnelles pulmonaires (special
committee on occupational lung diseases)
CSP Comité spécial des présidents
CSSS Centre de santé et de services sociaux (health and social service centre) CSST Commission de la santé et de la sécurité du travail (Québec Workers’
Compensation Board)
DCGI Direction de la comptabilité et de la gestion de l’information (accounting and information management department)
FiTQ Fichier des tumeurs du Québec (Québec tumour registry) HEI-AR Health Effects Institute-Asbestos Research
IARC International Agency for Research on Cancer
INSPQ Institut national de santé publique du Québec (Québec public health institute)
IRSST Institut de recherche Robert-Sauvé en santé et en sécurité du travail (occupational health and safety research institute)
JEM Job-exposure matrix
MDDEP Ministère du Développement durable, de l’Environnement et des Parcs (Québec minister of sustainable development, the environment and parks) MED-ÉCHO Maintenance et exploitation des données pour l’étude de la clientèle
hospitalière (maintenance and use of data for the study of the hospital clientele)
MSSS Ministère de la Santé et des Services sociaux (Québec minister of health and social services)
ND Notifiable disease
OSHA Occupational Safety and Health Administration PCMe Phase contrast microscopy equivalent
PCOM Phase contrast optical microscopy
PSSE Programme de santé spécifique à l’établissement (specific health program for an establishment)
RSST Regulation respecting occupational health and safety
SIR Standardized incidence ratio
SISAT Système d’information en santé au travail (occupational health information system)
SMEST Surveillance Médico-environnementale de la Santé des travailleurs
(workers’ health medical-environmental surveillance system)
STEL Short term exposure limit
TEM Transmission electron microscopy
TWA Time-weighted average
US EPA United States Environmental Protection Agency
1
INTRODUCTION
1.1
M
ANDATEFollowing the adoption of the Policy concerning the increased and safe use of chrysotile asbestos in Québec in 2002 (Gouvernement du Québec, 2002), the Ministère de la Santé et des Services sociaux (MSSS) mandate the Institut national de santé publique du Québec (INSPQ) to develop a surveillance system for asbestos exposures and asbestos-related diseases, both among workers and in the general population.
1.2
O
BJECTIVESThis report is a follow-up to documents published in 2003 by the INSPQ that described the state of knowledge on asbestos exposure and asbestos-related diseases in the Québec population (De Guire et al., 2003a; Lajoie et al., 2003).
The report’s objective is to present a concise overview of the studies carried out under the abovementioned system, as well as those conducted independently, between 2003 and 2009, by the INSPQ and by other working groups. It aims to update the portrait of asbestos exposure and its related diseases in Québec while awaiting the completion of the development and implementation of the surveillance system. It is not intended to update the knowledge on asbestos as such. The studies summarized herein are the following:
A.
B. Jumelage des cas de mésothéliome et amiantose reconnus comme maladies professionnelles pulmonaires aux nouveaux cas de cancer et aux hospitalisations avec amiantose (Lebel et al., 2009).
C.
D. Relation entre la teneur en amiante dans les matériaux et la concentration de fibres dans l’air ambiant lors de travaux de démantèlement (Dufresne et al., 2009a).
E. Surveillance de l’exposition à l’amiante dans les métiers de la construction (Beaudry et al., 2008).
F. Presence of asbestos fibres in indoor and outdoor air in the city of Thetford Mines: Estimation of lung cancer and mesothelioma risks (Bourgault & Belleville, 2009).
G. Projet Provincial – Amiante/Secteurs industriels (Huneault, 2008).
H. Évaluation des effets du programme de dépistage de l’amiantose chez les travailleurs de la construction en Montérégie (Cambron-Goulet, 2008).
I. Rapports sur l’échantillonnage des fibres d’amiante dans l’air extérieur de la ville de Thetford Mines à proximité de terrains contenant des remblais d’amiante (Couture & Bisson, 2006; Ministère de l’Environnement du Québec, 2001; Gauthier & Nantel, 2005).
J. Reports by the Service de la statistique of the Direction de la comptabilité et de la gestion de l’information (DCGI) and the Commission de la santé et de la sécurité du travail (CSST) dated February 22, 2010 (L’Épicier, 2010a).
The first three studies (A, B, C) are updates of prior studies carried out by the INSPQ. The next two (D, E) are research studies carried out at the request of the INSPQ by other research teams to document asbestos exposure in the construction industry. Reports F through J, which were conducted by the INSPQ or by other research teams, do not ensue from the abovementioned mandate, but they contain findings that help provide a portrait of the asbestos situation in Québec.
This document also aims to present the status of the surveillance system for asbestos exposures and their related diseases that will be introduced by the INSPQ under its mandate. Most of the studies listed above have contributed new information necessary to set up this system. The highlights of this report are presented in Appendix A.
Finally, a progress report on the implementation of the recommendations made by the Comité aviseur sur l’amiante in 2003 (De Guire & Lajoie, 2003b) and those made by the INSPQ in 2005 (De Guire et al., 2005) will be the topic of a separate publication. That publication will also include new recommendations.
2
ASBESTOS
2.1
A
SBESTOS FIBRESAsbestos is the name given to a group of natural fibrous silicate minerals that are divided into two mineralogical classes: amphiboles and serpentines. There are five types of amphiboles: crocidolite, amosite, anthophyllite, tremolite and actinolite. Chrysotile is the only serpentine and currently represents 95% of the world production of asbestos. Asbestos fibres are used commercially for their high tensile, thermal and even chemical strength, and for their flexibility (Lajoie et al., 2003).
2.2
H
ISTORY OF ASBESTOS INC
ANADAIn 2007, Canada was the world’s fifth largest producer of chrysotile asbestos (Natural Resources Canada, 2007) and this production was concentrated in the cities of Thetford Mines, in the Chaudière-Appalaches region, and Asbestos, in the Estrie region. In Thetford Mines, the Lac d’amiante du Canada open-pit mine in the Black Lake area is still in operation. The underground Bell Mine, active for 130 years, was definitively closed on March 28, 2008 (Bourgault & Belleville, 2009). In Asbestos, the open-pit Jeffrey Mine has operated sporadically in recent years (Dumas, 2010).
Canada has always exported more than 90% of its production abroad. Until 1985, the United States was the largest export market, and then Japan took the lead for the next 10 years. More recently, Southeast Asia and India are the main importers. The annual chrysotile production used in the manufacture of asbestos-containing materials (ACM) in Canada reached its peak between 1955 and 1977 (approximately 50,000 metric tonnes per year). During the same period, Canada annually imported on average 5,000 tonnes of amosite and crocidolite (Beaudry et al., 2008). This explains why the ACM manufactured prior to the 1980s may have contained crocidolite and amosite in addition to chrysotile. Canada also may have imported ACM containing amphiboles.
Since the beginning of the 2000s, Québec reportedly uses 5,000 tonnes of its asbestos production annually. Most of this local consumption is earmarked for the industrial sector, but one-third is used in the production of asbestos-containing asphalt that is spread on the province’s road surfaces (Adib & Perrault, 2009). This represents an increase over past years. In fact, between 1994 and 1997, the Ministère des Transports du Québec (MTQ) used asphalt containing on average 358 tonnes of chrysotile asbestos per year (Ministère des transports du Québec, 1997).
2.3
M
EASUREMENT TECHNIQUES FOR AIRBORNE ASBESTOS FIBRESThe methods most used to measure ambient air asbestos concentrations are phase contrast optical microscopy (PCOM) and transmission electron microscopy (TEM).
PCOM analysis counts the total number of fibres, but does not determine their nature, that is to say it does not distinguish an asbestos fibre from a cellulose fibre, for example. This
nature of the predominant fibres found there is known a priori (Bourgault & Belleville, 2009). Since the magnification obtained by this technique is low (400 to 500 times), fibres of a diameter less than 0.25 µm are not detected. The fibre counting protocol used in Québec counts fibres longer than 5 µm, with a diameter less than 3 µm and with a length: diameter ratio greater than 3:1 (IRSST, 1995). Since all types of fibres are counted, the actual asbestos fibre concentration may be overestimated, particularly in settings where fibres other than asbestos are found.
TEM analysis distinguishes asbestos fibres from other types of fibres and asbestos fibres from one another. It is therefore the preferred method to measure asbestos concentrations in outdoor air and in indoor air in non-occupational settings. As well, its high magnification (10,000 times) displays fibres with a very small diameter (up to 0.2 nm) (Bourgault & Belleville, 2009).
Concentrations are expressed in fibre per millilitre (f/ml; equivalent to f/cm3) for PCOM. For TEM, they are expressed either in f/ml or electron fibre per millilitre (ef/ml), or in optical equivalent (or phase contrast microscopy equivalent (PCMe)), which is to say by counting the fibre concentrations according to the PCOM counting criteria (Bourgault & Belleville, 2009).
2.4
A
SBESTOS EXPOSURE LIMITS AND CRITERIA INQ
UÉBECThe time-weighted average (TWA) corresponds to the average concentration permissible in the workplace, weighted on the basis of 8 hours per day, 40 hours per workweek. The short-term exposure limit (STEL) is a 15-minute time-weighted average concentration that should not be exceeded during a workday. Since 1990, in Québec, the TWA and the STEL are respectively 1 f/ml and 5 f/ml for chrysotile, tremolite, anthophyllite and actinolite. For crocidolite and amosite, the TWA and the STEL are respectively 0.2 f/ml and 1 f/ml (Gouvernement du Québec, 2009a). These values are based on a PCOM count.
The Québec exposure limit for chrysotile of 1 f/ml is relatively high compared to exposure limits elsewhere, notably in Ontario (Ontario, 1990), the United States (ACGIH, 2009) and France (INRS, 2007) where it is 0.1 f/ml. Moreover, the Agence française de sécurité sanitaire de l'environnement et du travail (AFSSET) published an advisory on August 7, 2009 that recommended lowering the French exposure limit to 0.01 f/ml, as the Netherlands and Switzerland had already done (AFSSET, 2009).
With respect to asbestos fibre concentrations in ambient air, the Ministère du Développement durable, de l’Environnement et des Parcs (MDDEP) retained a provisional air quality criterion in Québec of 0.04 f/ml. This matches the air quality criterion for asbestos established in Ontario in 1976. It is based on a 95% probability of a less than 1% risk of developing clinical evidence of asbestosis. The analysis method on which this provisional criterion is based is not specified (TEM or PCOM). The city of Montréal adopted an ambient air quality standard for asbestos set at 0.05 f/ml, under Règlement 90 of the Communauté urbaine de Montréal. However, the bases for this standard are not specified. Finally, the MSSS defined a criterion for the management of ACM in public buildings of 0.01 f/ml, to identify situations that require immediate preventive measures. This criterion is not based on health effects (Bourgault & Belleville, 2009).
3
ASBESTOS EXPOSURE IN THE GENERAL POPULATION OF
QUÉBEC
3.1
E
XPOSURE SOURCES IN THE MINING REGIONSThe main possible sources of airborne asbestos fibres in mining towns are ore extraction and mine tailings. Mine tailings are sent to accumulation sites and can be used as landfill (Lajoie et al., 2003; Ministère de l’Environnement du Québec, 2001) or as road abrasives (Veillette, 2010).
In Thetford Mines and in Asbestos, several tailings dumps are present close to inhabited, commercial and industrial areas. In Asbestos, the tailings dumps are concentrated around the mine. Reportedly, 10% of the tailings dumps in this city are covered by vegetation (Gagnon, 2010), while this is apparently not the case in Thetford Mines (Veillette, 2010). In Thetford Mines, certain of these accumulation areas are still active. Mine tailings are used as landfill on public and private land in this city. In addition, they are used as road abrasives, but the extent of these practices is not known. Municipal authorities have indicated that the use of asbestos-containing abrasives would be reduced (Veillette, 2010). It has not been possible to learn if accumulation areas are still active in Asbestos, but mine tailings are apparently not used as landfill or as abrasives (Gagnon, 2010). Finally, in Thetford Mines, all-terrain vehicle use on tailings dumps is not completely controlled (Veillette, 2010). In Asbestos, all-terrain vehicle use is restricted to marked sand-covered trails (Gagnon, 2010). To our knowledge, the contribution of this practice to ambient concentrations of asbestos fibres has not been documented.
3.2
A
SBESTOS CONCENTRATIONS IN OUTDOOR AIR3.2.1 City of Asbestos
The Jeffrey Mine took air samples at nine stations in the city of Asbestos between 1998 and 2005. The reported average annual fibre concentrations ranged from 0.003 to 0.007 f/ml depending on the sampling site (range: 0.001 to 0.011 f/ml). However, the analytic method used (TEM or PCOM) was not stated (Deacon, 2005).
3.2.2 Cities of Thetford Mines, Tring-Jonction, Montréal and Québec
In 2004, the MDDEP measured ambient levels of asbestos fibres at six stations located in the following four municipalities: Thetford Mines (two sites), Tring-Jonction, Montréal (two sites) and Québec (Bourgault & Belleville, 2009). These data were collected in connection with the Policy concerning the increased and safe use of chrysotile asbestos in Québec. The two stations in Thetford Mines were located under the prevailing winds, one near the mine and mill and the other a bit further downwind. The station in Tring-Jonction, a community close to Thetford Mines, served to characterize a setting located near an inactive tailings dump. The stations in Montréal and the city of Québec represented either a downtown urban setting or a neighbourhood with heavy road traffic. The samplings, carried
out over 24 hours, were collected in samplers placed on the roofs of public buildings (Bisson & Couture, 2007).
The 125 samples obtained at the two stations in Thetford Mines were analyzed by PCOM. The fibre concentrations ranged from < 0.0015 to 0.056 f/ml. Seven samples with the highest values were also analyzed by TEM. The asbestos fibre concentrations obtained by this method ranged from < 0.0006 to 0.0082 f/ml with an average of 0.0043 f/ml (Bourgault & Belleville, 2009).
The 58 samples from the Tring-Jonction station measured by PCOM had fibre concentrations that ranged from < 0.0015 to 0.0078 f/ml, while the two samples analyzed by TEM were all below the detection limit of the method (< 0.0006 f/ml) (Bourgault & Belleville, 2009). According to the authors, this suggests that the inactive tailings dumps are not a significant source of asbestos fibres in the ambient air in the area (Bisson & Couture, 2007).
The situation was similar for the stations in Montréal and the city of Québec because the fibre concentrations obtained by PCOM analysis (n = 116) were very low (< 0.0015 to 0.0054 f/ml), while TEM analyses (n = 5) did not permit the identification of asbestos fibres (Bourgault & Belleville, 2009).
3.2.3 Comparison of concentrations measured in Thetford Mines with those obtained in other cities
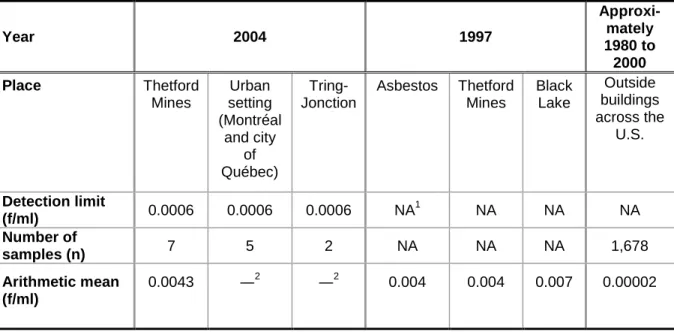
In a study published in 2009 by the INSPQ, the average asbestos fibre concentration obtained by the MDDEP following TEM analysis, in Thetford Mines, in 2004 (0.0043 f/ml) was compared to concentrations obtained in 1997 in the cities of Thetford Mines, Black Lake and Asbestos at seven sampling stations. The levels measured in 1997 were relatively comparable to those measured in 2004 in Thetford Mines. Subsequently, the same average concentration obtained by the MDDEP in Thetford Mines in 2004 was compared to the results of outdoor air samplings from around buildings involved in litigation regarding ACM abatement in the United States. The average concentration obtained in Thetford Mines, like that measured in Asbestos in 1997 (0.004 f/ml), was 215 times higher than that obtained outside buildings across the United States (Bourgault & Belleville, 2009) (Table 1).
Table 1 Comparison of asbestos fibre concentrations (f/ml) measured by transmission electron microscopy in the outdoor air of Thetford Mines with other settings
Year 2004 1997 Approxi-mately 1980 to 2000 Place Thetford Mines Urban setting (Montréal and city of Québec) Tring-Jonction Asbestos Thetford Mines Black Lake Outside buildings across the U.S. Detection limit (f/ml) 0.0006 0.0006 0.0006 NA 1 NA NA NA Number of samples (n) 7 5 2 NA NA NA 1,678 Arithmetic mean (f/ml) 0.0043 ―2 ―2 0.004 0.004 0.007 0.00002 1
NA: Information not available.
2
All the results obtained are below the detection limit. Source: Bourgault and Belleville, 2009.
3.2.4 Asbestos concentrations in outdoor air in the city of Thetford Mines close to yards and alleys filled with asbestos tailings
In 1999, a working group comprising representatives of the Ministère de l’Environnement du Québec, the MSSS, the INSPQ and the Direction de santé publique de Chaudière-Appalaches was created in order to assess whether there is a potential risk associated with yards and alleys filled with asbestos tailings. To support this risk assessment, an air quality measurement campaign was organized in the city of Thetford Mines in the summer of 2000. Samples were taken close to a schoolyard and a community centre, one metre above the ground, in order to assess the exposure of the most sensitive population: the children. These stations were selected to represent settings affected chiefly by asbestos landfill rather than by the tailings dumps located on the city outskirts. The asbestos fibre sampling was carried out only once at each station at a time when mining activity was minimal and when there was no schoolyard activity. The results obtained by TEM were compared to those of the two control stations located in a more rural area of the Thetford Mines municipality and in a parking lot in the city of Laval. No chrysotile asbestos fibres were detected in the two control samples. However, concentrations of 0.0004 f/ml and 0.0008 f/ml were measured at the school and the community centre respectively (Ministère de l’Environnement et de la Faune, 2000). Since this exposure is higher than that observed in the ambient air of large North American cities, it was then recommended to limit exposure by covering the fill with a non-contaminated material (Ministère de l’Environnement du Québec, 2001; Gauthier & Nantel, 2005).
In 2005, the working group replicated the ambient air sampling that had been carried out in Thetford Mines in the summer of 2000. Air samples were taken at a height ranging from one to two metres above the ground at the same sampling sites used in 2000 except for the Laval test site. As in 2000, samplings were done when mining activity was minimal and the analyses were performed by TEM. However, contrary to the first sampling campaign, the samples were taken during normal school activities and under more frequent wet weather conditions. No asbestos fibres were identified in the samples taken at the three different stations in 2005 (Couture & Bisson, 2006). The rainy conditions might have downwardly influenced exposure levels, which makes comparison with the 2000 sampling difficult. Were it not for these wet conditions and the limited number of samples, fibre concentrations above the detection limit might have been observed. Thus, the recommendation was upheld to exercise the precautionary principle by covering the fill with a non-contaminated material (Gauthier & Nantel, 2005).
3.3
A
SBESTOS CONCENTRATIONS IN INDOOR AIR3.3.1 City of Thetford Mines
In 2003 and in 2004, the Association des victimes de l’amiante du Québec (AVAQ) assessed indoor air asbestos concentrations in 26 residences in the city of Thetford Mines. Dwellings were selected based on their location with respect to tailings dumps. Most of them (24/26) were located within a radius less than or equal to two kilometres from the tailings dumps (Bourgault & Belleville, 2009).
The analyses carried out by TEM identified the presence of asbestos fibres in 15 of the 26 houses sampled. Most of these were chrysotile fibres, but one actinolite fibre was identified in two residences and one tremolite fibre in three residences. The concentrations measured ranged from < 0.000553 to 0.010 PCMe fibre/ml (n = 26). The arithmetic mean calculated from these results, but replacing the values smaller than not detected by zero, is 0.0018 PCMe fibre/ml. The results were also presented in structures/ml (s/ml). According to the protocol established in the Asbestos Hazard Emergency Response Act (AHERA), each single asbestos fibre that conforms to the counting criteria is counted as a structure, just as is any bundle, cluster or matrix that has at least one asbestos fibre meeting the criteria. The concentrations measured using this protocol (n = 28) ranged from < 0.004 to 0.311 s/ml with an arithmetic mean of 0.051 s/ml (Bourgault & Belleville, 2009) (Table 2).
3.3.2 Comparison of concentrations measured in Thetford Mines with those measured in other settings
In a study published in 2009 by the INSPQ, asbestos concentrations measured in indoor air in residences in the city of Thetford Mines were compared to those obtained by TEM in four studies having comparable sampling protocols and analytic methods (Bourgault & Belleville, 2009).
The first of the four studies, conducted at the end of the 1990s, aimed to measure asbestos fibre concentrations inside 17 Québec schools containing ACM. These schools were selected based on the presence of ACM with a high percentage of asbestos, an average to
high asbestos friability and a significant level of degradation of sprayed asbestos (Bourgault & Belleville, 2009).
In the second study that was carried out in the week following the events at the World Trade Center (WTC) in 2001, the authors sampled air inside two apartments affected by the dust cloud from the destruction of the two towers and thereby determined their degree of asbestos contamination (Bourgault & Belleville, 2009).
The third study carried out by the United States Environmental Protection Agency (US EPA) in 2002 aimed to characterize the urban background level of asbestos in Upper Manhattan in New York City by sampling airborne asbestos inside 62 apartments and common areas of 14 residential buildings (Bourgault & Belleville, 2009).
Finally, researchers in the fourth study measured airborne asbestos present in buildings across the United States involved in litigation regarding ACM abatement. During the period of their study (more than 20 years), these researchers took air samples in 317 schools, 234 public and commercial buildings and 5 residences (Bourgault & Belleville, 2009).
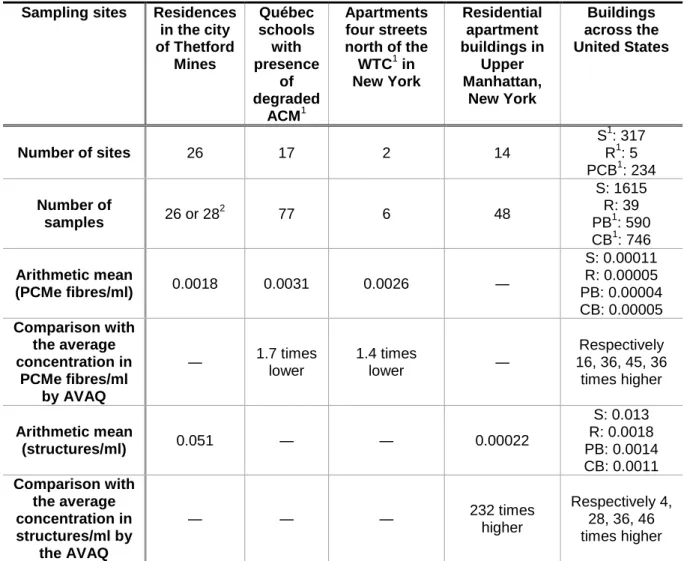
The average asbestos fibre concentration measured in residences in the city of Thetford Mines (0.0018 PCMe fibre/ml) is 1.7 and 1.4 times lower than that observed respectively in 17 Québec schools (0.0031 PCMe fibre/ml) and in two apartments affected by dust from the collapse of the WTC towers (0.0026 PCMe fibre/ml). However, it is 16 to 45 times higher than the concentrations reported in schools (0.00011 PCMe fibre/ml), residences (0.00005 PCMe fibre/ml), public buildings (0.00004 PCMe fibre/ml) and commercial buildings (0.00005 PCMe fibre/ml) across the United States (Bourgault & Belleville, 2009).
When expressed in structures/ml, the average concentration obtained by the AVAQ (0.051 s/ml) is 4 to 232 times higher than the concentrations observed in the buildings sampled across the United States and in the apartments of Upper Manhattan in New York City (Bourgault & Belleville, 2009) (Table 2).
Table 2 Comparison of concentrations in PCMe fibres/ml and in structures/ml reported in residences in the city of Thetford Mines with those reported in indoor air in four other studies
Sampling sites Residences in the city of Thetford Mines Québec schools with presence of degraded ACM1 Apartments four streets north of the WTC1 in New York Residential apartment buildings in Upper Manhattan, New York Buildings across the United States Number of sites 26 17 2 14 S1: 317 R1: 5 PCB1: 234 Number of samples 26 or 28 2 77 6 48 S: 1615 R: 39 PB1: 590 CB1: 746 Arithmetic mean (PCMe fibres/ml) 0.0018 0.0031 0.0026 ― S: 0.00011 R: 0.00005 PB: 0.00004 CB: 0.00005 Comparison with the average concentration in PCMe fibres/ml by AVAQ
― 1.7 times lower 1.4 times lower ― 16, 36, 45, 36 Respectively
times higher Arithmetic mean (structures/ml) 0.051 ― ― 0.00022 S: 0.013 R: 0.0018 PB: 0.0014 CB: 0.0011 Comparison with the average concentration in structures/ml by the AVAQ
― ― ― 232 times higher Respectively 4, 28, 36, 46
times higher 1
ACM: asbestos-containing materials; WTC: World Trade Center; S: schools; R: residences; PCB: public and commercial buildings; PB: public buildings; CB: commercial buildings.
2 26 samples counted in PCMe fibres/ml or 28 samples counted in s/ml.
4
ASBESTOS EXPOSURE IN THE QUÉBEC WORKPLACE
4.1
M
INING SECTORNo publication later than the year 2000 has been found on the exposure levels of asbestos miners in the areas of Thetford Mines and Asbestos.
4.2
I
NDUSTRIAL SECTORAs part of the Policy concerning the increased and safe use of chrysotile asbestos in Québec, a provincial project called Amiante/Secteurs industriels was initiated in 2005. The objective was to ensure a safe use of asbestos in factories that use or process asbestos in their manufacturing operations (Huneault, 2008).
4.2.1 Criteria that define a safe use of asbestos in the Amiante/Secteurs industriels project
The committee responsible for the project began by establishing the criteria that define a safe use of asbestos. These criteria, all drawn from the Regulation respecting occupational health and safety of Québec (RSST), are the following:
a) Presence of double changing room (RSST Section 67). b) Use of protective suit (RSST Section 63).
c) Local ventilation at stationary work stations (RSST Section 107).
d) Annual measurements of work environment by the employer (RSST Section 43). e) Compliance with the values in Appendix I Part 1 of the RSST (TLV and STEL).
f) To comply with the provisions of RSST Section 42: “substance [to which] exposure shall be reduced to a minimum,” the committee responsible for the project proposes abiding by the recommendation of the American Conference of Governmental Industrial Hygienists (ACGIH) and the Occupational Safety and Health Administration (OSHA) which is a time-weighted average concentration of 0.1 f/ml and an excursion limit of 1 f/ml (Huneault, 2008) based on PCOM analyses.
4.2.2 Industrial sectors and factories that use or process asbestos in Québec
The team responsible for the project targeted eight activity sectors as being the most likely to include factories that use or process asbestos. These sectors are the following:
1) Glove manufacturing 2) Machine shops
3) Transportation equipment industries 4) Shipbuilding and repair
5) Non-metallic minerals: asbestos products 6) Insulation products manufacturing
Each region in Québec established its own list of targeted factories in these activity sectors using the CSST lists. Factories outside these sectors could be added, provided they use or process asbestos in their manufacturing operations. As of December 31, 2007, 968 factories had been retained in the project of which 959 (99%) were visited by the public occupational health network. The use of chrysotile asbestos was identified in the processes of less than 1% of the 959 workplaces visited, or eight factories (Huneault, 2008).
A subsequent Internet search identified a ninth factory that processes asbestos-cement (chrysotile) products. The findings from the nine factories are summarized in the following paragraphs.
The team was unable to assess asbestos exposure in five factories because the work with asbestos or asbestos products occurred only occasionally or was of too short duration. Three of these factories were in the machine shop sector and the two others were asphalt manufacturers (which is in the petroleum and coal products industry). Exposure was assessed in the four other factories: a brake pad manufacturer, a joint gaskets manufacturer, an adhesives manufacturer and an asbestos-cement products processing plant.
None of the nine factories used asbestos in a safe manner in compliance with one or more of the criteria established for the project. Twenty-two workers from the four factories in which exposure was assessed were exposed to levels ≥ 0.1 f/ml. Two of them, who work at the same factory, were exposed to levels higher than the TWA of 1 f/ml for chrysotile, despite the presence of control measures during sample collection. Moreover, other exceedences of the Québec exposure limit were observed in this factory in three sampling sessions spread out over two years. This suggests that the preventive measures used in the factory to reduce workers’ exposure are not effective.
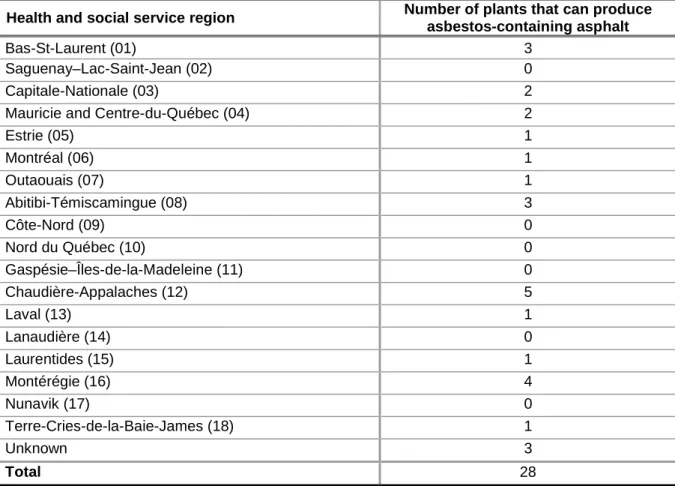
In addition, the Amiante/Secteurs industriels project identified 60 factories of the 959 visited that had asbestos-containing equipment (gloves, mittens and covers) (Huneault, 2008). Finally, in 2010, the MTQ identified 28 plants equipped for the production of asbestos-containing asphalt (Robidas, 2010). For the moment, we have no information on the availability of measurements of workers’ exposure in these plants. Two of them might have been included in the Amiante/Secteurs industriels project because that study had identified two asphalt producers. However, we cannot confirm that these two asphalt plants are among the 28 plants, due to lack of access to the nominative data of the Amiante/Secteurs industriels project. The distribution of the 28 plants in Québec’s health and social service regions is presented in Table 3.
Table 3 Distribution of Québec plants possibly producing asbestos-containing asphalt by different health and social service regions
Health and social service region Number of plants that can produce
asbestos-containing asphalt
Bas-St-Laurent (01) 3
Saguenay–Lac-Saint-Jean (02) 0
Capitale-Nationale (03) 2
Mauricie and Centre-du-Québec (04) 2
Estrie (05) 1 Montréal (06) 1 Outaouais (07) 1 Abitibi-Témiscamingue (08) 3 Côte-Nord (09) 0 Nord du Québec (10) 0 Gaspésie–Îles-de-la-Madeleine (11) 0 Chaudière-Appalaches (12) 5 Laval (13) 1 Lanaudière (14) 0 Laurentides (15) 1 Montérégie (16) 4 Nunavik (17) 0 Terre-Cries-de-la-Baie-James (18) 1 Unknown 3 Total 28 Source: Robidas, 2010.
4.3
C
ONSTRUCTION INDUSTRY4.3.1 Exposure data sources at high-risk construction sites
Before beginning construction work that is liable to release asbestos dust, an employer must identify the types of asbestos present in the materials. At high-risk construction sites,a work is carried out within an airtight enclosure. The employer must collect an air sample at least once per work shift during execution of the work and on completion of the work, but before dismantling the enclosure (Gouvernement du Québec, 2009b). Except as authorized, these samples must be collected in the workers’ breathing zone (Gouvernement du Québec, 2009a). Other air samples may be collected in the areas adjacent to the construction site or in the clean changing rooms, to assess the dust caused by workers moving toward the clean area or to ensure the airtightness of the enclosure.
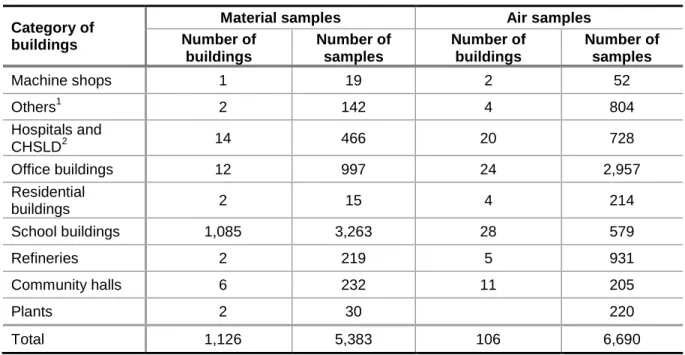
In a study published in 2009, a team from McGill University and the Institut de recherche Robert-Sauvé en santé et en sécurité du travail (IRSST) wanted to better document workers’ exposure to asbestos fibres at high-risk construction sites. The researchers used data that had been collected for the purposes of characterizing materials that might contain asbestos and assessing airborne asbestos fibre concentrations at high-risk construction sites. These data came from the IRSST, from some CSST inspectors, from representatives of the Université de Montréal and McGill University and from some consultants specializing in the management and removal of materials liable to release asbestos dust. The study identified 1,182 buildings of which 1,100 were schools. A total of 5,383 material samples from 1,126 of these buildings were characterized and 6,690 air samples from 106 buildings were analyzed by PCOM (Dufresne et al., 2009a) (Table 4).
Table 4 Materials and air sample distribution by category of buildings
Category of buildings
Material samples Air samples
Number of buildings Number of samples Number of buildings Number of samples Machine shops 1 19 2 52 Others1 2 142 4 804 Hospitals and CHSLD2 14 466 20 728 Office buildings 12 997 24 2,957 Residential buildings 2 15 4 214 School buildings 1,085 3,263 28 579 Refineries 2 219 5 931 Community halls 6 232 11 205 Plants 2 30 220 Total 1,126 5,383 106 6,690 1
Others = transportation, food warehouses and power station.
2
CHSLD: long term care centre. Source: Dufresne et al., 2009a.
4.3.2 Exposure determinants in buildings involving high-risk work
4.3.2.1 Asbestos-containing materials
Among the 5,383 material samples, 54% contained no asbestos fibres. For the 2,475 other samples, 75% contained only chrysotile, 15% contained chrysotile in the presence of another type of fibre (amosite, tremolite, actinolite or crocidolite) and 10% contained only amphiboles (amosite, tremolite or actinolite). In total, 90% of the samples contained chrysotile alone or mixed with amphiboles. Finally, a single sample contained a mix of three types of asbestos fibres, these being chrysotile, amosite and crocidolite (Dufresne et al., 2009a).
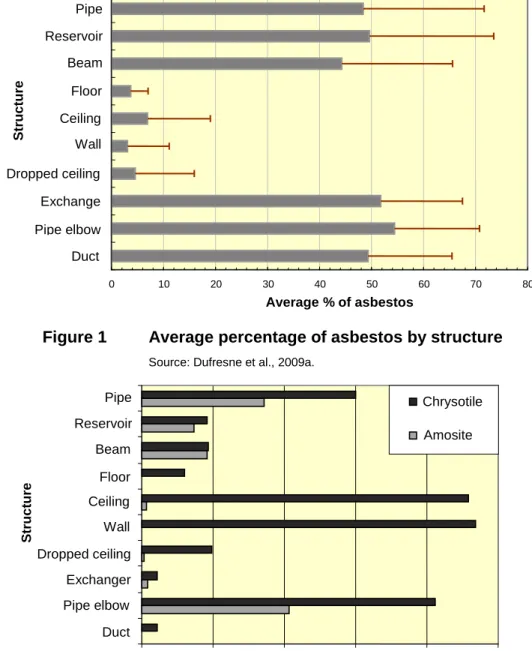
Among the samples for which a description of the materials was available (3,456/5,383), 53% were identified as plaster and 25% as a spraying. In addition, the type of the structure of 48% (n = 2,525) of asbestos-containing samples was identified as wall, floor, pipe, etc. Floors, ceilings, walls and dropped ceilings constitute the structures with the smallest asbestos load (approximately 7% and less). Pipes, reservoirs, beams, exchangers, pipe elbows and ducts contained more than 40% (Figure 1). The samples with chrysotile generally came from ceilings, walls, pipe elbows and floors while amosite was found mainly in pipes and pipe elbows (Dufresne et al., 2009a) (Figure 2).
Figure 1 Average percentage of asbestos by structure Source: Dufresne et al., 2009a.
Figure 2 Distribution of samples containing chrysotile or
0 50 100 150 200 250 Duct Pipe elbow Exchanger Dropped ceiling Wall Ceiling Floor Beam Reservoir Pipe Str u c tu re Number of samples Chrysotile Amosite 0 10 20 30 40 50 60 70 80 Duct Pipe elbow Exchange Dropped ceiling Wall Ceiling Floor Beam Reservoir Pipe Str u c tu re Average % of asbestos
4.3.2.2 Airborne fibre concentrations and exceedence of exposure limits
Of the 6,690 air samples taken in 106 buildings, 45% were collected during work in the asbestos removal area (n = 3,000), 39% in changing rooms (n = 2,623), 9% in adjacent areas (n = 587) and 7% on construction sites after work completion (n = 471). The samples were taken mainly in office buildings and refineries. Since the samples were analyzed by PCOM (Dufresne et al., 2009a), the nature of the fibres they contained is not known.
Construction sites during abatement work
Of the 3,000 air samples collected during abatement work and analyzed by PCOM, 43% (n = 1,294) had concentrations ≥ 1 f/ml which is the exposure limit for chrysotile. Five percent (n = 163) had concentrations higher than 10 f/ml. This concentration is the threshold level in the Safety Code for the construction industry before maximum respiratory protection is required when work is carried out in the presence of crocidolite or amosite. In addition, 14% (n = 404) had concentrations higher than 5 f/ml, the permissible exposure level with a protective factor of 50 for a standardized airborne concentration of 0.1 f/ml according to the ACGIH exposure limit. Only three samples taken in a hospital, a school building and a refinery exceeded 50 f/ml, the maximum value being 96 f/ml (Dufresne et al., 2009a) (Figure 3).
Contrary to the provisions in the Safety Code for the construction industry and the Regulation respecting occupational health and safety, only 3.3% of the samples taken during abatement work were obtained in the workers’ breathing zone. The other samples were taken mainly in an observer’s breathing zone (that is to say, of the technician performing the sampling) (52%) and at stationary work stations (42%). According to the authors, the number of exceedences of the reference values would be larger if more samples had been taken in the workers’ breathing zone (Dufresne et al., 2009a). In fact, other studies have shown that concentrations measured in the workers’ breathing zone were 5 to 10 times higher than those obtained at stationary work stations during dismantling of amosite-containing materials (Dufresne et al., 2009b).
Furthermore, more than half (55%) of the 3,000 samples had a fibre density that did not comply with the optimum densities of 100 to 1,300 f/mm2 recommended by the analytic method utilized (IRSST 243-1) (Figure 4). Fibre densities of 25 to 100 f/mm2 can be taken into consideration in assessing a worker’s exposure, but the method’s coefficient of variation is not known at these densities. Thus, 72% of the densities obtained were between 25 and 1,300 f/mm2, which is an excellent valid sample production rate according to the study’s authors. Although these air samples represent only exposure levels observed at specific times, the number of exceedences observed suggests a potential health risk for workers who work in asbestos removal areas during high-risk work if they do not wear or improperly wear protective gear (Dufresne et al., 2009a). As well, samples collected without complying with the prescribed methods could result in the choice of inadequate respiratory protection to effectively protect workers against asbestos fibre inhalation.
Finally, the variability of the fibre concentrations measured during asbestos removal work was assessed by calculating the geometric standard deviation of the concentration distribution profiles in the rooms for which results were available for at least five samples
(n = 175). More than 52% of the geometric standard deviations calculated were higher than three. This suggests that the fibre concentrations measured vary significantly, thus indicating situations that are out of control (Dufresne et al., 2009a).
Figure 3 Frequency of airborne fibre concentrations (n = 3,000) Source: Dufresne et al., 2009a.
Figure 4 Distribution of fibre densities on membranes (n = 3,000)
Source: Dufresne et al., 2009a.
Construction sites after completion of abatement work
Of the 471 samples collected at construction sites after completion of asbestos abatement and before dismantling of the enclosure, 94% had fibre concentrations below 0.01 f/ml by PCOM. This value corresponds to the threshold level required in the Safety Code for the construction industry before dismantling of the airtight enclosure. However, 73% of the results had a density less than 25 f/mm2, the majority of which had an insufficient sampling
0 763 1706 2596 2837 2997 0 500 1000 1500 2000 2500 3000 3500 < 0.01 < 0.2 < 1 < 5 < 10 < 50 > 50 C o n c e n tr a ti o n (f/ c c ) Number of samples 3 0 620 825 1345 210 0 500 1000 1500 < 0.1 < 25 25-100 100-1300 > 1300 D en si ty ( f/ mm² ) Numbers of samples
Changing rooms and adjacent areas
Among the air samples taken in changing rooms during asbestos removal work and analyzed by PCOM, 77% (2,013/2,616) had fibre concentrations equal to or higher than 0.01 f/ml. This indicates a certain contamination of the rooms that could have been caused by the movements of workers with soiled clothing or by a leak in the enclosure. However, since several types of fibres other than asbestos can coexist in this kind of environment, the use of PCOM could have overestimated the real asbestos fibre concentrations. Furthermore, 46% of the samples had densities less than 25 f/mm2 and 98% of the volumes were less than 1,000 litres, which was not in compliance with the requirements of the IRSST method. This may have resulted in a less reliable assessment of the airborne fibre concentration (Dufresne et al., 2009a).
In the areas adjacent to construction sites involving asbestos removal work, 86% (506/587) of the samples had fibre concentrations below the reference value of 0.01 f/ml. However, since 74% of the samples had sampling densities and volumes below the method’s applicability requirements, data interpretation is thereby limited (Dufresne et al., 2009a).
4.3.3 Exposure intensity by tasks performed at high-risk construction sites
Despite the little data available on the nature of the work being performed when air samples were taken at an asbestos removal site, a variance analysis (ANOVA) allowed for a comparison of the fibre concentration averages for each of the tasks for which information was available (n = 597). Asbestos dust emissions seemed more intense during waste recovery, material removal and demolition tasks than during cleaning, sealing, inspection and multiple tasks (Dufresne et al., 2009a).
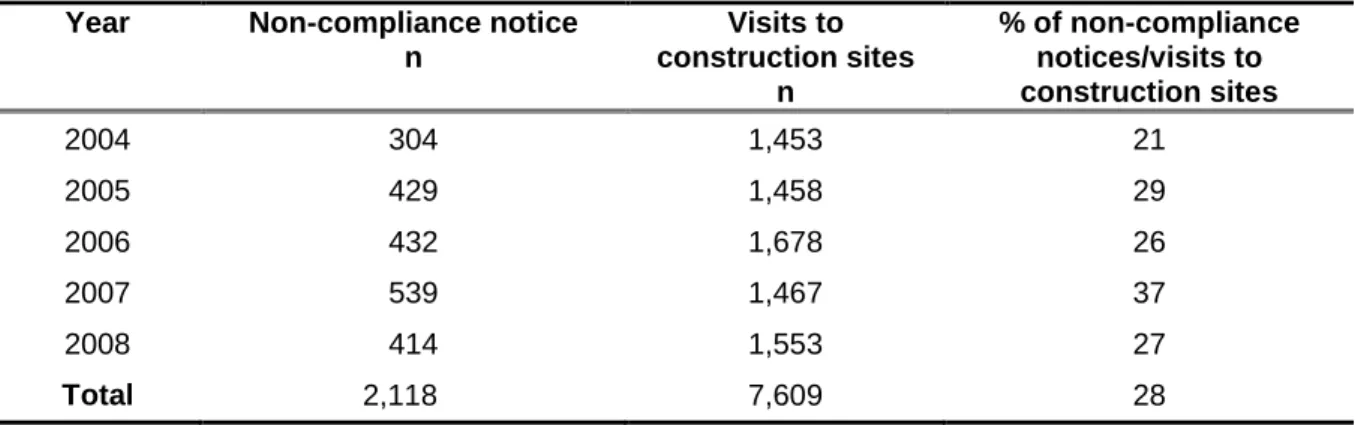
4.3.4 Non-compliance notices issued by the CSST between 2004 and 2008 concerning asbestos construction sites
Non-compliance notices are issued by the CSST for construction sites involving asbestos removal or demolition work, when the methods and procedures utilized do not comply with the provisions of the Safety Code for the construction industry.
CSST inspectors issued non-compliance notices in 21 to 37% of the visits they made, between 2004 and 2008, to construction sites involving work with asbestos (L’Épicier, 2010b) (Table 5). Given the existence of an intervention program in the construction industry since 1998 (CSST, 1998), we might expect a reduction in the percentage of notices issued, but this does not seem to be the case.
Table 5 Non-compliance notices issued by the CSST between 2004 and 2008 involving construction sites with asbestos
Year Non-compliance notice
n Visits to construction sites n % of non-compliance notices/visits to construction sites 2004 304 1,453 21 2005 429 1,458 29 2006 432 1,678 26 2007 539 1,467 37 2008 414 1,553 27 Total 2,118 7,609 28 Source: L’Épicier, 2010.
4.3.5 Exposure during repair and removal of asbestos-containing asphalt
Roadwork that involves the repair and removal of asbestos-containing asphalt is considered a construction site in the Act respecting occupational health and safety (Gouvernement du Québec, 2009c). For that reason, exposure incurred during this work is discussed in this section on the construction industry.
The MTQ uses part of Québec’s asbestos production in the preparation of asbestos-containing asphalt that is laid on some of its road network. According to a study published in 2008 by the Université de Montréal, 145 road stretches in Québec contained asbestos (Beaudry et al., 2008). Cities such as Montréal and Québec have also used asbestos-containing asphalt, but we have no information about the extent.
The only Québec data available on occupational exposure caused by asbestos-containing asphalt come from a 2004 study by the MTQ, the main findings of which are summarized in a literature review published in 2009 by the INSPQ. In the MTQ study, asbestos fibre concentrations in ambient air along a road with asbestos-containing asphalt in the Chaudière-Appalaches region were measured before and during removal of the asphalt (Adib & Perreault, 2009).
The samples taken from along the stretch of road before asphalt removal and analyzed by PCOM ranged from < 0.001 to < 0.004 f/ml (sic). Of the samples taken during removal operations, 20 were collected at stationary stations along the road and 17 at mobile stations, either in the workers’ breathing zone or at stationary stations on the equipment. Half of the air samples at the stationary stations were obtained under relatively high dust conditions due to equipment breakage that affected the wetting system. The arithmetic means of the samples taken during the incident and analyzed by PCOM (0.013 f/ml) were three times higher than those of the samples obtained in the presence of wetting (0.0034 f/ml). The samples collected at the mobile stations in the breathing zone of the various workers (n = 11) and analyzed by PCOM had concentrations ranging from < 0.09 to < 0.49 f/ml (sic), while at stationary stations on the equipment (n = 6), the concentrations ranged from < 0.09 to
< 0.90 f/ml (sic). Actinolite was present in three of the five samples collected at mobile stations and analyzed by TEM (Adib & Perreault, 2009).
4.3.6 Tools to document asbestos exposure in the construction industry
A research team from the Université de Montréal has developed new tools to contribute to knowledge on the exposure of Québec construction workers (Beaudry et al., 2008). These tools are described in this section.
4.3.6.1 Inventory of ACM and their suppliers
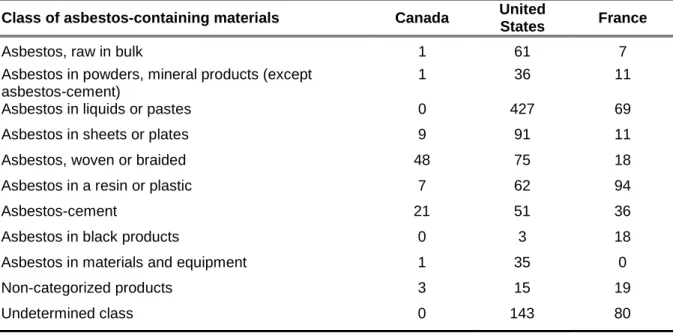
The team produced an inventory of the commercial names of ACM and the business names of their suppliers, using various sources of information, including a systematic documentation search on asbestos-containing products. In addition, the team examined the current list of products made and distributed in Québec, prepared by the Centre de recherche industrielle du Québec (CRIQ), and its prior hard copy versions. This inventory identified 1,461 ACM that were classified and matched to their 576 suppliers. Most of the suppliers were located in Canada (48%), the United States (30%) and France (16%). The ACM of the three main supplier countries are divided into 11 classes (10 classes based on those of the Association nationale de défense des victimes de l’amiante (ANDEVA) in France and one undetermined class) (Beaudry et al., 2008) (Table 6).
The type of asbestos was not specified for 87% of the ACM. The concentration was available for only 27 of the ACM listed, all classified in the “Asbestos, woven or braided” class and composed of chrysotile (Beaudry et al., 2008).
According to the researchers, this inventory could be the largest ever made, but it is not exhaustive. As well, the ACM listed in it have not necessarily all been used in Québec (Beaudry et al., 2008).
This inventory was compiled in the form of a relational database that the INSPQ plans to put online to make it accessible to stakeholders.