AUDIOLOGY PRACTICESnVOL. 5, NO. 4 23
Data Driven
Audiology Practice
Management
by Kathy Foltner, Au.D.
More
than ever before,
audiologists in private
prac-tice find themselves in the
midst of increasing
competi-tion and searching for tools
that will increase practice
success. And, more than
ever before, the profession
of audiology and the hearing
care industry demand
audiol-ogists understand audiology
practice, not only from a
ser-vice, but also from a business
perspective. The most
suc-cessful audiologists
under-stand both clinical audiology
and the business side of an
audiology practice.
Regardless of setting, an audiology practice must be profitable so that it may continue to keep its doors open to serve patients. That means audiology practices must be effectively managed to not only survive, but also to thrive. There are many keys to success, but embracing change, utilizing quality business tools, and proactively managing the practice based on data-driven facts are all criti-cally important to sustainability. The days of allowing a practice to run itself sans active practice management are gone.
There are countless ways in which audiology practices differ, including the amount of revenue they generate, whether or not they participate with various third-party payors, the vendors and manufacturers they choose, and whether or not they charge for services. Even with many large differences all audiology practices also have several commonalities. For example, all audiologists should know their costs and hourly breakeven rate. Additionally, audiologists must have a firm grasp of how they will cover their expenses and generate a marginal profit. Today, many audiologists find themselves working harder to generate the same, or even less profit, than they did in prior years. Further, some audiologists find growing their practice year after year extremely grueling. If you find yourself in one of these two situations, this article provides guidance on how to use data in the management of your practice.
It has been said, “If you don’t know where you are going, how will you know when you arrive?” This statement sums up the impor-tance of strategic planning. A strategic plan should assess the full potential of a practice and link the practice’s objectives to the resources and actions that are required to achieve the defined goals and success. A critical part of a good strategic plan is the use of business intelligence, which can be quickly and accurately gathered by computerized systems. In simple terms, business intel-ligence can be any activity, tool, or process that provides clarity and supports quality decision making in your practice. In order to better understand the power of business intelligence, let’s spend some time reviewing the concept of a key performance indicator. Key Performance Indicators (KPIs) are, “a set of quantifiable measures that a company or industry uses to gauge or compare per-formance in terms of meeting strategic and operational goals”.1 Typically, a company or audiology practice establishes its opera-tional goals and then identifies the KPIs that will most impact the practice’s ability to achieve those goals. To set appropriate goals for individual KPI success one can utilize industry benchmarks or best practice data that is provided by professional organizations, vendors and other groups. (Editor’s note: See Kimberly Rawn’s article in the previous issue of Audiology Practices for examples of benchmark-ing best practices.) KPIs should be specific, clear, measureable and monitored or tracked for specific time frames for improvement comparison. The total number of KPIs tracked is less important than choosing KPIs that will provide the right data for making the best decisions about your practice.
Common KPIs in the hearing aid industry include return rate, close rate, exchange rate, binaural rate, average sales price, units sold, technology level dispensed, hearing aid sales of new versus existing patients, and ancillary product sales. It is often said that these hearing aid KPIs drive revenue. This essentially means the better an audiologist acts upon KPI data, the more revenue the practice is likely to generate. The practice KPIs you choose to measure and monitor also play a critically important role in the management of your practice; the amount of revenue generated and collected as well as the overall efficiency of scheduling represent a few of the KPIs you should measure and
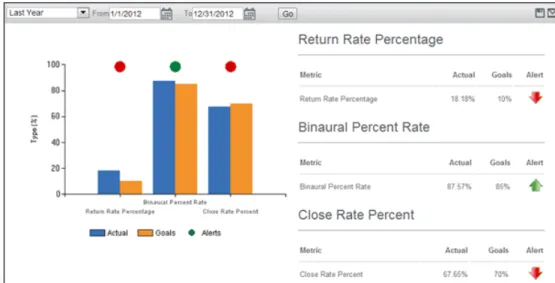
monitor over time. Fortunately, due in large part to computer-ized data management systems, practices can more easily moni-tor and benchmark KPIs. Here is an example of how KPIs can be more effectively man-aged with a computerized dash-board. Figure 1 is a summary of three KPIs with a breakdown of actual performance compared to goal for a specific time frame with a goal alert indicator. This
Figure 1. Quick Stats Practice KPI Summary
To increase efficiency, audiologists can become smarter about their practice business decisions and embrace tools that are available to assist with practice management and profit generation. Additionally, practitioners, regardless of setting, must let go of their fear of numbers and employ data-driven practice management, including utilization of tools to better understand their practice KPIs and how to use them to make decisions, which result in increased profitability. Practice numbers and KPIs always tell a story and with a little training, any audiologist can understand the story and quickly identify practice strengths and weaknesses. Once the facts are identified, it is relatively easy to maintain what you are doing well and focus on improving specific practice weaknesses. According to Bojorquez (2013), the KPI Cycle includes five steps: 1. Define the core business strategy and objective; 2. Determine KPIs to track: define thresholds and indicate degrees of success; 3. Measure performance over time; 4. Adjust tactics based on results and success metrics; 5. Review and revise, learn from your mistakes and brainstorm to identify options . He concludes, “business intelligence is moving away from gut-feel strategic choices and moving toward an evidence-driven rational approach to business.” 2 Dashboards such as the ones in this article provide examples of
evidence-driven business intelligence.
With today’s technology including available practice management software (PMS) systems specific to the hearing care industry and emerging laws and regulations, the days of manual tracking, scheduling, billing, marketing, patient communication and more should be long gone; however, too many audiologists still rely on manual systems
Figure 1. Dashboard KPI Summary
1Investopedia web site. Retrieved September 20, 2013 from www.investopedia.com
AUDIOLOGY PRACTICESnVOL. 5, NO. 4 25
by Lynn Sirow, Ph.D.
& Pamela Souza, Ph.D.
dashboard provides a good example of KPIs that are measure-able, clear, time specific, non-ambiguous and can have a sub-stantial impact on an audiology practice’s success.
KPIs always tell a story and with a little training, any audi-ologist can understand the story of their practice and quickly identify their strengths as well as areas that need more atten-tion. Once identified, it is relatively easy to maintain what you are doing well and focus on improving specific practice weaknesses.
According to Bojorquez, the KPI Cycle includes five steps: 1. Define the core business strategy and objective; 2. Determine KPIs to track, including benchmarks; 3. Measure performance over time;
4. Adjust tactics based on results in relation to benchmarks; 5. Review and revise, learn from your mistakes and
brain-storm to identify options.
Bojorquez concludes, “business intelligence is moving away from gut-feel strategic choices and moving toward an evi-dence-driven rational approach to business.”2 Dashboards, such as the one depicted in Figures 1, 2 and 3, provide exam-ples of evidence-driven business intelligence.
With today’s inexpensive and easy-to-use computer technol-ogy, including available practice management software (PMS) systems specific to the hearing care industry, the days of manual tracking, scheduling, billing, marketing and patient
communication are long gone. Many audiologists, however, still rely on manual systems for these crucial tasks. Either they do not use all of the various modules that are available in their chosen PMS, or do not assure accurate data entry rendering PMS essentially useless for reporting and management of their practice.
Understanding and using the various PMS modules (sched-uling, invoicing, billing, marketing, patient communication, etc.) is at the core of proficiently identifying and solving many performance gaps within a practice. Consider the time spent and the associated costs (both actual costs and lost opportu-nity costs) of manual tracking. Manual tracking made sense when automated tools did not exist, but that is no longer the case in most industries, including hearing care. Let’s examine some specific examples from the real world and how auto-mated dashboards can help a practice more effectively man-age their business.
Practice Performance Issue #1 An audiologist feels they are working longer hours and see-ing more patients, but the bank account balance is shrinksee-ing. Where are the problems and what are the solutions?
How Computerized Dashboards Help
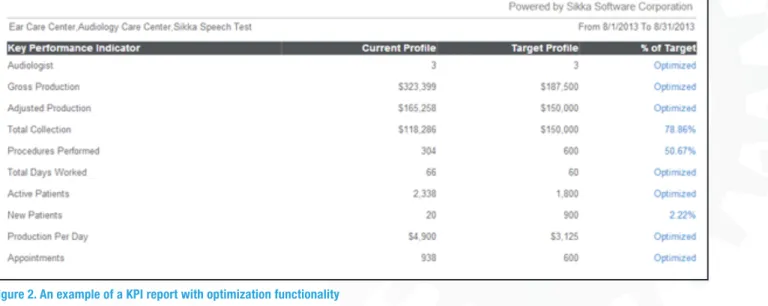
Figure 2 shows current daily results compared to the practice’s targeted goal for multiple KPIs for one month and identifies whether or not each KPI is optimized for that given month.
Figure 2. An example of a KPI report with optimization functionality.
As mentioned, numbers tell a story and dashboards and reports are the vehicle to
provide data that supports and enhances proactive data-driven practice management.
When the bank balance is declining one must determine if the problem is associated
with provider productivity, practice fees, adjustments associated with participation with
third party payors or patients not paying their balances, theft, and/or expenses among
other things. When you track gross and adjusted revenue as well as collections the
answers becomes very apparent. The practice story in My Profile Comparison Report
(Figure 2) is consistent with audiologists that are seeing more than targeted numbers of
patients (appointments), have more than optimized revenue (gross production) and
have generated an excellent and above target production per day ($4,900 vs. $3,125).
One could conclude that the audiologists are working hard, however, the story does not
end there.
Although adjusted production (revenue) is optimized because the practice achieved
their targeted goal, very quickly it is easy to identify a large dollar difference between
gross production and adjusted production. This is also known as a high adjustment
rate. Even more alarming is total collection. (See the middle of Figure 2.) Total
collection is not optimized and also consistent with nearly a 29% reduction from
adjusted production, which should be near 0%. Although the providers are seeing
patients and generating substantial and above target dollars, this practice has both an
adjustment and a collection problem that must be investigated and solved in order to fix
the shrinking bank balance problem. Practices that record net production as gross
production would not have the data easily available to identify this core adjustment
problem.
Figure 2. An example of a KPI report with optimization functionality
26 AUDIOLOGY PRACTICESnVOL. 5, NO. 4
Notice how the audiologist or business manager can simply glance at the right-hand column to quickly see if a particular KPI has been optimized that month.
As mentioned, numbers tell a story and dashboards are the vehicle that supports and enhances proactive data-driven practice management. When the bank balance is declining one must determine if the problem is associated with pro-vider productivity, practice fees, adjustments associated with participation with third party payors or patients not paying their balances, among other things. When you track gross and adjusted revenue as well as collections the answer becomes very apparent. The practice story shown in the dashboard in Figure 2 is consistent with audiologists that are seeing more than the targeted number of patients (listed as “appointments” on the dashboard), have more than optimized revenue (listed as “gross production” on the dashboard) and have optimized target production per day ($4,900 vs. $3,125). One could con-clude that the audiologists are working hard, however, the story does not end there.
Although net production (listed as “adjusted production” on the dashboard) is optimized because the practice achieved their targeted goal, very quickly it is easy to identify a large dollar difference between gross production and adjusted pro-duction. Even more alarming is total collection. (Shown in the middle of Figure 2.) Total collection is not optimized and also consistent with nearly a 29% reduction from adjusted production, which should be near 0%. Although the provid-ers are seeing patients and generating substantial and above
target dollars, this practice has both an adjustment and a col-lection problem that must be investigated and solved in order to fix the shrinking bank balance problem.
The KPIs on the dashboard in Figure 2 clearly show that this practice does not have a productivity problem. Asking pro-viders to see more patients, work longer hours, or produce more revenue will not solve their core problems. It is not the production of revenue, but the collection of revenue that is the major problem. Based on the dashboard numbers one must investigate and solve both the high adjustment rate and the low collection rate.
Practice Performance Issue #2 Most audiologists participate with one or more third party payors, as many audiologists believe some limited revenue from these third party payors is better than no revenue at all. However, that is often not the case, especially when payments fall below costs or a practice’s breakeven rate, or when collec-tion percentages for a payor are low. In most cases participa-tion with third party payors results in payment adjustments and many audiologists do not fully understand the impact of participation and the resulting required fee adjustments. Adjustments result when patients or carriers do not pay usual and customary charges, when patients are turned over to col-lection or when discounts are taken. A computerized dash-board allows a practice to track payments by payor. Thus, a practice can make data-driven decisions about the third party payors they wish to utilize in their practice.
Figure 3. Third Party Payer Dashboard.
Figure 2. Third Party Payer Dashboard
At first blush one might conclude that Aetna is the best payor in this practice because
this practice had the highest billings with Aetna ($38,669) for the time frame; however,
this same practice only collected $16,046 from Aetna or 41% of billings. Both Anthem
Blue Cross and United Healthcare had substantially lower gross billings at $16,978 and
$11,080 respectively, but a much higher collections at $13,582 for Anthem Blue Cross
and $10,589 for United Healthcare making those collection percents 80% and 96%
respectively. Although more revenue was generated with Aetna there may be more
value to participation with Anthem Blue Cross and United Healthcare for this practice.
One must investigate not only the data, but also all variables including if a payer
generates private pay hearing aid or other sales. The bottom line is that you must track
gross production (total billed) and total collected by payer to have the data to be able to
identify your best and worst payers, including those that offer value and those that are a
hindrance to the practice.
Providing services and products below the practice’s hourly breakeven rate or below
cost is rarely a good decision. In fact, unless there is a very compelling reason to do so,
such contracts should be avoided.
Regardless of the size of a practice an audiologist’s time is one of the practice’s most
valuable assets. Managing the provider’s time efficiently and effectively is also key to
success and always plays a significant role in any practice’s profitability. Any activity
that takes an audiologist away from seeing patients and generating revenue should be
evaluated both in terms of actual cost as well as lost opportunity dollars.
AUDIOLOGY PRACTICESnVOL. 5, NO. 4 27
How a Computerized Dashboard Helps
Collection by third party payor can also tell a very interesting story. It is easy to see on the dashboard in Figure 3 that for one specific time period “total billed by payor” substantially exceeds “total col-lected by payor.” Additionally, the dashboard quickly identifies the best and worst payors. One must consider both the work completed (total billed) and the result (total collected) to determine whether or not there is value in participating with a specific payor.
At first blush, one might conclude that Aetna is the best payor in this practice because this practice had the highest billings with Aetna ($38,669) for the time frame; however, this same practice only col-lected $16,046 from Aetna or 41% of billings. Both Anthem Blue Cross and United Healthcare had substantially lower gross billings at $16,978 and $11,080 respectively, but a much higher collections at $13,582 for Anthem Blue Cross and $10,589 for United Health-care making those collection percents 80% and 96% respectively. Although more revenue was generated with Aetna, there may be more value to participation with Anthem Blue Cross and United Healthcare for this practice. The bottom line is that a computerized dashboard allows you to track the total billed and total collected by payor, to have the data to be able to identify your best and worst payors. Providing services and products below the practice’s hourly breakeven rate (or below cost) is rarely a good decision. In fact, unless there is a very compelling reason to do so, such contracts should be avoided.
In addition to the two scenarios discussed previously, the real time collection of KPI data that is aggregated onto a computerized dash-board enables managers to optimize their return-on-investment relative to marketing, operational, and practice management funds. Additionally, computerized dashboards improve the efficiency of identifying and filling schedule gaps, thus, practices have fewer open slots in their schedule and generate more revenue. Regard-less of the age of an audiology practice, it is common to see practice performance gaps that are costly to the practice and that negatively impact productivity. Not utilizing all of the modules in one’s PMS, inaccurate data entry or an inability to act upon real-time KPIs are common practice performance gaps. Numbers always tell a story and dashboards allow managers and practice owners to identify trends and make data-driven decisions that often result in practice growth. n
Kathy Foltner, Au.D. is Vice President Hearing Care for Sikka Soft-ware Corporation. She holds adjunct faculty status at Rush University Medical Center, is a prior private practice owner of a multi-location practice and a hearing care industry consultant. She can be reached at 312-593-1787 or at [email protected].
HEADQUARTERS REPORT
Continued from page 7
practice forms, HR documents and business templates.
• Development of the ADA Young Professional Leadership Training Program
• Collaboration with ACAE to promote ACAE accreditation to university programs
• Expansion of ADA Practice Match and Extern Exchange to facilitate activities related to precep-torship/externship, practice buying and selling and employment in a private practice setting • Expansion of the ADA Student Business Plan
Competition
• Expansion of ADA’s Virtual Student Chapter and associated student resources
• Introduction of the ADA Guide to Practice Management
• Study and development of recommended mod-els of practice that will be useful for audiologists
Drivers Wanted
Don’t just come along for the ride—get in the driv-er’s seat. If you are interested in helping to develop or implement any of these planned projects, please contact ADA headquarters at [email protected] or at 866-493-5544. We will be glad to connect you with the working groups, task forces and commit-tees that are transporting audiology to its autono-mous future. n