LonScanner™ FX Protocol
Analyzer User’s Guide
Echelon, i.LON, LNS, LonMaker, LONMARK, LonTalk, LONWORKS,
Neuron, NodeBuilder, and the Echelon logo are trademarks of Echelon Corporation registered in the United States and other countries. LonScanner is a trademark of the Echelon Corporation.
Other brand and product names are trademarks or registered trademarks of their respective holders.
Neuron Chips and other OEM Products were not designed for use in equipment or systems, which involve danger to human health or safety, or a risk of property damage and Echelon assumes no responsibility or liability for use of the Neuron Chips in such applications.
Parts manufactured by vendors other than Echelon and referenced in this document have been described for illustrative purposes only, and may not have been tested by Echelon. It is the responsibility of the customer to determine the suitability of these parts for each application.
ECHELON MAKES AND YOU RECEIVE NO WARRANTIES OR CONDITIONS, EXPRESS, IMPLIED, STATUTORY OR IN ANY COMMUNICATION WITH YOU, AND ECHELON SPECIFICALLY DISCLAIMS ANY IMPLIED WARRANTY OF MERCHANTABILITY OR FITNESS FOR A PARTICULAR PURPOSE.
No part of this publication may be reproduced, stored in a retrieval system, or transmitted, in any form or by any means, electronic, mechanical, photocopying, recording, or
otherwise, without the prior written permission of Echelon Corporation.
Printed in the United States of America. Copyright © 1994, 2010 Echelon Corporation. Echelon Corporation
Welcome
The Echelon® LonScanner™ Protocol Analyzer is a software tool that you can use
to monitor, analyze, and diagnose the behavior of LONWORKS® networks. The
LonScanner Protocol Analyzer connects to IP-852 (ISO/IEC 14908-4) and native LONWORKS (ISO/IEC 14908-1) channels, collects packets from those channels,
and stores information from the packets into log files. You can use the log files to inspect and interpret the collected packets.
You can monitor up to 10 channels at once with the protocol analyzer. You can view the logs created for each channel (called active logs) while the protocol analyzer is monitoring the channel and collecting packets, and you can take advantage of the filtering and statistical features that the tool provides to gather the information that you want. You can also view logs that you have saved to diagnose network problems that occurred when the log was created.
Audience
This document assumes that the reader has a good understanding of the LONWORKS platform and of general analysis for network communications.
What’s New for LonScanner FX
The LonScanner FX Protocol Analyzer is part of the LONWORKS 2.0 product
family. The LonScanner FX Protocol Analyzer adds the following features to those provided by Release 3 of the LonScanner Protocol Analyzer:
• Runs on Microsoft® Windows® 7, Windows Vista®, and Windows Server
2008. The LonScanner FX Protocol Analyzer is designed for the 32-bit versions of Windows, but is compatible with the x64 Editions.
• Provides multiuser licensing options.
Related Documentation
The following manuals are available from the Echelon Web site (www.echelon.com/docs) for products that are commonly used with the LonScanner Protocol Analyzer:
• i.LON SmartServer 2.0 User's Guide (078-0345-01E). This manual describes how to configure the i.LON SmartServer and use its applications to monitor and manage control networks.
• Introduction to the LONWORKS Platform (078-0183-01B). This manual
provides an introduction to the ISO/IEC 14908-1 (ANSI/CEA-709.1 and EN14908) Control Network Protocol, and provides a high-level
introduction to LONWORKS networks and the tools and components that
are used for developing, installing, operating, and maintaining them.
• IP-852 Channel User's Guide (078-0312-01A). This manual provides information you will need when creating an IP-852 channel with an i.LON SmartServer, i.LON 100 Internet Server, i.LON 600 LONWORKS/IP
iv
configuring the IP-852 channel with the Echelon LONWORKS/IP
Configuration Server, and guidelines to follow when using NAT, DNS, or DHCP on the IP-852 channel.
• LNS Programmer's Guide (078-0177-01F). This manual describes how to write LNS applications.
• LonMaker User's Guide (078-0333-01A). This manual describes how to use the LonMaker Integration Tool to design, commission, monitor and control, maintain, and manage a network.
• LONMARK® Application Layer Interoperability Guidelines. This manual
describes design guidelines for developing applications for open interoperable LONWORKS devices, and is available from the LONMARK
Web site, www.lonmark.org.
• LONWORKS PCC-10 PC Card User's Guide (078-0155-01B). This manual
provides an overview of the PCC-10 card and software, including installation details and configuration options. For developers and end users of LONWORKS systems using the PCC-10 card.
• LONWORKS PCLTA-20 PCI LonTalk Adapter User's Guide
(078-0179-01C). This manual provides detailed technical specifications on the electrical and mechanical interfaces and operating environment characteristics for the PCLTA-20 adapter.
• LONWORKS PCLTA-21 PCI Interface User's Guide (078-0271-01A). This
manual describes the mechanical characteristics and the hardware and software driver installation for the Echelon PCLTA-21 Interface (Models 74501, 74502, 74503, 74504, and 74505).
• LONWORKS USB Network Interface User's Guide (078-0296-01B). This
manual describes how to install and use Echelon's U10 and U20 USB Network Interface products. The USB Network Interfaces are miniature, high performance network interfaces that provide network connection between USB-enabled PCs and Free Topology (TP/FT-10) or C-Band Power Line (PL-20C or PL-20N) LONWORKS channels. The interfaces are
provided through a v1.1 and v2.0 compliant USB connection.
• Mini FX User’s Guide (078-0398-01A). This manual describes how to use the Mini FX Evaluation Kit. You can use the Mini kit to develop a prototype or production control system that requires networking, or to evaluate the development of applications for such control networks using the LONWORKS platform.
• NodeBuilder® FX User’s Guide (078-0405-01A). This manual describes
how to develop a LONWORKS device using the NodeBuilder tool.
• ShortStack FX User's Guide (078-0365-01B). This manual describes how to develop an application for a LONWORKS device using Echelon’s
ShortStack® FX Micro Server. It describes the architecture of a
ShortStack device and how to develop a ShortStack device.
All of the Echelon documentation is available in Adobe®PDF format. To view the
PDF files, you must have a current version of the Adobe Reader®, which you can
Table of Contents
Welcome...iii
Audience ...iii
What’s New for LonScanner FX...iii
Related Documentation ...iii
Chapter 1. Introduction to the LonScanner Protocol Analyzer... 1
Introduction... 2
Software Requirements ... 2
Installing the LonScanner Software... 2
Updating LonScanner 3... 3
Activating the LonScanner Software... 3
Transferring a LonScanner Activation ... 5
Viewing Activation Status ... 7
Using the LonScanner Protocol Analyzer... 7
Monitoring a Network Channel... 8
Opening an Existing Packet Log ... 9
Log Files Overview ... 9
Using the LonScanner Window ... 11
LonScanner Menus ... 11
LonScanner Toolbar... 12
LonScanner Status Bar ... 13
Using LonScanner with LNS Turbo Edition ... 13
Chapter 2. Logging Data... 15
Configuring the LonScanner Protocol Analyzer ... 16
Setting Logging Preferences ... 16
Filtering Packets ... 17
Configuring the Global and Device Filters... 18
Importing Filter Settings from a Channel ... 21
Saving Filter Settings for Later Use ... 21
Setting the Capture and Monitor Modes ... 22
Viewing Channel Statistics and Trend Graphs ... 22
Viewing General Statistics ... 23
Viewing Bandwidth Utilization by Packet Type ... 24
Viewing Bandwidth Utilization History ... 24
Viewing Error Rate History... 25
Setting Statistics Options ... 26
Using Names ... 29
Importing Names... 30
Importing Names from an LNS Database... 30
Importing Names from a Local Names File ... 34
Importing Names from a Channel ... 35
Creating and Customizing Names ... 36
Creating Group Names... 36
Creating Device Names ... 37
Creating Message Code Names... 38
Creating Domain Names ... 39
Managing Names Files... 41
Chapter 3. Analyzing Packet Log Details ... 43
Searching For Packet Log Entries ... 44
vi
Searching By Log Number... 45
Bookmarking Packet Log Entries ... 45
Formatting the Packet Log... 47
Selecting Data Fields ... 47
Formatting Data Field Columns ... 48
Color-Coding the Packet Log ... 49
Printing Log Files ... 50
Exporting Log Files... 51
Chapter 4. Example Logs... 53
Example Packet Logs... 54
Sample 1: Channel without Assigned Names... 54
Sample 2: Channel with Names Imported from an LNS Database ... 55
Appendix A. Network Interfaces ... 59
Network Interfaces Overview... 60
PCC-10 and PCLTA-20/21 ... 61
1
Introduction to the LonScanner
Protocol Analyzer
This chapter introduces the LonScanner Protocol Analyzer. It describes how to install and activate the LonScanner software, and how to get started with the protocol analyzer.
2 Introduction to the LonScanner Protocol Analyzer
Introduction
The LonScanner FX Protocol Analyzer is a software tool that you can use to monitor, analyze, and diagnose the behavior of LONWORKS networks. The
LonScanner FX Protocol Analyzer connects to IP-852 (ISO/IEC 14908-4) and native ISO/IEC 14908-1 channels, collects packets from those channels, and stores information from the packets into log files. You can use the log files to inspect and interpret the collected packets.
You can monitor up to 10 channels at once with the protocol analyzer. You can view the logs created for each channel (called active logs) while the protocol analyzer is monitoring the channel and collecting packets, and you can take advantage of the filtering and statistical features that the tool provides to gather the information that you want. You can also view logs that you have saved to diagnose network problems that occurred when the log was created.
This manual refers to both IP-852 (ISO/IEC 14908-4) and LONWORKS/IP
channels as IP-852 channels. This manual refers to native ISO/IEC 14908-1 channels, such as TP/FT-10 and PL-20 channels, as LONWORKS channels.
Software Requirements
To install and use the LonScanner software, your computer must meet the following minimum requirements:
• Intel® Pentium® III 800 MHz processor
• 128 MB RAM
• 32-bit version of Windows 7, Windows Vista, or Windows Server 2008
• 10 MB of available hard-disk space
• 1024x768 screen resolution
Installing the LonScanner Software
To install the LonScanner software:
1. Start the installation program for the LonScanner FX Protocol Analyzer by performing one of the following steps:
a. Insert the Echelon LonScanner FX Protocol Analyzer CD into a CD-ROM or DVD-CD-ROM drive. If the installation does not automatically start after a few seconds, start the program manually. You can start the installation by clicking the Windows Start button, clicking Run, browsing to the setup application, and then clicking Open. The main LonScanner installation window opens.
b. Double-click the LonScannerFX.exe file that you downloaded from the Echelon Web site.
3. Click LonScanner FX Protocol Analyzer to continue. The Welcome window opens.
4. Click Next to continue. The License Agreement window opens.
5. Read the terms of theLonScanner FX Protocol Analyzer software license agreement. If you agree to the terms of the license agreement, click I Accept the Terms in the License Agreement. The User window opens. Note: The LonScanner software license is included in this document as Appendix B, LonScanner FX Protocol Analyzer Software License Agreement, on page 63.
6. Enter your user name, organization and product serial number. Click Next to continue.
7. If the LONWORKS path has not been set for your computer, a dialog opens to
prompt you to choose this path. You can change this setting as long as you have not previously installed any other Echelon or LONMARK software. Click
OK to select the path.
8. On the next dialog, click Install to begin the installation. When the installation has completed, a completion dialog appears.
You can also install the Adobe Reader or the NodeBuilder® Resource Editor
software from the Install Products dialog (see step 2). Drivers for the i.LON SmartServer, i.LON 100 Internet Server, i.LON 600 LONWORKS/IP Server, and
the U10 and U20 USB Network Interfaces are included with the main LonScanner software installation.
You can use the NodeBuilder Resource Editor to browse the network variable types available on your computer when configuring device names with the protocol analyzer, as described in Chapter 2, Logging Data, on page 15.
Updating LonScanner 3
You can install the LonScanner FX software over an existing LonScanner 3 installation by following the procedure described in Installing the LonScanner Software on page 2. If you activated the LonScanner 3 software, the LonScanner FX software will automatically be activated. If you used the LonScanner 3 LNS Turbo Edition, an LNS Turbo Server is still required to use the LonScanner FX software. If you had the LonScanner 3 Professional Edition, an LNS Turbo Server is not required, but can be used. If you had the LonScanner 3 Demo Edition, you will have a LonScanner FX Demo Edition.
Activating the LonScanner Software
After a successful installation, the protocol analyzer runs in demonstration mode until you activate it. When operating in demonstration mode, the LonScanner License Activation dialog (shown in Figure 1 on page 4) appears each time you start the protocol analyzer.
4 Introduction to the LonScanner Protocol Analyzer Figure 1. LonScanner License Activation Dialog
To continue running in demonstration mode, click Continue Eval. When operating in demonstration mode, the protocol analyzer does not display every captured packet and displays only the first 20 packets of a saved or imported log file. After you activate the product, you will have access to all LonScanner features.
If you choose to operate in demonstration mode, the LonScanner License Activation dialog appears every time you open the protocol analyzer. You can also access the LonScanner License Activation dialog and activate the
LonScanner software while running in demonstration mode by selecting Help →
Activate Product →Activate.
To activate the protocol analyzer from the LonScanner License Activation dialog, select a product version from the list:
• Select Prepaid Professional Edition, Single User if you purchased a Model 33110-401 LonScanner FX Professional Edition with prepaid key. You must supply the serial number supplied with your prepaid edition for either of the prepaid editions.
• Select Prepaid Professional Edition, 5-Pack if you purchased a Model 33110-403 LonScanner FX Professional Edition with five prepaid keys. You must supply the serial number supplied with your prepaid edition for either of the prepaid editions. Repeat the activation process on up to five primary computers and up to five secondary computers.
• Select Professional Edition Activation Key, Single User if you do not have a prepaid key, and you are ordering a single activation key. You can use this option to activate a LonScanner FX Demo Edition or to add an additional user for a LonScanner FX Professional Edition.
• Select Professional Edition Activation Key, 5-Pack if you do not have a prepaid key, and you are ordering a 5-pack with five activation keys. You must repeat the activation process on up to five primary computers and up to five secondary computers. You can use this option to either activate a LonScanner FX Demo Edition on up to five computers or to add up to five additional users for a LonScanner FX Professional Edition.
After you select a product version, click Copy Order Form to Clipboard. Paste the order form that is copied to an e-mail message or text editor document, fill in the blanks on the form, and then mail or fax the request to Echelon, using the e-mail address or fax number on the form. Echelon will process the request and send you an activation key.
After you receive the activation key, enter it in the Activation Key field, and click Activate to activate the software.
Transferring a LonScanner Activation
You can transfer your LonScanner activation to another computer. This process deactivates the protocol analyzer on your original computer, and then activates it on the new computer.
To transfer activation, perform the following steps:
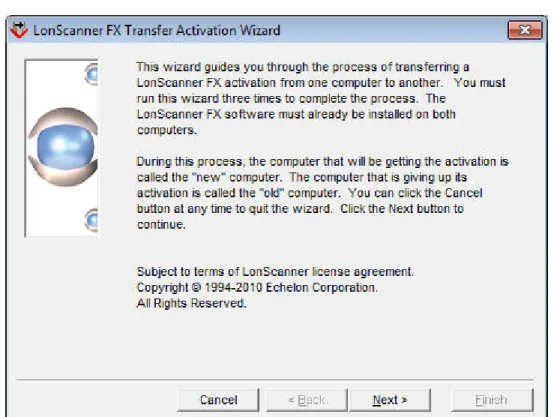
1. Select Help →Activate Product →Transfer Activation. The Transfer Activation Wizard opens, as shown in Figure 2 on page 6.
6 Introduction to the LonScanner Protocol Analyzer Figure 2. LonScanner Transfer Activation Wizard
2. Click Next to continue. The main window opens, as shown in Figure 3.
Figure 3. LonScanner Transfer Activation Wizard Main Window 3. From the main window, you must perform all three steps:
a. Step one must be performed on the target computer to which you want to transfer the activation.
b. Step two must be performed on the computer that currently contains the activation that you want to transfer. The
LonScanner software on this computer will no longer be activated after the transfer is complete, and will run in demonstration mode.
c. Step three must be performed on the target computer to which you want to transfer the activation. This step completes the transfer.
See the LonScanner online help for more information about these steps.
Viewing Activation Status
You can access information about your LonScanner software at any time by selecting Help →About LonScanner Protocol Analyzer to open the About Echelon LonScanner Protocol Analyzer dialog. This dialog displays the version number and activation key of your LonScanner software. You can access additional activation information by selecting Help →Activate Product →Display Activation Status to open the Activation Status dialog.
Using the LonScanner Protocol Analyzer
After you install the LonScanner software, you can begin monitoring IP-852 and LONWORKS channels with the protocol analyzer and analyzing the data that it
collects.
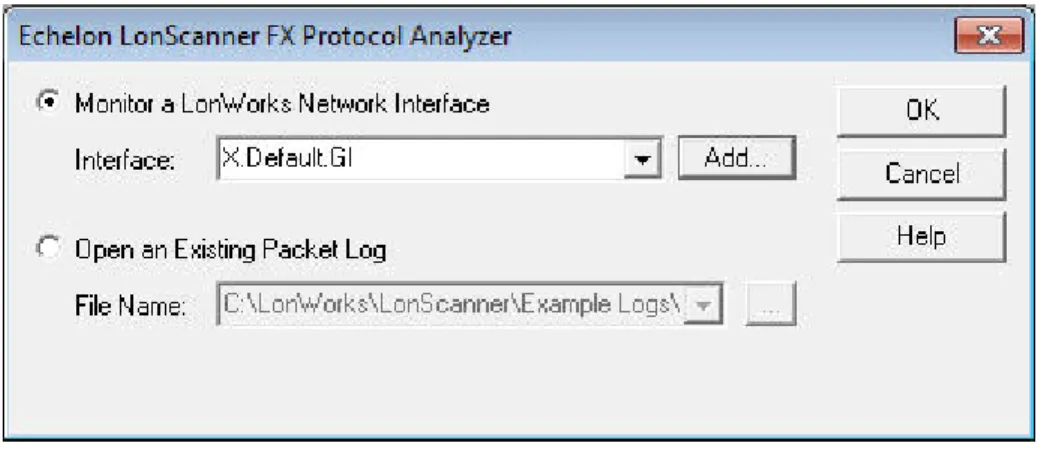
To start the protocol analyzer, select Programs → Echelon LonScanner Protocol Analyzer → LonScanner Protocol Analyzer from the Windows Start menu. If you have not yet activated the software, the LonScanner License Activation dialog opens, as shown in Figure 1 on page 4. If the product is activated (or you click Continue Eval from the dialog), the Start-Up dialog opens, as shown in Figure 4.
Figure 4. Start-Up Dialog
From the Start-Up dialog, you have two options to choose from:
• Monitor a LonWorks Network Interface. Select this option to monitor an IP-852 or LONWORKS channel through a local or remote LONWORKS
8 Introduction to the LonScanner Protocol Analyzer network interface. For more information, see Monitoring a Network Channel.
• Open an Existing Packet Log. Select this option to view a packet log saved from a previous monitoring session. For more information, see Opening an Existing Packet Log on page 9.
Monitoring a Network Channel
To monitor an IP-852 or LONWORKS channel, perform the following steps:
1. Select Monitor a LonWorks Network Interface on the Start-Up dialog shown in Figure 4, and then select the network interface that you plan to use from the Interface dropdown list box. This list box displays the available network interfaces for your computer.
To add a new network interface, click Add to open the LONWORKS
Interfaces application (from the Windows Control Panel). If you are using an i.LON SmartServer, i.LON 100 Internet Server or an i.LON 600 LONWORKS/IPServer as your network interface, you must configure it
with the LONWORKS Interfaces application before you can use it with the
protocol analyzer.
From theLONWORKS Interfaces application, you can add a remote
network interface (RNI), an IP-852 network interface, or a USB network interface:
• To add an RNI, click Add to open the Add Network Interface Wizard. On the first page of the wizard, enter a name for the network interface, and click Next. On the second page, select LonScanner as the Interface Type. Click Finish to add the network interface and close the wizard.
• To add an IP-852 network interface, click Add to open the Network Interface Add dialog. Enter a name for the network interface in the Name field, select (or enter) an IP address in the IP Address dropdown list box, enter the IP port in the IP Port field, select the appropriate channel timing type, and enter the authentication key (if the device uses authentication) in the MD5 Authentication Key field. Click OK to add the network interface and close the dialog.
• To add a USB network interface, plug an Echelon U10 or U20 network interface into to an available USB port on your
computer. The LONWORKS Interfaces application should show the
network interface automatically. Select the Show detached interfaces checkbox to show previously configured USB network interfaces that are not currently connected to your computer. See the LONWORKS Interfaces application’s online help for more
information.
No additional configuration is required to use an Echelon U10 or U20 USB Network Interface. For additional information about an i.LON
SmartServer, i.LON 600 LONWORKS/IPServer, PCC-10, or PCLTA-20/21
network interface see Appendix A, Network Interfaces, on page 59. 2. Click OK to begin monitoring the selected channel. The main
LonScanner window opens. A log entry is added to the Packet Log tab for each packet that the protocol analyzer receives from the channel. For an overview of the Packet Log tab and the rest of the main LonScanner window, see Log Files Overview on page 9.
3. To save the log file for later use, select File → Save Log As to open the Save As dialog. After you save the log file, you can re-open the log file at any time, as described in Opening an Existing Packet Log.
4. To monitor additional channels, select File → New Connection, or click New from the LonScanner toolbar. You can monitor up to 10 channels at the same time.
See Chapter 2, Logging Data, on page 15, for a description of how to use the protocol analyzer to perform additional tasks, such as filtering incoming data or controlling the packet log.
Opening an Existing Packet Log
To open a packet log saved from a previous LonScanner or LonManager Protocol Analyzer session, select Open an Existing Packet Log on the Start-Up dialog shown in Figure 4 on page 7, and enter the log that you want to open in the File Name field, or click the browse button to open the Open dialog. LonScanner log files have the .lsl extension, and LonManager log files have the .pal extension. After you select a file, click OK to open the main LonScanner window. The log that you selected is displayed in the Packet Log tab. For an overview of the Packet Log tab and the rest of the main LonScanner window, see the Log Files Overview section.
You can open additional packet logs after you start the protocol analyzer by selecting File → Open Log or by clicking Open from the LonScanner toolbar.
Log Files Overview
When you begin monitoring a channel or open a saved log file with the protocol analyzer, the main LonScanner window opens, as shown in Figure 5 on page 10.
10 Introduction to the LonScanner Protocol Analyzer Figure 5. Main LonScanner Window
The main window includes the following three main areas:
• The Packet Log tab comprises the majority of the main LonScanner window. The Packet Log tab contains a series of log entries, one for each packet that the protocol analyzer collects from the channel. The log entries are listed sequentially by timestamp. See the online help for descriptions of the data fields listed for each packet.
While you are actively monitoring a channel, you can also select the General Statistics, Packet Types, Bandwidth Utilization History, and Error Rate History tabs at the bottom of the window to view statistics collected from the channel during your log session. For more information on these tabs, and for information about how you can configure the protocol analyzer’s behavior during an active log session, see Chapter 2, Logging Data, on page 15.
• The Packet Detail pane to the right of the Packet Log tab lists detailed information about the packet that is currently selected (if any) in the Packet Log. Click a packet in the Packet Log to select it and view its details in the Packet Detail pane. See the online help for descriptions of the data fields listed for each packet in the Packet Detail pane.
• The menus and toolbar at the top of the window allow you to determine how the protocol analyzer collects data from the channel and to organize and analyze the data after it has been collected. For an overview of the features provided by each menu, see Using the LonScanner Window on page 11.
Using the LonScanner Window
This section provides a brief introduction to the features that you can access using the main LonScanner window. These features are described in more detail in later chapters, and in the LonScanner online help.
LonScanner Menus
Table 1 lists the LonScanner menus, and describes the functionality that is provided by each menu. For detailed descriptions of each menu option, see Chapters 2 and 3 of this document, and the LonScanner online help.
Table 1. LonScanner Menus Menu Description
File Use the File menu to open new connections to local and remote channels, and to open pre-existing log files. You can also use the File menu to print and export log files, and to set the general logging preferences that affect how the protocol analyzer creates and
manages log files.
Edit Use the Edit menu to search through log files, and to bookmark specified log entries as being of interest.
View Use the View menu to format how the data in the Packet Log is displayed (including selecting which data fields are displayed in the Packet Log for each log entry, how each data field is formatted, and what color and font is used to display each log entry). You can also use the View menu to hide or display the LonScanner toolbar, status bar, and Packet Detail pane.
Names Use the Names menu to import or edit device and network variable names for the channel that you are monitoring.
Filter Use the Filter menu to create and activate LonScanner filters, which you can use to select which packets the protocol analyzer stores into a log file, and which ones it does not store.
Network When you are actively monitoring a channel with the protocol analyzer, you can use the Network menu to enable and disable capture mode and monitor mode, and to clear all data from the currently selected log.
Statistics When you are actively monitoring a channel with the protocol analyzer, you can use the Statistics menu to configure how the protocol analyzer gathers and displays network statistics.
Window Use the Window menu to arrange the log files and windows that are currently open.
12 Introduction to the LonScanner Protocol Analyzer Menu Description
Help Use the Help menu to access information about the version and activation status of the LonScanner software, and to access the LonScanner online help. You can also access the LonScanner Transfer Activation Wizard from this menu.
LonScanner Toolbar
The LonScanner toolbar provides quick access to commonly used menu options. The LonScanner toolbar is shown in Figure 6.
Figure 6. LonScanner Toolbar
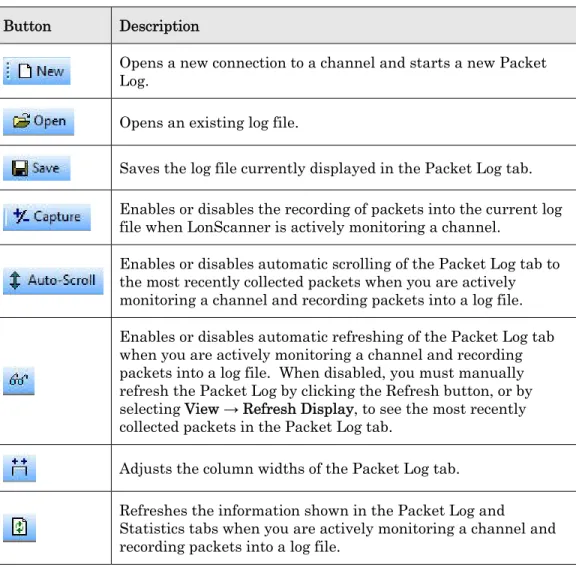
You can click a button on the toolbar to use the feature provided by that button. Table 2 describes the buttons.
Table 2. LonScanner Toolbar Buttons Button Description
Opens a new connection to a channel and starts a new Packet Log.
Opens an existing log file.
Saves the log file currently displayed in the Packet Log tab.
Enables or disables the recording of packets into the current log file when LonScanner is actively monitoring a channel.
Enables or disables automatic scrolling of the Packet Log tab to the most recently collected packets when you are actively monitoring a channel and recording packets into a log file. Enables or disables automatic refreshing of the Packet Log tab when you are actively monitoring a channel and recording packets into a log file. When disabled, you must manually refresh the Packet Log by clicking the Refresh button, or by selecting View → Refresh Display, to see the most recently collected packets in the Packet Log tab.
Adjusts the column widths of the Packet Log tab.
Refreshes the information shown in the Packet Log and
Statistics tabs when you are actively monitoring a channel and recording packets into a log file.
Clears all data from the log file currently shown in the Packet Log tab.
Starts the LNS Names Import Wizard, which you can use to import device and network variable names from an LNS database.
Finds an occurrence of a string in the Packet Log tab.
Finds the next occurrence of a string in the Packet Log tab.
Creates a bookmark. You can use bookmarks to mark certain log entries as being of interest.
Scrolls the Packet Log tab to the next bookmarked packet.
Scrolls the Packet Log tab to the previous bookmarked packet.
Prints the log file currently displayed in the Packet Log tab.
LonScanner Status Bar
The Status Bar is at the bottom of the LonScanner Protocol Analyzer window. It provides the following information:
• A status message that provides a brief description of the currently selected menu items and buttons.
• The total number of packets recorded into log file.
• The number of packets that have been filtered.
• The logging state of the currently selected active log.
• Whether or not network interface sharing is enabled or disabled.
Using LonScanner with LNS Turbo Edition
If you plan to use LonScanner FX Professional Edition with LONWORKS channels,
you do not need an LNS Turbo Edition Server. However, when used with the protocol analyzer, an LNS Turbo Edition Server provides several additional features, including importing device and network variable names, network interface sharing, and monitoring of IP-852 channels.
With an LNS Turbo Edition Server, you can import device and network variable names from an LNS network database into the current LonScanner active log. See Chapter 2, Logging Data, on page 15, for more information.
With LNS Turbo Edition Server installed, the protocol analyzer and the
14 Introduction to the LonScanner Protocol Analyzer interface (that is, each tool can use the network interface at the same time). Network interface sharing applies to PCC-10, PCLTA-20/21, i.LON SmartServer, i.LON 100 Internet Server, i.LON 600 LONWORKS/IP Server, and U10/U20 USB
Network Interfaces.
You can also run the protocol analyzer and the LonMaker tool (or any custom LNS application) at the same time with the same network interface on a computer with an LNS 3 Server if you use an i.LON SmartServer, i.LON 100 Internet Server, or an i.LON 600 LONWORKS/IP Server as the network interface.
In addition, you can import device and network variable names from your LNS database if you have an LNS 3 Server.
If you have an LNS Turbo Edition Server installed, you can use the protocol analyzer to monitor IP-852 channels, as well as LONWORKS channels. If you
attempt to monitor an IP-852 channel without an LNS Turbo Edition Server installed, the LonScanner Protocol Analyzer issues an error message (“Failed to open channel via OpenLDV”).
The IP-852 interface operates differently from LONWORKS channels. The layer 2
interface of every device on a LONWORKS channel receives every packet on the
channel. But, Echelon’s IP-852 devices and routers do not automatically forward packets to every other device and router on the channel. Instead, they selectively forward packets directly to the intended destination devices and routers on the channel. As a result, the protocol analyzer does not receive packets that are sent on an IP-852 channel from one device or router to another if the source or
destination device is not the computer running the protocol analyzer. Figure 7 demonstrates this behavior. In the figure, the protocol analyzer is monitoring an IP-852 channel that contains two devices (named “IP-852 Device 1” and “IP-852 Device 2”). The protocol analyzer receives only those packets sent between the IP-852 devices and the LonScanner computer (the network paths displayed in green). The protocol analyzer does not receive packets sent between IP Device 1 and IP Device 2 (the network path displayed in red).
LonScanner Computer
IP-852 Device 2 IP-852 Device 1
IP-852 Channel
2
Logging Data
This chapter describes how you can log packets with the protocol analyzer, and how you can view statistics related to those packets. The first part of this chapter describes how you can configure the behavior of the protocol analyzer while it monitors a channel and collects packets, including topics such as setting logging preferences, using the Capture and Auto-Scroll features, and filtering packets.
The second part of this chapter describes how to access statistics that are available when you monitor a channel with the protocol analyzer, including data related to bandwidth utilization, the types of packets traveling on the network, and other network statistics.
This chapter also describes how you can use names to identify the devices and network variables on the channel that you are monitoring.
16 Logging Data
Configuring the LonScanner Protocol Analyzer
You can configure the behavior of the protocol analyzer while it monitors a channel, including:
• Setting logging preferences to control how the protocol analyzer collects and record packets from a channel.
• Filtering packets to select which packet types are written to the log file.
• Setting the capture and monitor modes to determine whether the packets collected from the channel are written to the log file, and whether the protocol analyzer automatically refreshes the Packet Log display as data is added to the log.
Setting Logging Preferences
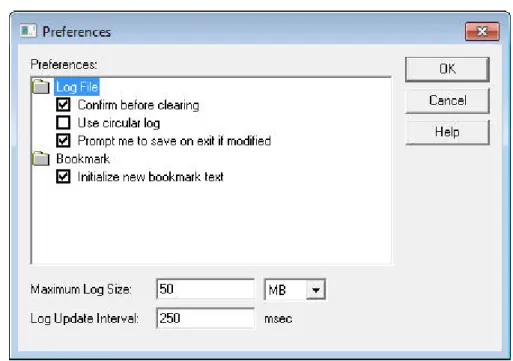
You can use the LonScanner Preferences dialog to determine how the protocol analyzer collects and displays data during a monitoring session. To set logging preferences, perform the following steps:
1. Select File → Preferences to open the Preferences dialog, as shown in Figure 8.
Figure 8. LonScanner Preferences Dialog
2. Specify your preferences. See the online help for descriptions of the fields in this dialog.
Filtering Packets
You can use filters to select the types of packets that are written to the log file. You can use two types of filters:
• A global filter that applies to all packets
• A device filter that applies to packets sent to and from specific devices on the network
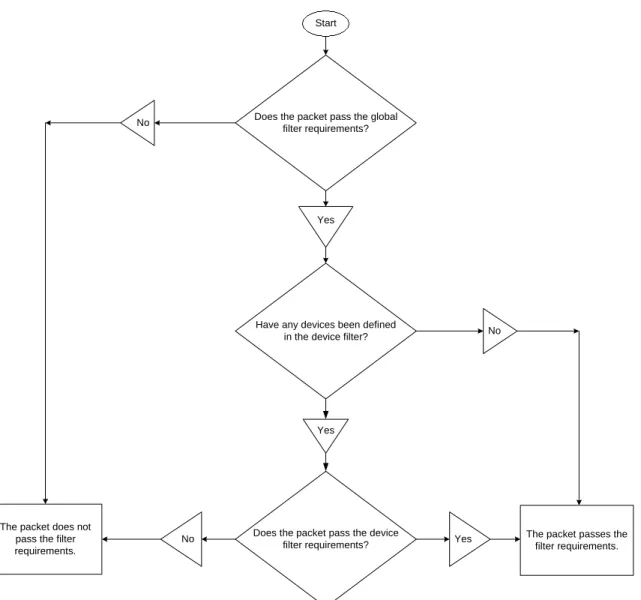
When the protocol analyzer receives a packet from the channel, it uses the global and device filter to determine if the packet passes the filter requirements, as described in Figure 9.
Does the packet pass the global filter requirements?
Have any devices been defined in the device filter?
Does the packet pass the device filter requirements?
Yes
Yes
Yes No
No No
The packet does not pass the filter requirements.
The packet passes the filter requirements. Start
Figure 9. Filtering Packets
Important: Each time you modify the filter settings for a channel, the protocol analyzer automatically saves those settings. Thus, every time you connect to a channel, the protocol analyzer uses the last set of filter settings defined for the channel.
18 Logging Data You can also filter packets with a custom filter file. To create and use a custom filter file, modify the LsCustomFilter.cpp file in the LonScanner Example Custom Filter directory.
Configuring the Global and Device Filters
To configure either the device filter or the global filter, perform the following steps:
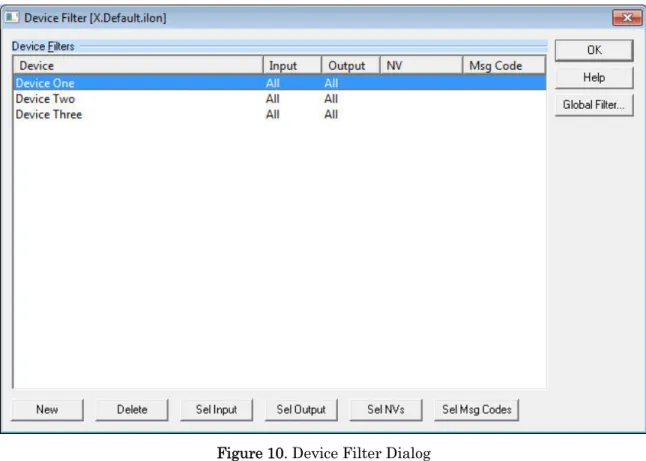
1. Select Filter → Edit Filters to open the Device Filter dialog, as shown in Figure 10.
Figure 10. Device Filter Dialog
2. To include all devices in the filter, skip to step 5. To filter packets addressed to or from a specific device, click New. The Select Device to Add dialog opens, which lists all of the devices that are defined in the current names file. Select a device to add to the filter, and click Add. For more information on names files, see Using Names on page 29.
After you select a device to filter, you return to the Device Filter dialog and the newly added device is listed in the Device list.
3. If you added a device to the filter in the previous step, all packets
addressed to or from the device pass the device filter by default. You can refine the filter by specifying which packets pass the device filter: all packets or network variable packets addressed to the device, or all packets or network variable packets sent by the device.
it in the Device Filters list, and then click one of the buttons at the bottom of the Device Filter dialog:
• New opens the Select Device to Add dialog, as described in step 2.
• Delete removes the selected device from the device filter.
• Sel Input opens the Input Mode dialog. You can use this dialog to specify whether or not packets sent to the selected device should pass the device filter requirements.
• Sel Output opens the Output Mode dialog. You can use this dialog to specify whether or not packets sent from the selected device should pass the device filter requirements.
• Sel NVs opens the Select Network Variables dialog. You can use this dialog to determine which network variable update messages sent to and from the selected device should pass the device filter
requirements. You must define the network variable types in the current names file before adding them to the device filter. For more information on names files, see Using Names on page 29.
• Sel Msg Codes opens the Select Message Codes dialog. You can use this dialog to determine which message codes sent to and from the selected device should pass the device filter. You must define the message codes in the current names file before adding them to the device filter. For more information on names files, see Using Names on page 29.
See the online help for more information about each of these buttons and dialogs. You can bypass these steps if you do not want to filter packets based on their source or destination device.
4. To include other devices in the filter, repeat steps 2 and 3 until the filter includes all of the devices. Filter settings that you define for each device apply only to that device, and not to the other devices in the filter. 5. To define a global filter, click Global Filter to open the Global Filter
dialog, as shown in Figure 11 on page 20. If you do not want to define a global filter, skip to step 10.
20 Logging Data Figure 11. Global Filter Dialog
6. Under Mode, select Capture packets that pass the global and device filters to write packets that pass the requirements of the global and device filters into the Packet Log. Select Discard packets that pass the global and device filters to write packets that do not pass the
requirements into the Packet Log.
7. Select the Both source and destination must pass the device filter checkbox to verify that each packet meets the filter settings for both the source device and the destination device. This setting allows you to filter traffic between a specified pair of devices.
8. Under Good Packets, Bad Packets, and Address Mode, select which packet types should pass the global filter by selecting or clearing the appropriate checkboxes. You can select all packet types by clicking Select All, and clear all packet types by clicking Clear All. See the online help for information about each of the packets types listed on the Global Filter dialog.
9. Click OK to save your changes and return to the Device Filter dialog. 10. Click OK on the Device Filter dialog. The protocol analyzer uses the
updated filter configuration to filter all incoming packets.
You can edit the configuration of the filter file again later by selecting Filter →
Edit Filters, and repeating steps 2 through 10.
You can select Filter → Set to Defaults at any time to revert the filter to the default filter settings.
Importing Filter Settings from a Channel
The protocol analyzer automatically saves the filter settings that you define for a channel each time they are modified. When you modify the filter settings for a channel, the protocol analyzer uses those settings the next time you connect to the channel.
You can import the filter settings for a given channel into another channel. For example, if you use multiple network interfaces to monitor a channel or group of channels, and want them all to use the same filter settings, you can import the filter settings from one network interface to the others.
To import filter settings:
1. Select Filter → Import From Channel. A dialog box opens to remind you that this action overwrites any filter settings defined for the channel. 2. Click Yes to continue. A dialog box opens from which you can select the
network interface that you use to connect to the channel which contains the filter settings that you want to import.
3. Select the network interface from the Interface dropdown list box, or click Add to add a new network interface, and then click OK.
A dialog box opens to inform you that the filter settings have been imported. Click OK to close the dialog box. The protocol analyzer uses the imported filter settings.
Saving Filter Settings for Later Use
You can save the global and device filter settings you create into a filter file so that you can return to those settings later, without having to reconfigure the filter and undo any subsequent changes later. To save the current global and device filter settings into a filter file, select Filter → Save Copy.
After you save a filter file, you can create or import new filter settings as described in the previous sections, and then restore the saved filter settings at any point. To restore your saved filter settings, select Filter → Import From Filter File, and open your saved filter file. The protocol analyzer uses the filter settings defined in the saved filter file. These settings overwrite any previously defined filter settings for the channel.
22 Logging Data
Setting the Capture and Monitor Modes
You can use the Capture and Monitor modes to control whether the packets collected from the channel are written to the log file, whether the Packet Log tab is refreshed as packets are received, and whether the Packet Log tab is
automatically scrolled to display incoming packets.
To record packets collected from the network into the current log file, click the Capture button on the LonScanner toolbar or select Network → Capture Mode. To automatically update the Packet Log tab as packets are collected from the channel, click the Monitor button on the LonScanner toolbar or select Network →
Monitor Mode. When monitoring is disabled, you must manually refresh the Packet Log tab whenever you want to see the most recently collected packets by clicking the Refresh button on the LonScanner toolbar or by selecting View →
Refresh Display.
You can check the status bar to determine whether Capture mode and Monitor mode are enabled. For more information on the status bar, see Using the LonScanner Window on page 11.
To automatically scroll the Packet Log tab to the most recently collected packets, click the Auto-Scroll button on the LonScanner toolbar or select View → Auto-Scroll.
Viewing Channel Statistics and Trend Graphs
You can view channel statistics and trend graphs while you are monitoring a channel to assess overall channel health at a specific point in time, or over a longer period of time. To view channel statistics or trend graphs, click the tabs at the bottom of the main LonScanner window:
• General Statistics. Select the General Statistics tab to view channel statistics, such as the total packets received during the log session, the average packet size received, and the number of packets received per second. The General Statistics tab also displays maximum and cumulative statistics, such as the maximum and average bandwidth utilization percentage and the maximum and average error rate during the session.
• Packet Types. Select the Packet Types tab to view a breakdown of the packet types collected from the monitored channel. For each packet type, the total number of packets of that type that has been collected from the monitored channel is listed, as well as the percentage of the total packet count for each type.
• BWU History. Select the BWU History tab to view a trend graph displaying the bandwidth utilization (by percentage) over time for the monitored channel.
• Err Rate History. Select the Err Rate History tab to view a trend graph displaying the percentage of invalid packets received from the monitored channel over time.
Note: The data displayed on the statistics tabs is calculated based on the packets that pass the global and device filters and are written to the current log file. Packets that are discarded because they do not meet the current filter requirements are not used in the statistics calculations.
Viewing General Statistics
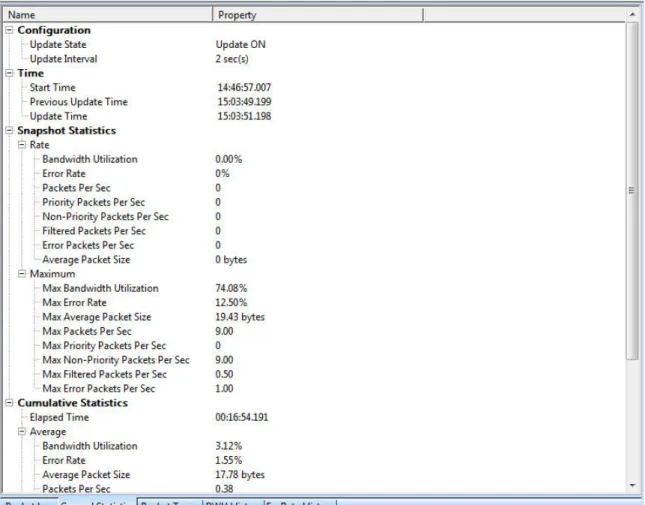
Select the General Statistics tab to view a variety of network statistics, including the total number of packets collected during the current session, the average packet size, and the number of packets received per second. You can also view maximum and cumulative information, such as the maximum and average bandwidth utilization percentage and the maximum and average error rate during the session. See the online help for descriptions of the data fields displayed on the General Statistics tab.
Figure 12 shows the General Statistics tab with example data.
Figure 12. General Statistics Tab
You can control the rate at which the statistics on the display are updated by setting the general update interval with the statistics options dialogs. See Setting Statistics Options on page 26 for more information.
24 Logging Data
Viewing Bandwidth Utilization by Packet Type
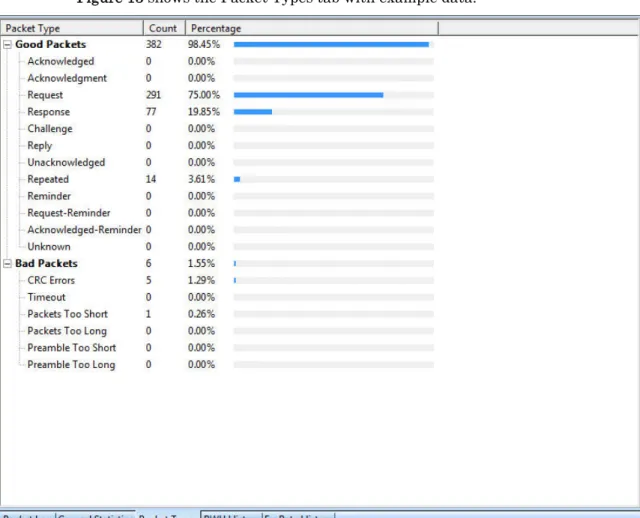
Select the Packet Types tab to view a breakdown of the packet types collected from the monitored channel. The packet types are grouped as good (valid) and bad (invalid) packets. For each packet type, the total number of collected packets of that type is listed. The percentage of the total packet count for each type is also listed. See the online help for descriptions of the packet types listed on the Packet Types tab.
Figure 13 shows the Packet Types tab with example data.
Figure 13. Packet Types Tab
In the figure, all the packets received during the current session have been valid packets. The protocol analyzer adjusts the packet count and percentage figures as additional packets are received from the channel. You can control the rate at which the statistics on the display are updated by setting the general update interval with the statistics options tabs. See Setting Statistics Options on page 26 for more information.
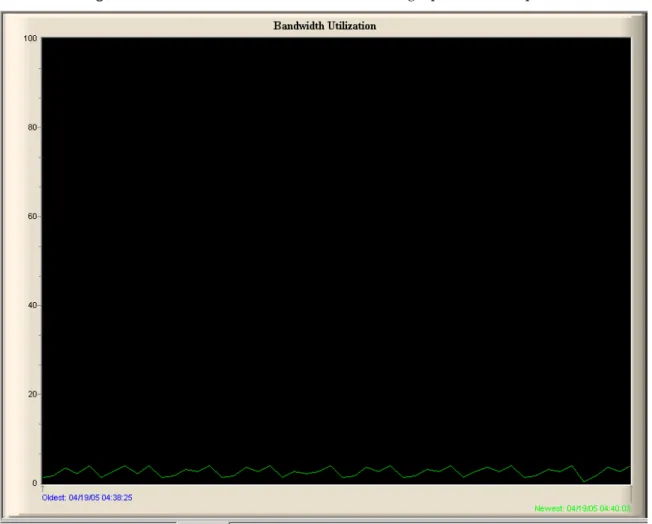
Viewing Bandwidth Utilization History
Select the BWU History tab to view a trend graph that displays the bandwidth utilization (by percentage) of the monitored channel. A well-designed network will not have any peaks in bandwidth utilization that are over 80%.
Figure 14 shows a bandwidth utilization trend graph with example data.
Figure 14. Bandwidth Utilization History Tab
The BWU History tab includes two timestamps: the timestamp for the oldest and the newest update points on the trend graph. You can set the rate at which this display is updated, as well as the number of points that are displayed on the chart, with the statistics options dialogs. See Setting Statistics Options on page 26 for more information.
Viewing Error Rate History
Select the Err Rate History tab to view a trend graph that displays the percentage of invalid packets received from the monitored channel. A well-designed network will not have any peaks in error rate over 4%.
26 Logging Data Figure 15. Error Rate History Tab
The Err Rate History tab includes two timestamps: the timestamp for the oldest and the newest update points on the trend graph. You can set the rate at which this display is updated, as well as the number of points that are displayed on the chart, with the statistics options tabs. See Setting Statistics Options for more information.
Setting Statistics Options
You can configure the statistics options to control how the protocol analyzer collects data from the network and how that data is displayed. To set the statistics options, perform the following steps:
1. Select Statistics → Statistics Options to open the Statistics Options dialog, as shown in Figure 16 on page 27. The General tab displays.
Figure 16. General Tab
2. Configure the settings on the General tab. These settings determine the interval at which the statistics display is updated, and the format that is used to display the statistics. See the online help for descriptions of these fields.
3. Select the Bandwidth Graph tab, as shown in Figure 17.
Figure 17. Bandwidth Graph Tab
4. Configure the settings on the Bandwidth Graph tab. These settings determine the number of historical points that are displayed on the
28 Logging Data Bandwidth Utilization chart, whether logarithmic scaling should be used for the chart, and the colors that are used to display the chart. See the online help for descriptions of these fields.
5. Select the Error Graph tab, as shown in Figure 18.
Figure 18. Error Graph Dialog
6. Configure the settings on the Error Graph tab. These settings determine the number of historical points that are displayed on the Error Rate History chart, whether logarithmic scaling should be used for the chart, and the colors that are used to display the chart. See the online help for descriptions of these fields.
7. Click OK to save your changes and close the dialog. Or, click Apply to save your changes and continue editing the statistics options settings. You can click Defaults at any time to return the settings to their default values.
8. To choose the channel type that you are monitoring, select Statistics →
Channel Type. The Channel Type dialog opens, as shown in Figure 19 on page 29.
Figure 19. Channel Type Dialog
9. Select the channel type and bandwidth utilization options for the channel that you are monitoring and click OK. These settings are important for calculating bandwidth utilization because the available bandwidth is determined by the channel type.
When you begin monitoring a channel, the protocol analyzer attempts to determine the channel type automatically. If the protocol analyzer cannot determine the channel type, the Channel Type dialog opens to remind you to select the correct channel type.
Using Names
You can assign names to devices, network variables, domains, groups, and message codes on the channel that you are monitoring. The domain and group assignments associated with a network are used to determine to which devices a given packet should be sent, and to identify to which part of the network a device belongs. For more information about domains, groups, and the rest of the
ISO/IEC 14908-1 control networking protocol, see the Introduction to the LONWORKS Platform.
30 Logging Data Names are not included in the packets sent over the network, nor are they saved in log files. However, you can use names to identify the devices that are sending or receiving messages on the channel that you are monitoring, to identify the network variables that are being updated by these messages, or to identify the domains and groups that exist on your network.
When you start a LonScanner session, you can import names from an LNS database or from another channel. You can also manually add and customize names. You can import and modify names at any time, for example, when you are actively monitoring a channel or when you are viewing a saved log file. When you import or create a set of names for a channel, the protocol analyzer saves those names in a channel names file. These names are used each time you open a connection to that channel, even after you have stopped and re-started the protocol analyzer. The channel names file is updated and saved automatically each time you modify the names that apply to a channel.
You can also save the names into a local names file on your computer after you import or create a set of names to use. You can import the names saved in the file and use them at any time, for example, if you are using multiple network interfaces to monitor the same network. You could define one names file that contains all the names for the network, and then import the names from that file whenever you start a LonScanner session with any of the network interfaces on that network. You can also copy the local names file to another computer with the protocol analyzer, and then import the names file on the second computer.
Importing Names
This section describes how to import names from an LNS database, a local names file, or a channel names file.
Importing Names from an LNS Database
You can import the names that are stored an LNS database for your network. The network database must be stored on the same computer as the protocol analyzer, and you must have an LNS Turbo Edition Server or an LNS 3 Server installed on the computer.
To import names from an LNS database, perform the following steps:
1. Select Names → Import from LNS Database to open the LNS Names Import Wizard, as shown in Figure 20 on page 31.
Figure 20. LNS Names Import Wizard – Page One
2. Select the LNS database that contains the names that you want to import from the LNS Database Name dropdown list box, and click Next. The second page of the wizard displays, as shown in Figure 21 on page 32.
32 Logging Data Figure 21. LNS Names Import Wizard – Page Two
3. Select the subsystem (or subsystems) that contains the names that you want to import from the Available Subsystems list. Alternatively, you can click Select All to select all subsystems, or click Select Subtree to select all
subsystems within the currently selected subsystem. Click Next to continue. The third page of the wizard displays, as shown in Figure 22 on page 33.
Figure 22. LNS Names Import Wizard – Page Three
4. As the names are imported, it is possible that the names stored in the LNS database could conflict with names that you have previously imported or assigned. These conflicts can occur under the following circumstances:
Two domains have the same ID.
Two devices or router sides in the same domain have the same Neuron®
ID.
Two devices or router sides in the same domain have the same subnet/node address.
Two network variables belonging to the same device have the same index.
Two network variables belonging to the same device have the same direction and selector.
Select Use LNS Database Name or Use Original Name to automatically use the name from the LNS database or from the current names file when a conflict occurs. Select Prompt for Each Conflict to be prompted each time a conflict is detected, allowing you to decide on a case-by-case basis.
Click Next. The fourth page of the wizard displays, as shown in Figure 23 on page 34.
34 Logging Data Figure 23. LNS Names Import Wizard – Page Four
5. Select a format for device and network variable names. Examples for each option are shown on the dialog.
6. Click Next. The LonScanner software imports the names from the LNS database. When it finishes the import, a completion dialog appears. Click Finish to exit the wizard. You can also click Save from the completion dialog to save the imported names into an .RTF file.
7. You can now use the imported names. You can also use the Names menu to add new names, or to customize the ones that you imported. See Creating and Customizing Names on page 36 for more information.
Importing Names from a Local Names File
You can import names from a local names file on your computer. Names files contain predefined sets of names. You can create a names file by importing names from an LNS database or from a network channel, and then saving them to a file. You can also create a names file manually. See Managing Names Files on page 41 for information about how to save names files.
A names file can be useful if you are using multiple network interfaces to monitor the same network. You could define one names file containing all the names for the network, and then import the names from that file whenever you start a LonScanner session with any of the network interfaces on that network. To import names from a names file, perform the following steps:
1. Select Names → Import from Names File. A dialog opens to remind you that names that you are currently using will be overwritten.
2. Click Yes to continue. The Windows Open dialog opens.
3. Browse for the names file that you want to use, and click Open to import the names.
4. You can now use the imported names. You can also use the Names menu to add new network object names or to customize the ones you imported. See Creating and Customizing Names on page 36 for more information.
Importing Names from a Channel
The protocol analyzer saves the names created for a channel as the default names for that channel in a channel names file. The channel names file is updated automatically each time a name is added to or removed from a channel. The names defined in the channel names file are used each time you open a connection to that channel, even after you have stopped and re-started the protocol analyzer.
You can import names from one channel to another, if you want multiple channels to use the same set of names. When you import these names into a channel, the protocol analyzer clears all the names currently being used for that channel from memory.
To import names from a channel names file, perform the following steps:
1. Select Names → Import from Channel. A dialog opens to remind you that the names that you are currently using will be overwritten.
2. Click Yes to continue. The Select a Channel dialog opens, as shown in Figure 24.
Figure 24. Select a Channel
3. Select the network interface that you are using to connect to the channel from which you want to import the names, and click OK to import the names.
You can now use the imported names. You can also use the Names menu to save the imported names file for later use, or to add new network object names and customize the ones that you imported. For more information on this, see Creating and Customizing Names on page 36 for more information.
36 Logging Data
Creating and Customizing Names
You can use the Names menu to create your own names, or to customize the names that you already created.
Creating Group Names
You can create or change an ISO/IEC 14908-1 group name with the protocol analyzer. To create a group name, perform the following steps:
1. Select Names → Edit Groups to open the Select Group dialog, as shown in Figure 25.
Figure 25. Select Group Dialog
2. Select a domain from the Domains list. The groups that have been assigned names in that domain (if any) are listed in the Groups list. To create new group name, click New. The New Group dialog opens, as shown in Figure 26.
Figure 26. New Group Dialog
3. Select the domain that contains the group from the Domain dropdown list box.
4. Enter the group ID for the group in the Group Number field, and enter the name for the group in the Group Name field.
5. Click OK to close the New Group dialog and return to the Select Group dialog.
6. The new group name is listed in the Groups list. You can edit the group name by selecting it and clicking Edit. You can delete the group name by selecting it and clicking Delete.
7. Click OK to close the dialog.
Creating Device Names
You can create or change a device name based on ISO/IEC 14908-1 subnet and node IDs. To create or edit a device name, perform the following steps:
1. Select Names → Edit Devices to open the Select Device dialog, as shown in Figure 27.
Figure 27. Select Device Dialog
2. Select a domain from the Domains list. The devices that have been assigned names in that domain are listed in the Devices list. To add a new device name, click New. The New Device Data dialog opens, as shown in Figure 28 on page 38.
38 Logging Data Figure 28. New Device Data Dialog
3. Enter the device’s name in the Device Name field, and then fill in the rest of the fields in the New Device Data dialog. See the online help for information about these fields.
4. Click OK to close the New Device Data dialog and return to the Select Device dialog. The new device name is listed in the Devices list. You can edit the device name by selecting it and clicking Edit. You can delete the device name by selecting it and clicking Delete.
5. Click OK to close the dialog.
Creating Message Code Names
You can create or change an ISO/IEC 14908-1 message code name, and you can optionally specify formatting for a message. To create message code names, perform the following steps:
1. Select Names → Edit Message Codes to open the Edit Message Codes dialog, as shown in Figure 29 on page 39.
Figure 29. Edit Message Codes Dialog
2. The Edit Message Codes dialog lists all currently defined message code names. To create a new message code name, click New. The New Message Code dialog opens, as shown in Figure 30.
Figure 30. New Message Code Dialog
3. Enter the name of the message code, and the message code to which the new name should apply. See the online help for more information on these settings.
4. Click OK to close the New Message Code dialog and return to the Edit Message Codes dialog. The new message code name is listed in the dialog. You can edit the message code name by selecting it and clicking Edit. You can delete the message code by selecting it and clicking Delete.
5. Click OK to close the dialog.
Creating Domain Names
You can create or change an ISO/IEC 14908-1 domain name with the protocol analyzer. To create domain names, perform the following steps:
1. Select Names → Edit Domains to open the Select Domain dialog, as shown in Figure 31 on page 40.
40 Logging Data Figure 31. Select Domain Dialog
2. The Select Domain dialog lists the domain names that are currently defined in your network. To create a new domain name, click New. The New Domain dialog opens, as shown in Figure 32.
Figure 32. Edit Domain Dialog
3. Enter a name for the domain in the Domain Name field, and set the domain ID and length for the domain. See the online help for more information about these fields.
4. Click OK to close the New Domain dialog and return to the Select Domain dialog. The new domain name is listed in the dialog. You can edit the domain name by selecting it and clicking Edit. You can delete the domain name by selecting it and clicking Delete.
Managing Names Files
You can save names that you have created, edited, or imported for later use by saving them into a names file. When you create, edit, or import names, the protocol analyzer starts using those names immediately. You can save the names to a names file to prevent changing them in future LonScanner sessions or to share them with other channels. You can also backup the names file for safekeeping, and you can copy the names file to another computer that has the LonScanner software installed so that you can interpret names within a packet log on the second computer.
To manually save the names into a names file, select Names → Save Copy to open the Save File dialog, from which you can select the file name and directory for the names file. After you save the names file, you can back it up, copy it to another computer, or import it for use in future LonScanner sessions, as described in Importing Names from a Local Names File on page 30.
3
Analyzing Packet Log Details
This chapter describes how to organize and analyze the data stored in your log files, including how to search a log file for a specific packet, how to bookmark certain packets as being of interest, and how to format the data in the Packet Log tab for display. It also describes how to print and export log files.
You can use the features described in this chapter when viewing a saved log file, or when viewing an active log file.
44 Analyzing Packet Log Details
Searching For Packet Log Entries
You can quickly search a packet log to find a specific packet, even if your log file contains log entries for hundreds or even thousands of packets. You can search a log file for a string or for a specific packet number.
Searching By String
You can search any of the fields listed in the Packet Log tab for a specific string by performing the following steps:
1. Select Edit → Find to open the Find String dialog, as shown in Figure 33.
Figure 33. Find String Dialog
2. Enter the string you want to find in the Find String field.
3. Select the data fields that you want to search by selecting the appropriate checkboxes in the Fields area. For example, select the Data checkbox to search the data field of every packet in the log.
Click one of the Direction buttons to determine whether you want to search upwards or downwards through the log. The search starts from the currently selected log entry.
See the online help for descriptions of the fields in the dialog.
4. Click Find Next to find the next occurrence of the string in the log file. Then, you can use the Edit → Find Next and Edit → Find Prev commands to find additional occurrences of the same string with the same search conditions, without having to use the Find String dialog.
You can highlight each log entry containing the string in the Packet Log by clicking Highlight All. You can clear the highlights by clicking Clear Highlights.
For an active log, you can turn off autoscrolling so that you can see the highlighted log entry (or entries) that matches your find request.
The LonScanner toolbar also includes buttons you can use to find a string, and to move to the next occurrence of a string once you have begun a search. For more information on the LonScanner toolbar, see LonScanner Toolbar on page 12.
Searching By Log Number
You can find a particular log entry by searching for its log packet number or its arrival sequence number. The log packet number is the number currently assigned to the packet in the log. If you are using a circular log, this number could change as log entries are added to and removed from the log. The arrival sequence number is a unique number assigned to the packet when the protocol analyzer collects it from the channel, and it does not change.
To search for a log entry by its log packet or arrival sequence number, perform the following steps:
1. Select Edit → Go To to open the Go to Packet dialog, as shown in Figure 34.
Figure 34. Go to Packet Dialog
2. Select Log Packet Number to search for a packet by its log packet number. Select Arrival Sequence Number to search for a packet by the sequence number assigned to the packet when the protocol analyzer received it.
3. Enter the packet or sequence number in the Number field, and click OK. The Packet Log tab scrolls to the specified packet.
For an active log, you can turn off autoscrolling so that you can see the highlighted log entry.
Bookmarking Packet Log Entries
You can use bookmarks to mark specific log entries as being of interest, so that they are easier to find in the log. When you bookmark a log entry, that log entry is highlighted in the Packet Log tab, so that it stands out. After you create a set of bookmarks, you can scroll through the log from one bookmarked packet to the next bookmarked packet.