Biennial Transfer
sTudenT reporT
2003-04 and 2004-05 Academic Years
Office of Institutional Effectiveness
May 2008
Biennial Transfer Student Report
2003-04 and 2004-05 Academic Years
Office of Institutional Effectiveness
June 2008
BIENNIAL TRANSFER STUDENT REPORT 2003-04 AND 2004-05 ACADEMIC YEARS
EXECUTIVE SUMMARY
In order to evaluate Tidewater Community College’s (TCC) effectiveness in preparing students for transfer, the Office of Institutional Effectiveness publishes the Transfer Student Report each biennium. This report provides an analysis of TCC students who transferred to four-year institutions in fall 2003 or in fall 2004. To determine the impact that a student’s education at TCC had on performance at the transfer institution, the student must have completed 12 or more credits at TCC prior to transferring, and the student must have been enrolled at TCC during the year immediately preceding transfer. Major findings from this study revealed the following:
• Slightly over 4,500 TCC students were enrolled at over 350 four-year colleges across the United States. Of these transfers, 1,452 (32%) graduated TCC prior to transfer while 3,055 (68%) did not.
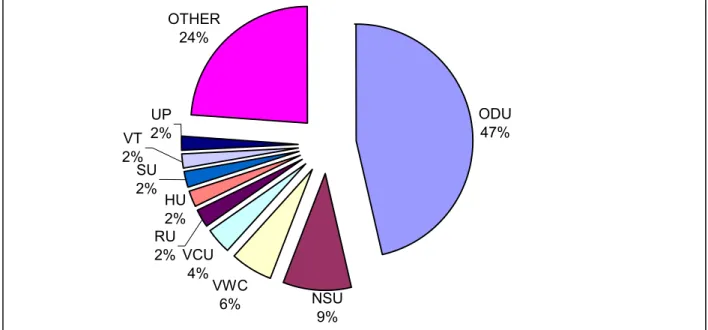
• Nearly one-half (47%) of all TCC transfers enrolled at Old Dominion University (ODU). The next two schools with the largest number of transfers, Norfolk State University (NSU; 9%) and Virginia Wesleyan College (VWC; 6%) are also located within the college’s service region.
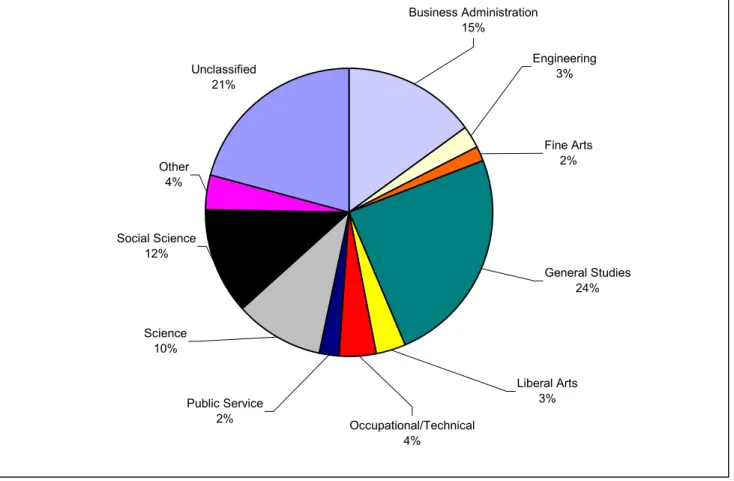
• Prior to transferring to a four-year institution, the majority (67%) of transfer students were enrolled in a college transfer degree program with the highest concentrations in General Studies (25%) and Business Administration (15%). Twenty-one percent (21%) of the transfers were unclassified while attending TCC, and 12% were enrolled in
occupational/technical programs. • After transferring, students most frequently declared majors in the areas of Business (23%),
Liberal Arts (19%), Health/Medicine (11%), and Public Service (9%).
• In terms of gender and ethnicity, transfer students generally mirrored the TCC student population as a whole. Thirty-eight percent (38%) of all transfers were minority, compared to 43% of the TCC student body, and 63% of all transfers were female, compared to 62% of the TCC student body.
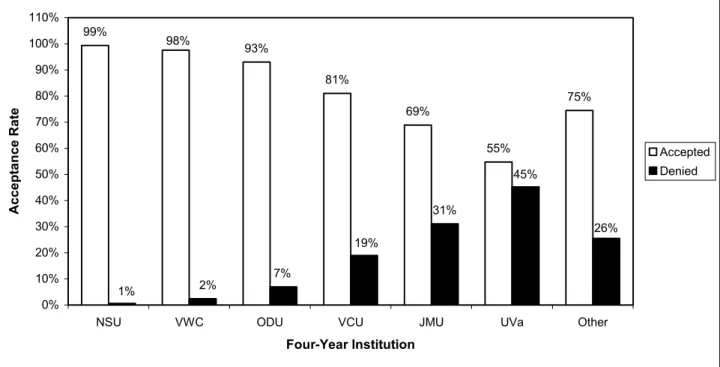
• Generally, acceptance rates for TCC graduates were equal to or higher than rates for non-graduates. NSU, VWC, and ODU had the highest acceptance rates of TCC students (99%, 98%, and 94%, respectively). For students who were accepted at a four-year institution, NSU had the highest enrollment rate of TCC students (91%) and VWC had the lowest (67%).
• TCC students tended to experience “transfer shock” after enrolling at a four-year institution, a phenomenon cited repeatedly in the academic literature. The average GPA (Grade Point Average) of transfer students at TCC was 3.10, but decreased to an average of 2.70 after transfer. The average GPA of TCC transfer students at the four-year institutions ranged from 2.25 at George Mason University (GMU) to 3.17 at the University of Virginia (UVa). A decline in GPA was found at all 11 universities reporting data, with the largest occurring for those students enrolled at VWC (-0.95), GMU (-0.87), and Christopher Newport University (CNU; -0.81).
• Similar to what has been reported in previous transfer reports, TCC graduates had a higher average GPA at the four-year institutions (2.83) compared to non-graduates (2.57).
• Students who did not enroll in a developmental English course at TCC had considerably higher cumulative GPAs at both TCC and at the four-year institutions to which they transferred. The same was true with respect to developmental mathematics, though not nearly to the same extent.
• According to the most recent Transfer Survey, 49% of respondents indicated that their goal was to graduate from TCC and then transfer to a four-year college or university. Thirty-three percent (33%) indicated that their goal was to transfer without receiving a degree from TCC. Two-thirds of the respondents reported that they did graduate from TCC prior to transfer. • Students are increasingly satisfied with their preparation for the academic environment of a
four-year institution: 86% of respondents indicated that they were prepared compared with 86% in the 2003 survey and 78% in the 2001 survey.
• Seven of the eight services offered to students for program planning were used by the majority of students responding to the transfer survey, with academic counseling and the college catalog having usage rates of 85% or higher.
• Eighty-six percent (86%) of survey respondents rated their transfer experience as excellent, very good, or good. Reflective of the overall high degree of satisfaction with their experience and preparation while at TCC, 94% of students indicated that they would recommend TCC to other potential students.
•
Transfer students clearly held very positive self-perceptions of success, which appear consistent with the academic performance data analysis cited in this report. TCC is providing a quality two-year foundation for its students who elect to pursue the baccalaureate degree.TABLE OF CONTENTS
List of Figures and Tables... iv
Introduction ...01
Transfer Student Profile ...02
TCC Students at Four-Year Institutions ...02
Declared Majors at Four-Year Institutions...03
Ethnicity...03
Gender and Age...04
Degree Type, Curriculum, and Developmental Education Prior to Transfer ...05
Performance Data Analysis ...06
Acceptance Rates ...06
Acceptance Rates by TCC Graduate Status...07
Enrollment Rates...08
Grade Point Averages...08
GPA by Ethnicity ...09
GPA by TCC Graduate Status ... 10
GPA by TCC Degree Type... 10
GPA by TCC Curriculum ... 11
Developmental English Success... 11
Developmental Mathematics Success ... 12
Performance Data Analysis of Top Three Transfer Schools... 13
Old Dominion University... 14
Norfolk State University... 15
Virginia Wesleyan College ... 16
Transfer Survey Analysis ... 17
Sample Size and Data Source ... 17
Findings... 17
Conclusion ... 19
APPENDICES Appendix A: Four-Year Institution Abbreviations ... 21
LIST OF FIGURES AND TABLES FIGURES
FIGURE 1. Percentage of Transfer Students by Four-Year Institution (2003-2005)...02
FIGURE 2. Percentage of Transfer Students by Categories of Majors at Four-Year Institutions .03 FIGURE 3. Percentage of Transfer Students by Ethnicity ...03
FIGURE 4. Percentage of Transfer Students by Gender...04
FIGURE 5. Percentage of Transfer Students by Age ...05
FIGURE 6. Percentage of Transfer Students by TCC Curriculum ...06
FIGURE 7. Acceptance Rates of TCC Students at Four-Year Institutions ...07
FIGURE 8. Enrollment Rates of TCC Students Accepted at Four-Year Institutions ...08
FIGURE 9. GPA at TCC and Four-Year Institutions ...09
FIGURE 10. GPA at TCC and Four-Year Institutions by Ethnicity...09
FIGURE 11. GPA at TCC and Four-Year Institutions by TCC Curriculum... 110
FIGURE 12. Grade Distribution in English Courses at Four-Year Institutions by Enrollment in Developmental English... 12
FIGURE 13. Grade Distribution in Mathematics Courses at Four-Year Institutions by Enrollment in Developmental Mathematics ... 13
FIGURE 14. Majors at Old Dominion University ... 14
FIGURE 15. Majors at Norfolk State University ... 15
FIGURE 16. Majors at Virginia Wesleyan College... 16
TABLES TABLE 1. Percentage of Transfer Students at Four-Year Institutions by Ethnicity ...04
TABLE 2. Acceptance Rates at Four-Year Institutions by TCC Graduate Status...07
TABLE 3. GPA at Four-Year Institutions by TCC Graduate Status ... 10
TABLE 4. GPA at TCC and Four-Year Institutions by TCC Degree Type ... 10
TABLE 5. GPA at TCC and Four-Year Institutions by Enrollment in Developmental English .... 11
TABLE 6. GPA at TCC and Four-Year Institutions by Enrollment in Developmental Mathematics ... 13
TABLE 7. GPA at TCC and ODU by Graduate Status... 15
TABLE 8. GPA at TCC and NSU by Graduate Status ... 16
TABLE 9. GPA at TCC and VWC by Graduate Status ... 16
TABLE 10. Usage and Satisfaction Rates with TCC Resources for Program Planning ... 18
BIENNIAL TRANSFER STUDENT REPORT 2003-04 AND 2004-05 ACADEMIC YEARS INTRODUCTION
A critical component of the mission core of Tidewater Community College (TCC) is to prepare students for successful completion of a baccalaureate degree. Currently, about one-half of all students enrolled at TCC do graduate with the intent to transfer to a four-year institution. To assess the college’s effectiveness in preparing students for transfer, perceptual and performance data was collected and analyzed for students who transferred to a four-year institution in Virginia in fall 2003 and in fall 2004. Students’ opinions of the transfer process were gathered from the 2005 Transfer Survey, while performance data were compiled from Virginia institutions that provided data via the Guideline 8 agreements.
In all previous transfer reports, data were only available directly from Virginia public institutions of higher education through what was commonly referred to as Guideline 8, a requirement established by the State Council of Higher Education for Virginia (SCHEV) in 1995 requiring aggregated data from all four-year institutions to which five or more students from a community college transferred. To be included in Guideline 8 data, these students must have completed a minimum of 12 credit hours from the community college and must have been enrolled there during the year immediately preceding transfer. While the Guideline 8 data were used in this report to collect academic performance data, such as grades and grade point averages (GPAs), information on transfer students is now available from the National Student Clearinghouse (NSC), a private organization which collects data from four-year institutions throughout the country and for an annual fee makes these available to participating community colleges. Because data on a much larger number of TCC transfer students is available from the NSC, and because these data provide transfer information from colleges and universities outside Virginia, as well as from in-state schools, the methodology used in TCC transfer studies was changed to use the data collected from the National Student Clearinghouse in addition to Guideline 8 data.
This report is organized into three major components. The first component describes the basic characteristics and demographic profile of the transfer students. Baseline data are provided on the number of transfer students at a number of different four-year institutions, declared majors at these institutions, ethnicity, degree type and curriculum prior to transfer, and enrollment status in developmental education.
The second component addresses performance data of transfer students while attending TCC and after transfer to four-year institutions. These data were collected from Virginia public four-year colleges and universities using Guideline 8. Critical performance data presented include acceptance rates, enrollment rates, and grade point averages. Data are disaggregated and further analyzed by ethnicity, TCC graduate status, degree types, curricula/programs, and enrollment in developmental education. Additional analysis is provided for the three four-year institutions that enrolled the highest number of TCC transfer students.
The final component provides perceptual data based on a survey of transfer students aimed at capturing students’ opinions about the transfer process. Surveys were mailed in spring 2005 to students who entered a four-year institution during the 2003-2004 academic year, as indicated by the four-year institutions. This third component describes the survey sample size, data source, and findings. Together, the three major components provide a broad perspective from which to examine the transfer process.
TRANSFER STUDENT PROFILE
A review of NSC data revealed that 4,507 TCC students were enrolled at over 350 four-year colleges across the United States. Of these transfers, 1,452 (32%) had graduated from TCC prior to transfer while 3,055 (68%) did not.
Because of the methodological change in data collection, the number of transfer students analyzed in this report represents a considerable increase (+367%) from the previous study (2001-2003) where a total of 1,226 transfer students were reported. The number of four-year institutions (n=349) represents even a larger increase (+2,181%) from the previous report, in which 16 in-state institutions were reported.
TCC Students at Four-Year Institutions
Based upon the data provided by NSC, 4,507 TCC students were enrolled at 349 different four-year institutions. Appendix A provides a list of all of these institutions. As seen in Figure 1, nearly one-half of all TCC students (n=2,092) transferred to Old Dominion University (ODU). Norfolk State University (NSU) was the second largest transfer institution (n=420), followed by Virginia Wesleyan College (VWC) with 266 transfers. Virginia Commonwealth University (VCU) was the fourth largest transfer institution (n=170), followed by Regent University (RU; n=103) and Hampton University (HU; n=102).
ODU 47%
VWC 6% VCU
4% HU 2%
OTHER 24%
NSU 9% RU
2% SU 2% VT 2%
UP 2%
FIGURE 1. Percentage of Transfer Students by Four-Year Institution (2003-2005)
Other schools to which 10 or more TCC students transferred were Strayer University-Washington (n=96), Virginia Tech (n=94), the University of Phoenix (n=92), James Madison University (n=70), Radford University (n=49), Christopher Newport University (n=46), the University of Virginia (n=46), the University of Maryland (n=43), George Mason University (n=36), the College of William & Mary (n=33), Liberty University (n=33), Troy State University (n=33), Longwood University (n=23), Eastern Virginia Medical School (n=18), East Carolina University (n=15), Embry-Riddle Aeronautical University (n=14), Columbia College (n=11), and Southern Illinois University (n=10). As is evident from these numbers, the vast majority of TCC students transfer to schools within the Commonwealth of Virginia.
Declared Majors at Four-Year Institutions
After transferring to a four-year institution, TCC students declared majors in a wide variety of different subjects. Figure 2 displays the categories of majors declared by students. The most frequently declared majors were in the areas of Business (23%), Liberal Arts (19%), Health/Medicine (11%), and Public Service (9%). At ODU, the institution to which the majority of TCC students transferred, the most frequent majors were Health/Medicine (20%), Interdisciplinary Studies (13%), and Public Service (11%).
Business 23%
Liberal Arts 19%
Health/Medicine 11% Public Service
9% Interdisciplinary
8% Undecided
7% Science/Math
7%
Education 5%
Arts 4%
Info. Science 2% Engineering
5%
FIGURE 2. Percentage of Transfer Students by Categories of Majors at Four-Year Institutions Ethnicity
Figure 3 illustrates the ethnic background of TCC students who transferred to a four-year institution. The majority (62%) of these students were Caucasian. The percentage of African-American transfer students was 25% and the number of students in other ethnic categories was 13%. As can be seen, these percentage figures were similar to those of all students attending TCC (Caucasian= 57%; African-American= 29%; Other= 13%).
57% 29%
13%
62% 25%
13%
0% 20% 40% 60% 80% Caucasian
African-American
Other
Transferred TCC
Table 1 presents the percentages of transfers to each of the top seven four-year institutions by ethnicity. While overall, Caucasian students were the largest group of transfers, the ethnicity rates varied somewhat for the different institutions. At both NSU and HU, over half of all transfers were African-American.
Ethnicity
Four-Year Institution Caucasian
African-American Hispanic Asian
American
Indian Other
ODU (n=2,092) 69% 16% 4% 8% 0% 3%
NSU (n=420) 18% 71% 2% 6% 0% 3%
VWC (n=266) 75% 15% 3% 5% 0% 2%
VCU (n=170) 55% 26% 2% 16% 0% 1%
RU (n=103) 56% 35% 5% 2% 0% 2%
HU (n=102) 26% 54% 15% 3% 0% 2%
VT (n=94) 78% 11% 0% 11% 0% 0%
Total (n=4,507) 62% 24% 3% 8% 0% 3%
TABLE 1. Percentage of Transfer Students at Four-Year Institutions by Ethnicity Gender and Age
As can be seen in Figure 4, the percentages of males and females transferring from TCC to four-year colleges and universities were almost identical to the percentages of students attending TCC. Nearly two-thirds of all students attending TCC and transferring were female and slightly over one-third were male.
62% 63%
38% 37%
0% 10% 20% 30% 40% 50% 60% 70% TCC
Transferred
Female Male
FIGURE 4. Percentage of Transfer Students by Gender
Less than one-half of all TCC students transferring to four year schools were traditional aged college students. Forty-one percent were 23 years of age or younger, while 59% were over the age of 23. Interestingly, when examining where students transfer, a different picture emerges. As can be seen in Figure 5, less than 40% of those students transferring to colleges and universities within the Tidewater region were traditional aged college students, while nearly half of those transferring to institutions outside the Tidewater region were traditional aged.
39%
46%
54% 61%
0% 10% 20% 30% 40% 50% 60% 70%
Within Area Out of Area
<=23 >=24
FIGURE 5. Percentage of Transfer Students by Age
Degree Type, Curriculum, and Developmental Education Prior to Transfer
The majority of TCC transfer students (79%) were enrolled in one of the college’s degree programs before transfer. The Associate in Arts (AA) and Associate in Science (AS) degree programs are designed to prepare students for transfer. The Associate in Applied Science (AAS) degree programs and certificate programs can also lead to transfer; however, they are considered occupational/technical in nature and designed to prepare students for specific career fields. Students are categorized as “unclassified” if not enrolled in a particular degree or certificate program (e.g., coursework for personal satisfaction, career exploration, upgrading employee skills, and non-degree transfer).
Prior to attending a four-year institution, 67% of transfer students were enrolled in a college transfer degree program with 63% in an AS degree program and 4% in an AA degree program. Twelve percent (12%) were enrolled in an occupational/technical program (AAS/Certificate), and 21% were unclassified.
Approximately 32% (n=1,452) of transfer students completed a degree at TCC prior to transferring to a four-year institution, while 68% did not (n=3,066). While this was a large decrease from the 49% cited in the 2002-2004 transfer period, the difference is most likely due to the different methodology used in this study.
TCC students were enrolled in various curricula before transferring to a four-year institution. These are shown below in Figure 4. The greatest numbers of transfers were enrolled in General Studies (25%) and Business Administration (15%), though 21% of the transfer students were unclassified while attending TCC.
FIGURE 6. Percentage of Transfer Students by TCC Curriculum (
Twenty-six percent (26%) of all transfer students enrolled in developmental English during the 2003-2005 reporting period. Forty-five percent (45%) of TCC transfer students enrolled in developmental mathematics.
PERFORMANCE DATA ANALYSIS Acceptance Rates
The vast majority (88%) of TCC students seeking admission to four-year colleges and universities were accepted by the institutions to which they applied. Acceptance rates at the six institutions with the largest number of accepted and denied students are shown in Figure 7. As can be seen, over 90% of TCC transfer students were accepted by NSU (99%), VWC (98%), and ODU (93%). High percentages were reported by Virginia Commonwealth University (VCU; 81%) and James Madison University (JMU; 69%). Slightly over one-half of all TCC students applying to the University of Virginia (UVa; 55%), perhaps the most selective of all of these institutions, were accepted.
Unclassified 21%
Other 4%
Social Science 12%
Science 10%
Public Service
2% Occupational/Technical 4%
Liberal Arts 3%
General Studies 24% Fine Arts
2% Engineering
3% Business Administration
99%
93%
81%
55%
75%
31% 69% 98%
26% 45%
19% 7%
2% 1%
0% 10% 20% 30% 40% 50% 60% 70% 80% 90% 100% 110%
NSU VWC ODU VCU JMU UVa Other
Four-Year Institution
Accept
a
n
ce Rat
e
Accepted Denied
FIGURE 7. Acceptance Rates of TCC Students at Four-Year Institutions Acceptance Rates by TCC Graduate Status
As previously mentioned, approximately one-third of all transfer students earned a degree at TCC prior to transferring to a four-year institution. To evaluate the importance of obtaining a degree from TCC, acceptance rates at each of the four-year institutions mentioned in the previous section were disaggregated by graduate status. Analysis of acceptance data by graduate status yielded varied rates by school. As shown in Table 2, acceptance rates for graduates were equal to or higher than non-graduates at most of the institutions reporting these data. As was the case in the last transfer study, VCU was an exception, as the acceptance rate for TCC graduates was only 77% while that for non-graduates was 83%. UVa was also an exception as only 46% of graduates were accepted compared to 60% of non-graduates. Finally, NSU had a higher acceptance rate among non-graduates than among graduates, but this was due to only one TCC student not being accepted by NSU while the remaining 159 were accepted.
Acceptance Rate
(Number Applied/Number Accepted) Four-Year Institution
Graduate Non-Graduate Total
Norfolk State University 98% (n=60) 100% (n=100) 99% (n=160)
Virginia Wesleyan College 100% (n=176) 96% (n=187) 98% (n=363)
Old Dominion University 98% (n=826) 88% (n=730) 93% (n=1,555)
Virginia Commonwealth University 77% (n=20) 83% (n=57) 81% (n=77)
James Madison University 87% (n=39) 56% (n=34) 69% (n=73)
University of Virginia 49% (n=19) 60% (n=27) 55% (n=46)
Other 54% (n=51) 61% (n=88) 77% (n=139)
Enrollment Rates
Figure 6 displays enrollment rates, or the percentage of students that were accepted and subsequently enrolled, for each of the institutions shown in the previous figure. As can be seen, the majority of TCC students did enroll at the institutions at which they were accepted. Enrollment rates were fairly consistent across all institutions, with percentage figures ranging from 91% at NSU to 67% at VWC. The average enrollment rate for all TCC transfers was 76%.
91%
78% 77%
74%
70% 67% 74%
9%
22% 23% 26%
30% 33%
26%
0% 10% 20% 30% 40% 50% 60% 70% 80% 90% 100% 110%
NSU VCU ODU UVa JMU VWC Other
Four-Year Insitution
E
n
ro
llm
en
t R
a
te
Accepted and Enrolled
Accepted and Not Enrolled
FIGURE 8. Enrollment Rates of TCC Students Accepted at Four-Year Institutions Grade Point Averages
Academic literature often cites the term transfer shock to describe the difference in academic performance as students progress from community colleges to four-year institutions (Laanan, 2001)1. Similar to findings noted in previous reports, students experienced a slight
decline in average GPA after transferring to four-year institutions; the average GPA at TCC was 3.10 and 2.70 at the four-year institutions. Figure 7 details academic performance at TCC and at the major transfer institutions. The average GPA of transfer students at TCC ranged from 2.85 for those students transferring to NSU to 3.53 for those transferring to VWC. After transferring to a four-year institution, the average GPA at the four-year institutions ranged from 2.25 at George Mason University (GMU) to 3.17 at UVa. A decline in GPA was found at all 11 institutions, with the largest occurring for those students enrolled at VWC (-0.95), GMU (-0.87), and Christopher Newport University (CNU; -0.81).
1 Laanan, F. S. (Ed.). (2001). Transfer students: Trends and issues. New Directions for Community
3.53
3.12 3.19 3.29 3.10 3.11 3.52
2.85 2.86 3.04 2.58
2.25 2.38
2.72 2.63 2.74 3.17
2.63 2.73
2.94 3.08
-0.95 -0.87 -0.81
-0.57 -0.47 -0.37 -0.36
-0.22 -0.13 -0.10 -0.04 3.12 -1.50 -1.00 -0.50 0.00 0.50 1.00 1.50 2.00 2.50 3.00 3.50 4.00 WMC GM U CNU JM U
ODU VCU UVA NSU RU VT VWC
Four-Year Institution
GP
A
TCC GPA Four-Year GPA Change in GPA
FIGURE 9. GPA at TCC and Four-Year Institutions
GPA by Ethnicity
In addition to identifying where TCC students of various ethnic backgrounds transfer, an examination of the performance of students from different ethnicities can help indicate the degree to which TCC adequately prepares all students for successful transfer. Figure 10 displays GPA at TCC and at the transfer institution disaggregated by ethnicity. As one can see, “transfer shock,” or declines in GPA averages, were experienced in all ethnic categories after transferring to four-year institutions. The largest negative differences in GPA between TCC and the transfer schools were experienced by Asian and African-American students.
3.15 2.88 3.04 3.14 3.24 2.92 2.58 2.72 2.40 2.79 -0.32 -0.56 -0.32 -0.48 -0.36 -1.00 -0.50 0.00 0.50 1.00 1.50 2.00 2.50 3.00 3.50 Cauc as ia n (n=1, 244) Afr ica n-A m
. (n=336) Hispani
c (n=60) Asia n (n=145)
Other (n=54)
Ethnicity
GP
A
TCC GPA Four-Year GPA Change in GPA
GPA by TCC Graduate Status
Table 3 shows the number of graduates and non-graduates at each of the major transfer institutions along with the respective average GPAs. Similar to previous transfer reports, the data indicated that graduates had a higher average GPA at the four-year institutions (2.83) compared to non-graduates (2.57). Additionally, graduates had higher average GPAs at six of the major transfer institutions and lower average GPAs at five. It is interesting to note that the five institutions at which graduates had lower average GPAs all have stringent admissions standards, and one might assume that the non-graduate transfers may have had an advanced academic background.
GPA Four-Year Institution
Graduate Non-Graduate Difference
Christopher Newport University 2.62 (n=8) 2.27 (n=16) +0.35
James Madison University 2.71 (n=24) 2.73 (n=27) -0.02
Norfolk State University 2.91 (n=63) 2.46 (n=93) +0.45
Old Dominion University 2.77 (n=660) 2.47 (n=541) +0.30
Radford University 3.02 (n=6) 2.66 (n=24) +0.36
George Mason University 2.23 (n=4) 2.25 (n=13) -0.02
University of Virginia 3.03 (n=15) 3.27 (n=19) -0.24
Virginia Commonwealth University 3.01 (n=16) 2.64 (n=44) +0.37
Virginia Tech 2.86 (n=7) 3.04 (n=6) -0.18
Virginia Wesleyan College 3.22 (n=116) 2.95 (n=128) +0.27
College of William and Mary 2.29 (n=11) 3.22 (n=5) -0.93
Total 2.83 (n=920) 2.57 (n=919) +0.26
TABLE 3. GPA at Four-Year Institutions by TCC Graduate Status GPA by TCC Degree Type
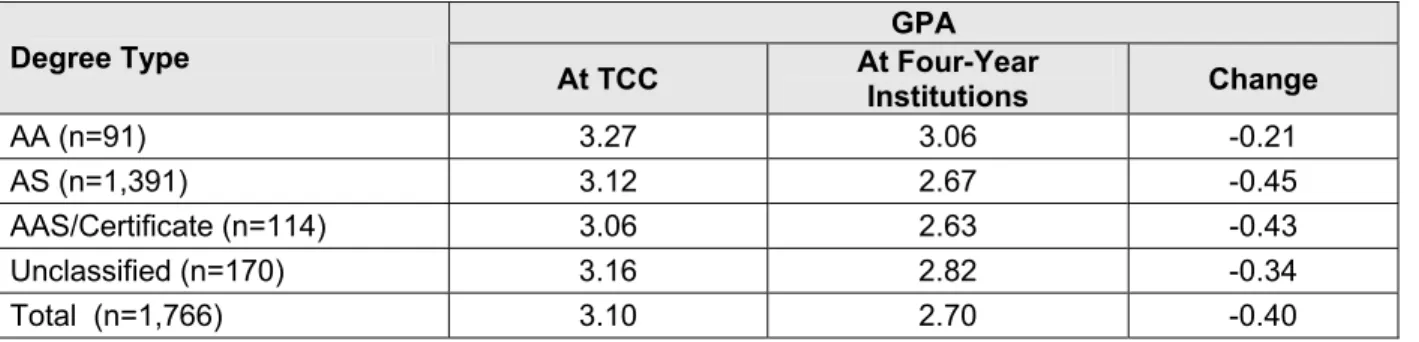
As shown in the table below, students in all degree types experienced a decline in GPA after transferring. Students in the AS degree and AAS degree/certificate programs experienced the largest changes in GPA (-0.45 and -0.43, respectively), while students in the AA degree program experienced the smallest changes in GPA (-0.21). These results were slightly different from those cited in the previous report in that the AA degree cohort experienced the largest change (-0.48) during the 2001-2003 reporting period.
GPA Degree Type
At TCC At Four-Year Institutions Change
AA (n=91) 3.27 3.06 -0.21
AS (n=1,391) 3.12 2.67 -0.45
AAS/Certificate (n=114) 3.06 2.63 -0.43
Unclassified (n=170) 3.16 2.82 -0.34
Total (n=1,766) 3.10 2.70 -0.40
As previously mentioned, the average GPA earned by all transfer students at the four-year institutions was 2.70. Two groups of transfer students had an average GPA that was lower than this overall average: non-graduates earning AS degrees and non-graduates enrolled in AAS/Certificate programs.
GPA by TCC Curriculum
An important question is how enrollment in various curricula prepared TCC students for successful transfer to four-year institutions. Figure 11 illustrates how GPA at TCC and at the four-year institution varies depending on a student’s curriculum while attending TCC. The largest differences in GPA were found in Business (-0.56) and the occupational/technical
curricula (-.50), while the smallest difference was found in unclassified students (-0.01).
3.09 3.19 3.06 3.10 3.28 3.08 3.17 3.15
2.85 2.53 2.84 2.66 2.69 3.06 2.58 2.74 2.84
-0.35 -0.40 -0.22 -0.43 -0.41
-0.01 2.74
-0.56 -0.41 -0.50
-1.00 -0.50 0.00 0.50 1.00 1.50 2.00 2.50 3.00 3.50 B us ines s E ngi neer in g F ine A rt s G ener al S tudi es Li ber al A rts O cc upat io nal /T ec hni ca l S ci enc e S oc ial S ci enc e U ncl assi fie d
Curriculum at TCC
GP
A TCC GPA
Four-Year GPA Change in GPA
FIGURE 11. GPA at TCC and Four-Year Institutions by TCC Curriculum Developmental English Success
Table 5 shows a comparison of GPA at TCC and the transfer institution disaggregated by enrollment status in a developmental English course while at TCC. Students who did not enroll in a developmental English course at TCC had considerably higher cumulative GPAs at both TCC and at the four-year institutions. In addition, both groups of transfer students had significantly lower GPAs after transferring to the four-year institutions, which is consistent with the “transfer shock” theory mentioned earlier.
GPA Enrollment Status – Developmental English
At TCC At Four-Year Institution Change
Enrolled in Developmental English at TCC (n=475) 2.92 2.51 -0.42
Not Enrolled in Developmental English at TCC (n=902) 3.16 2.77 -0.39
Difference -0.18 -0.26
Further analysis tracked student success in English courses at the four-year institutions. After transferring, 160 TCC students enrolled in an English course at their four-year institution. Of these 160 students, 116 (73%) had not enrolled in developmental English at TCC, while 44 students (27%) had. Figure 12 shows the percentage of students receiving various grades in English courses at the four-year institutions disaggregated by enrollment in developmental English. In cases where students enrolled in more than one English course, the performance in the lowest numbered English course was used for this analysis.
Students who did not enroll in developmental English were more successful in English courses at transfer institutions than students who initially enrolled in developmental English at TCC. While the percentage of transfer students taking developmental English at TCC who received passing grades at the four-year schools was only slightly lower than the percentage of transfer students not taking developmental English at TCC (82% as compared to 87%), only half as many received A grades.
23%
41%
18%
0%
9% 9% 46%
29%
2%
6% 5% 12%
0% 5% 10% 15% 20% 25% 30% 35% 40% 45% 50%
A B C D F W
Letter Grades in English Courses
Percen
ta
ge Earning Grade
Developmental No Developmental
FIGURE 12. Grade Distribution in English Courses at Four-Year Institutions by Enrollment in Developmental English
Developmental Mathematics Success
As stated previously, the majority of transfer students (45%) enrolled in developmental mathematics at TCC. A comparison of GPA at TCC with GPA at the transfer institution is shown in Table 6, disaggregated by enrollment status in developmental mathematics at TCC. As might be expected, in comparison to students who completed developmental mathematics, students who did not, performed better academically at TCC prior to transfer, as well as at the four-year institutions after transfer. However, differences were slight, suggesting that developmental mathematics course completion did not influence a student’s performance at the transfer institution nearly to the extent that developmental English status did. These findings are similar to those in previous reports.
GPA Enrollment Status – Developmental Mathematics
At TCC At Four-Year Institution Change
Enrolled in Developmental Mathematics at TCC (n=668) 3.08 2.67 -0.41
Not Enrolled in Developmental Mathematics at TCC (n=503) 3.12 2.74 -0.38
Difference -0.04 -0.07
TABLE 6. GPA at TCC and Four-Year Institutions by Enrollment in Developmental Mathematics Further analysis tracked student success in mathematics courses at the four-year institutions. After transferring, 199 TCC students enrolled in a mathematics course at their four-year institutions. Of these students, 100 students (50%) had not enrolled in developmental mathematics at TCC, while the remaining 99 students (50%) had completed a developmental mathematics course.
Figure 13 shows the percentage of students receiving various grades in mathematics courses disaggregated by enrollment in developmental mathematics. For students enrolled in more than one mathematics course, the performance in the lowest numbered course was used for this analysis. Overall, there were slight differences in the success (receiving a grade of C or better) and non-success (receiving a grade of D, F, or W) rates of transfer students based on their enrollment in developmental mathematics. Sixty-five percent of those who had taken developmental mathematics at TCC received grades of A, B, or C, compared to 72% of those who had not; 35% of those who had taken developmental math were unsuccessful, compared to 27% of those who had not.
21%
26%
18%
12%
11% 12% 28%
21%
23%
11%
10%
6%
0% 5% 10% 15% 20% 25% 30%
A B C D F W
Letter Grades in Mathematics Courses
P
er
cen
tage E
ar
n
ing Gr
ade
Developmental Mathematics No
Developmental Mathematics
FIGURE 13. Grade Distribution in Mathematics Courses at Four-Year Institutions by Enrollment in Developmental Mathematics
PERFORMANCE DATA ANALYSIS OF TOP THREE TRANSFER SCHOOLS
To provide a more detailed analysis of the transfer data received from four-year institutions, data specific to the top three transfer schools is presented in this section. As can be
seen in Figure 1, nearly one-half of all transfer students enrolled at ODU (n=2,092; 47%). The next two institutions enrolling the largest number of TCC transfers were NSU (n=420; 9%) and VWC (n=266; 6%). An examination of data from each of these three institutions is helpful in providing a better understanding of how TCC prepared its transfer students for success at a four-year institution.
Old Dominion University
ODU has consistently been the largest transfer institution for TCC students. As already noted, for the 2003-2005 transfer period, a total of 2,092 students, or 47% of all transfers, chose ODU. Forty-three percent of these students graduated from TCC before transferring to ODU and 57% did not. While at TCC, 75% of these students were enrolled in a transfer degree program (AA/AS), compared to 8% enrolled in an occupational/technical program (AAS/Certificate), and 17% categorized as unclassified. Figure 14 displays the various majors chosen by 3% or more of the transfer student cohort. Majors in Business Management (25%), Health/health-related professions (13%), and Social Sciences/History (12%) were the three most frequently chosen majors at ODU.
25%
13% 12%
8% 7% 7% 7% 6%
4% 4% 2%
1% 1% 1% 1% 1% 0% 5% 10% 15% 20% 25% 30% Busin ess Healt h Scie
nce s Social Scienc es English Engine ering Inte rdisc iplina ry St
udies
Physi cal S
cien ces
Biolo gica
l Scie nces
Visu al/Pe
rform ing A
rts Educa tion Info rmati on S cienc es Forei gn La
ngua ges Math ema tics Psyc hology Park s, Re crea tion, Fitn ess Othe r ODU Major P e rcen tag e o f T ra n sfers
FIGURE 14. Majors at Old Dominion University
Of the 1,839 students who transferred to ODU, and for which Guideline 8 data was provided, one-half (n=920) graduated from TCC prior to transfer. This was somewhat higher than the overall graduation rate of 32% for students who transferred during this time period. The following table displays GPAs and credit averages for graduates and non-graduates at TCC and at ODU. Graduates’ GPAs at TCC and at ODU were higher than non-graduates, and their decline in GPAs from TCC to ODU were not as pronounced.
GPA*
TCC Graduate Status At TCC At ODU Change
Graduated from TCC 3.15 2.77 -0.38
Did not graduate from TCC 3.03 2.46 -0.57
Difference -0.12 -0.31
*Based on Guideline 8 data
TABLE 7. GPA at TCC and ODU by Graduate Status Norfolk State University
NSU was the second largest transfer institution for TCC students this reporting period with 420 students, or 9% of all transfers. While at TCC, 64% of the students were enrolled in a transfer degree program (AA/AS), 24% in an occupational/technical program (AAS/Certificate), and 12% unclassified. After transferring to NSU, there were several popular majors as depicted by Figure 16. Health/Health-related professions (20%) Interdisciplinary Studies (13%), and Public Administration (12%) were the most frequently chosen majors at NSU.
20%
13%
9% 9%
7% 6%
3% 3% 3%
15% 11% 0% 5% 10% 15% 20% 25% Heal th Sc
ienc es
Inter disc
iplinar y St
udies
Pub lic Ad
mini strat ion Busin ess Socia l Scien
ces Psy
chol ogy
Biolog ical S
cience s Com mun icati ons Parks , Rec
reat ion, F
itnes s
Phys ical Sc
ience s Other NSU Major P er cen ta g e o f T ran sf er s
FIGURE 15. Majors at Norfolk State University
Of the 420 students who transferred to NSU, 118 (28%) graduated from TCC prior to transfer. This was slightly lower than the overall graduation rate of 32% for students who transferred during this time period. Table 8 displays GPAs for graduates and non-graduates at TCC prior to transfer and once enrolled at NSU. As can be seen, graduates had higher GPAs both at TCC and at NSU than non-graduates. Furthermore, the drop in GPA between TCC and NSU was not nearly so great for graduates as for non-graduates, supporting the notion that graduating from TCC prior to transfer prepares students better for the rigors of academics at four-year institutions such as Norfolk State University.
GPA*
TCC Graduate Status At TCC At NSU Change
Graduated from TCC (n=53) 3.04 2.91 -0.13
Did not graduate from TCC (n=93) 2.74 2.46 -0.28
Difference -0.30 -0.45
*Based on Guideline 8 data
TABLE 8. GPA at TCC and NSU by Graduate Status Virginia Wesleyan College
VWC was the third largest transfer institution for TCC students this reporting period, representing 6% of transfers. While at TCC, 74% of these students were enrolled in a transfer degree program (AA/AS), 10% in an occupational/technical program (AAS/Certificate), and 16% were categorized as unclassified. The most popular majors at VWC for TCC transfers were Business Management (25%), Education (18%), and Social Sciences/History (12%).
25%
18%
12%
8%
6% 5% 5%
4% 4% 4%
9% 0% 5% 10% 15% 20% 25% 30% Busine ss Educ ation
Soc ial Sc
ience s
Prot ectiv
e Se rvice
s
Inte rdisc
iplinar y Studi
es Com mun icatio ns Psyc
hology Engl
ish
Biolog ical Sc
ience s Publ ic Ad mini strat ion Other VWC Major P er ce n ta ge of Tr an sf er s
FIGURE 16. Majors at Virginia Wesleyan College
Forty-five percent (45%) of students who transferred to VWC completed a degree at TCC prior to transfer, a much higher figure than the overall graduation rate of all transfers (32%). Table 9 displays GPAs at both TCC and VWC for TCC graduates and non-graduates. As can be seen, TCC graduates had much higher GPAs both at TCC and at VWC. Furthermore, the difference in GPA between TCC and VWC was considerably different for both groups. TCC graduates actually performed slightly higher at VWC than at TCC, while non-graduates recorded a drop in GPA from 3.04 at TCC to 2.95 at VWC. This is strong evidence that graduating from TCC prior to transfer helps students succeed academically at VWC.
GPA* TCC Graduate Status
At TCC At VWC Change
Graduated from TCC (n=116) 3.21 3.22 +0.01
Did not graduate from TCC (n=128) 3.04 2.95 -0.09
Difference -0.17 -0.27
*Based on Guideline 8 data
TRANSFER SURVEY ANALYSIS Sample Size and Data Source
During the fall of 2005, the TCC Office of Institutional Effectiveness obtained student perceptions of the transfer process to four-year institutions through the biennial Transfer Survey (see Appendix B). The 18-item questionnaire was mailed to 557 students who transferred during the 2003-2004 academic year and met the aforementioned definition requirements for a transfer student. This allowed ample time for transfer students to reflect on their education at TCC and how well it prepared them for success at their four-year institution. Completed surveys were received from 106 students enrolled at eight different four-year institutions, representing a 19% response rate. The majority of respondents attended Old Dominion University (58%), followed by Virginia Wesleyan College (15%), and Norfolk State University (12%). Six percent (6%) of respondents each attended Virginia Commonwealth University and Radford University. These percentages were similar to those of all students who transferred to the various institutions in the 2003-2005 reporting period.
Findings
When asked about their primary educational objective upon first enrolling at TCC, nearly one-half of all respondents (49%) indicated that their goal was to complete a two-year degree. One-third (33%) indicated that their primary goal was to transfer to a four-year institution without first obtaining a two-year degree. When asked whether they actually did graduate from TCC with an associate degree prior to transfer, over two-thirds (67%) replied that they did, a percentage figure in accord with the percentage of students indicating their primary objective was to obtain a two-year degree and then transfer. Four students claimed they first enrolled at TCC to improve their skills, three that they enrolled for self-improvement, one that she or he enrolled for remedial academic work, and 11 indicated other reasons for first enrolling. Interestingly, nearly one-quarter of the respondents noted that their primary educational objective changed after enrolling at TCC.
During the spring semester of 2005, 87% of respondents indicated that they were attending a four-year institution either full-time (81%) or part-time (19%). Most of these respondents (72%) applied to only one college. Twenty-two percent applied to two colleges, 5% to three, and 1% to three or more. Most respondents also indicated that the college they were attending was their first choice. Eighty-seven percent were enrolled in the college of their choice, while 13% were enrolled in the college of their second choice.
For the most part, the four-year institutions to which respondents transferred counted their TCC course work toward graduation requirements. Sixty-four percent reported that all of their TCC credits were accepted. When asked whether they encountered any difficulties during the transfer process, over three-quarters (78%) reported they did not. Regarding students’ perceptions of their preparation for the academic environment of a four-year institution, 86% of respondents indicated that they were prepared; this was the same percentage reported in the 2001-03 survey.
Ninety-seven percent of the respondents expected to complete their four-year degree. Seven percent of the respondents expected to graduate within one year after transferring from TCC; 46% expected to graduate within two years, 31% within three years, and 16% within four or more years. When asked whether they were prepared for the academic atmosphere of a four-year college, 86% reported they were.
Overall, 86% of the respondents rated their transfer experience as at least good, with 17% rating their transfer experience as excellent, 50% as very good, and 19% as good.
Reflective of the overall high degree of satisfaction with their experience and preparation while at TCC, 94% of students indicated that they would recommend TCC to other potential students.
Students were asked to evaluate several TCC resources and services that were available to them to assist with the planning of their program of study. Results are shown in Table 10. Seven of the eight services were used by the majority of responding students, with the college catalog and academic counseling having a usage rate of 85% or higher. Four services and resources were positively perceived by 90% or more of all respondents—curriculum sheets (98%), college catalog (96%), student handbook (95%), and TCC website (92%). None of the remaining four services received positive ratings lower than 70%.
Satisfaction Rate
Resource/Service Usage Rate
Excellent Very Good Good Positive Total
Academic Counseling 85% 27% 23% 26% 76%
College Catalog 88% 37% 43% 16% 96%
Transfer Guide 66% 27% 35% 23% 85%
Curriculum Sheets 69% 42% 31% 25% 98%
Student Handbook 66% 32% 32% 31% 95%
Faculty Advising 61% 27% 30% 21% 78%
TCC Website 77% 28% 37% 27% 92%
Career Counseling 26% 25% 21% 25% 71%
Other 13% 29% 14% 29% 72%
TABLE 10. Usage and Satisfaction Rates with TCC Resources for Program Planning
The survey also questioned respondents about TCC’s proficiency in preparing its students for various demands of a four-year institution. Table 11 displays the percentages of students who felt that TCC was excellent, very good, and good at preparing them for the rigors of a baccalaureate institution. Positive satisfaction rates with the preparation provided by TCC were consistently high, ranging from 82% (difficulty/amount of reading) to 87% (speaking skills; math skills; writing skills; problem solving skills).
Satisfaction Rate Demand of 4-Year Institution
Excellent Good Very Good Total Positive
Speaking Skills 22% 35% 30% 87%
Math Skills 23% 44% 20% 87%
Vocabulary 18% 31% 37% 86%
Computer Skills 29% 29% 28% 86%
Difficulty/Amount of Reading 20% 31% 31% 82%
Writing Skills 22% 34% 31% 87%
Problem Solving Skills 20% 37% 30% 87%
Critical Thinking 22% 34% 30% 86%
Study Skills/Study Habits 18% 36% 31% 85%
CONCLUSION
In conclusion, this transfer student report provides a picture of the preparation of various groups that transfer from TCC to four-year institutions. These groups included graduates and non-graduates, students from both transfer and occupational/technical programs, students of various ethnicities, and developmental and non-developmental English and mathematics students. Based on the results, several conclusions can be drawn concerning the relative preparation of students in these groups.
As noted in previous transfer studies, students who graduated from TCC with a degree prior to transferring seemed to have two advantages. First, graduates tend to have a higher acceptance rate at the transfer institution compared to non-graduates. This could be due in part to the fact that graduates typically complete more credit hours at TCC prior to transferring, a possible factor in admissions decisions; just as likely, however, is the fact that four-year admissions staff typically consider community college graduation as a positive factor in the admission process. Secondly, graduates performed better than non-graduates at the transfer institutions as measured by GPA. As noted earlier, not only did TCC graduates in degree programs have higher four-year GPAs than non-graduates, but a smaller difference existed between the four-year GPA and the TCC two-year GPA, indicating that TCC graduates handle “transfer shock” better than non-graduates do.
Overall, TCC students who transferred to a four-year institution felt that the transition was smooth, and the majority of students reported that they experienced no major problems associated with transferring. Most students indicated that all of their TCC credit hours were accepted, and nearly all students indicated that they would recommend TCC to friends or acquaintances. Respondents felt that they were well prepared for the demands of a four-year institution. Results showed that 80% or more of students felt prepared for various demands of a four-year institution including reading, writing, speaking, mathematics, computer skills, problem solving, and study skills. Consistent with these self-perceptions, GPA performance data from four-year institutions showed that TCC transfer students were successful.
Appendix A:
TCC Student Transfer Institutions
Four Year Institution Frequency Percent
OLD DOMINION UNIVERSITY 2,092 46.4
NORFOLK STATE UNIVERSITY 420 9.3
VIRGINIA WESLEYAN COLLEGE 266 5.9
VIRGINIA COMMONWEALTH UNIVERSITY 170 3.8
REGENT UNIVERSITY 103 2.3
HAMPTON UNIVERSITY 102 2.3
STRAYER UNIVERSITY-WASHINGTON 96 2.1
VIRGINIA POLYTECH AND STATE UNIV 94 2.1
UNIVERSITY OF PHOENIX 92 2.0
JAMES MADISON UNIVERSITY 70 1.6
RADFORD UNIVERSITY 49 1.1
CHRISTOPHER NEWPORT UNIVERSITY 46 1.0
UNIVERSITY OF VIRGINIA 46 1.0
UNIVERSITY OF MARYLAND - UNIVERSITY 43 1.0
GEORGE MASON UNIVERSITY 36 0.8
COLLEGE OF WILLIAM & MARY 33 0.7
LIBERTY UNIVERSITY 33 0.7
TROY UNIVERSITY 33 0.7
LONGWOOD UNIVERSITY 23 0.5
EASTERN VIRGINIA MEDICAL SCHOOL 18 0.4
EAST CAROLINA UNIVERSITY 15 0.3
EMBRY-RIDDLE AERONAUTICAL UNIV.-WOR 14 0.3
COLUMBIA COLLEGE-EV SESSION 11 0.2
SOUTHERN ILLINOIS UNIVERSITY CARBON 10 0.2
AVERETT UNIVERSITY - NON TRAD 9 0.2
CAMBRIDGE COLLEGE 9 0.2
UNIVERSITY OF MARY WASHINGTON 9 0.2
CAPELLA UNIVERSITY 8 0.2
TOURO UNIVERSITY - INTERNATIONAL 8 0.2
UNIVERSITY OF WEST FLORIDA 8 0.2
WESTERN INTERNATIONAL UNIVERSITY 8 0.2
GEORGE WASHINGTON UNIVERSITY 7 0.2
PENNSYLVANIA STATE UNIVERSITY 7 0.2
ST PETERSBURG COLLEGE 7 0.2
UNIVERSITY OF RICHMOND 7 0.2
VIRGINIA STATE UNIVERSITY 7 0.2
WESTERN GOVERNORS UNIVERSITY 7 0.2
PARK UNIVERSITY 6 0.1
CAMPBELL UNIVERSITY 5 0.1
DEVRY UNIVERSITY - DUPAGE 5 0.1
NATIONAL UNIVERSITY 5 0.1
NORTH CAROLINA A&T STATE UNIV 5 0.1
ROANOKE BIBLE COLLEGE 5 0.1
SAVANNAH COLLEGE OF ART & DESIGN 5 0.1
VIRGINIA MILITARY INSTITUTE 5 0.1
Four Year Institution Frequency Percent
COASTAL CAROLINA UNIVERSITY 4 0.1
ELIZABETH CITY STATE UNIVERSITY 4 0.1
FLAGLER COLLEGE 4 0.1
JOHNSON & WALES UNIVERSITY 4 0.1
NORTH CAROLINA STATE UNIVERSITY 4 0.1
RANDOLPH-MACON COLLEGE 4 0.1
SHENANDOAH UNIVERSITY 4 0.1
SOUTHERN NEW HAMPSHIRE UNIVERSITY- 4 0.1
TEMPLE UNIVERSITY 4 0.1
UNIVERSITY OF NORTH CAROLINA-WILMIN 4 0.1
UNIVERSITY OF NORTH FLORIDA 4 0.1
UNIVERSITY OF SOUTH CAROLINA 4 0.1
UNIVERSITY OF WISCONSIN - PARKSIDE 4 0.1
BELLEVUE UNIVERSITY 3 0.1
CHOWAN UNIVERSITY 3 0.1
CUNY CITY COLLEGE 3 0.1
FLORIDA ATLANTIC UNIVERSITY 3 0.1
METROPOLITAN STATE COLLEGE OF DENVE 3 0.1
NOVA SOUTHEASTERN UNIVERSITY 3 0.1
OHIO STATE UNIVERSITY 3 0.1
OKLAHOMA STATE UNIVERSITY - STILLWA 3 0.1
SAM HOUSTON STATE UNIVERSITY 3 0.1
UNIVERSITY OF ALASKA - ANCHORAGE 3 0.1
UNIVERSITY OF CENTRAL FLORIDA 3 0.1
UNIVERSITY OF ILLINOIS AT CHICAGO 3 0.1
UNIVERSITY OF KENTUCKY 3 0.1
UNIVERSITY OF MARYLAND - BALTIMORE 3 0.1
UNIVERSITY OF MARYLAND - COLLEGE PA 3 0.1
UNIVERSITY OF NEBRASKA MEDICAL 3 0.1
UVA AT WISE 3 0.1
ACADEMY OF ART UNIVERSITY 2 <0.1
AMERICAN UNIVERSITY 2 <0.1
APPALACHIAN STATE UNIVERSITY 2 <0.1
ARIZONA STATE UNIVERSITY 2 <0.1
ATHENS STATE UNIVERSITY 2 <0.1
AUBURN UNIVERSITY 2 <0.1
AUBURN UNIVERSITY AT MONTGOMERY 2 <0.1
BAPTIST BIBLE COLLEGE OF PENNSYLVAN 2 <0.1
BARTON COLLEGE 2 <0.1
CALIFORNIA STATE UNIVERSITY - SAN B 2 <0.1
CALIFORNIA UNIVERSITY OF PENNSYLVAN 2 <0.1
CHARLESTON SOUTHERN UNIVERSITY 2 <0.1
CLEMSON UNIVERSITY 2 <0.1
COLLEGE OF CHARLESTON 2 <0.1
CUNY BROOKLYN COLLEGE 2 <0.1
CUNY HUNTER COLLEGE 2 <0.1
DEVRY UNIVERSITY - DECATUR 2 <0.1
DREXEL UNIVERSITY 2 <0.1
EAST TENNESSEE STATE UNIVERSITY 2 <0.1
Four Year Institution Frequency Percent
ELLIS COLLEGE @ NY IT 2 <0.1
EMBRY-RIDDLE AERONAUTICAL UNIVERSIT 2 <0.1
FAIRMONT STATE UNIVERSITY-TRAD 2 <0.1
FLORIDA STATE UNIVERSITY 2 <0.1
FORT HAYS STATE UNIVERSITY 2 <0.1
FORT VALLEY STATE UNIVERSITY 2 <0.1
FRANKLIN UNIVERSITY 2 <0.1
HAMPDEN-SYDNEY COLLEGE 2 <0.1
HOLLINS UNIVERSITY 2 <0.1
ITT TECHNICAL INSTITUTE 2 <0.1
JEFFERSON COLLEGE OF HEALTH SCIENCE 2 <0.1
KENNESAW STATE UNIVERSITY 2 <0.1
LEE UNIVERSITY 2 <0.1
LYNCHBURG COLLEGE 2 <0.1
MACON STATE COLLEGE 2 <0.1
MARYMOUNT UNIVERSITY 2 <0.1
MEREDITH COLLEGE 2 <0.1
MIAMI DADE COLLEGE 2 <0.1
MICHIGAN STATE UNIVERSITY 2 <0.1
MOUNT OLIVE COLLEGE 2 <0.1
NEW ENGLAND INSTITUTE OF TECHNOLOGY 2 <0.1
NORTH CAROLINA CENTRAL UNIVERSITY 2 <0.1
NORTHERN ARIZONA UNIVERSITY 2 <0.1
PIERCE COLLEGE - MILITARY PROGRAM 2 <0.1
ROCHESTER INSTITUTE OF TECHNOLOGY 2 <0.1
RUTGERS -THE STATE UNIVERSITY OF NJ 2 <0.1
SAINT LOUIS UNIVERSITY 2 <0.1
SAN DIEGO STATE UNIVERSITY 2 <0.1
SUNY COLLEGE - BROCKPORT 2 <0.1
SUNY FASHION INSTITUTE OF TECHNOLOG 2 <0.1
THE UNIVERSITY OF MEMPHIS 2 <0.1
TOWSON UNIVERSITY 2 <0.1
UNIVERSITY OF CENTRAL OKLAHOMA 2 <0.1
UNIVERSITY OF COLORADO AT DENVER HE 2 <0.1
UNIVERSITY OF HOUSTON AT CLEAR LAKE 2 <0.1
UNIVERSITY OF LOUISVILLE 2 <0.1
UNIVERSITY OF MAINE, AUGUSTA 2 <0.1
UNIVERSITY OF NORTH CAROLINA, ASHEV 2 <0.1
UNIVERSITY OF NORTH CAROLINA-CHAPEL 2 <0.1
UNIVERSITY OF PITTSBURGH 2 <0.1
UNIVERSITY OF RHODE ISLAND 2 <0.1
UNIVERSITY OF TENNESSEE 2 <0.1
UNIVERSITY OF TEXAS - SAN ANTONIO 2 <0.1
UNIVERSITY OF VA'S COLLEGE AT WISE 2 <0.1
UTAH VALLEY STATE COLLEGE 2 <0.1
UTICA COLLEGE 2 <0.1
VALDOSTA STATE UNIVERSITY 2 <0.1
WALDEN UNIVERSITY 2 <0.1
WEBSTER UNIVERSITY GRADS 2 <0.1
Four Year Institution Frequency Percent
ADAMS STATE COLLEGE 1 <0.1
ADAMS STATE COLLEGE-EXTENDED 1 <0.1
AQUINAS COLLEGE-TRADITIONAL 1 <0.1
ARGOSY UNIVERSITY - DC AREA 1 <0.1
ARMSTRONG ATLANTIC STATE UNIVERSITY 1 <0.1
AUSTIN PEAY @ FORT CAMPBELL 1 <0.1
AVILA UNIVERSITY 1 <0.1
BARRY UNIVERSITY 1 <0.1
BELHAVEN COLLEGE 1 <0.1
BELMONT UNIVERSITY 1 <0.1
BIOLA UNIVERSITY 1 <0.1
BLOOMSBURG UNIVERSITY OF PENNSYLVAN 1 <0.1
BRENAU UNIVERSITY 1 <0.1
BREWTON-PARKER COLLEGE 1 <0.1
BRIDGEWATER COLLEGE 1 <0.1
BRIGHAM YOUNG UNIVERSITY - IDAHO FA 1 <0.1
BRIGHAM YOUNG UNIVERSITY - IDAHO SU 1 <0.1
BRIGHAM YOUNG UNIVERSITY -IDAHO WIN 1 <0.1
CALIFORNIA STATE UNIVERSITY - FRESN 1 <0.1
CARNEGIE MELLON UNIVERSITY 1 <0.1
CARSON-NEWMAN COLLEGE 1 <0.1
CARTHAGE COLLEGE 1 <0.1
CEDARVILLE UNIVERSITY 1 <0.1
CENTRAL MICHIGAN UNIVERSITY 1 <0.1
CHAPMAN UNIVERSITY-AC 1 1 <0.1
CHAPMAN UNIVERSITY-ORANGE 1 <0.1
CHICAGO STATE UNIVERSITY 1 <0.1
CLARK ATLANTA UNIVERSITY 1 <0.1
CLEARWATER CHRISTIAN COLLEGE 1 <0.1
COLORADO STATE UNIVERSITY - PUEBLO 1 <0.1
COLUMBIA INTERNATIONAL UNIVERSITY 1 <0.1
COLUMBIA UNION COLLEGE 1 <0.1
COLUMBUS STATE UNIVERSITY 1 <0.1
CONCORDIA UNIVERSITY 1 <0.1
CONCORDIA UNIVERSITY TEXAS 1 <0.1
COVENANT COLLEGE 1 <0.1
CUNY COLLEGE OF STATEN ISLAND 1 <0.1
CUNY JOHN JAY COLLEGE OF CRIMINAL J 1 <0.1
DELAWARE STATE UNIVERSITY 1 <0.1
DEPAUL UNIVERSITY 1 <0.1
DEVRY UNIVERSITY - ARLINGTON 1 <0.1
DEVRY UNIVERSITY - GWINNETT 1 <0.1
DEVRY UNIVERSITY - MIRAMAR 1 <0.1
DEVRY UNIVERSITY - ORLANDO 1 <0.1
DIXIE STATE COLLEGE OF UTAH 1 <0.1
DUKE UNIVERSITY ENVIRONMENT 1 <0.1
EASTERN MENNONITE UNIVERSITY 1 <0.1
EASTERN MICHIGAN UNIVERSITY 1 <0.1
ECKERD COLLEGE 1 <0.1
Four Year Institution Frequency Percent
EMORY AND HENRY COLLEGE 1 <0.1
EVANGEL UNIVERSITY 1 <0.1
FLORIDA A&M UNIVERSITY 1 <0.1
FLORIDA INSTITUTE OF TECHNOLOGY 1 <0.1
FLORIDA INTERNATIONAL UNIVERSITY 1 <0.1
FLORIDA SOUTHERN COLLEGE 1 <0.1
FRAMINGHAM STATE COLLEGE 1 <0.1
FREE WILL BAPTIST BIBLE COLLEGE 1 <0.1
FRESNO PACIFIC UNIVERSITY - DEGREE 1 <0.1
GEORGIA SOUTHERN UNIVERSITY 1 <0.1
GOUCHER COLLEGE 1 <0.1
GRACELAND UNIVERSITY 1 <0.1
GRAND CANYON UNIVERSITY-TRADITIONAL 1 <0.1
GRANITE STATE COLLEGE 1 <0.1
HARDING UNIVERSITY 1 <0.1
HOFSTRA UNIVERSITY 1 <0.1
ILLINOIS INSTITUTE OF TECHNOLOGY 1 <0.1
INDIANA UNIVERSITY SOUTHEAST 1 <0.1
ITHACA COLLEGE 1 <0.1
JACKSON STATE UNIVERSITY 1 <0.1
JACKSONVILLE STATE UNIVERSITY 1 <0.1
JACKSONVILLE UNIVERSITY 1 <0.1
JUDSON COLLEGE 1 <0.1
KANSAS STATE UNIVERSITY 1 <0.1
KEENE STATE COLLEGE 1 <0.1
KENT STATE UNIVERSITY 1 <0.1
KUTZTOWN UNIVERSITY 1 <0.1
LA SIERRA UNIVERSITY 1 <0.1
LIFE UNIVERSITY 1 <0.1
LOYOLA UNIVERSITY CHICAGO 1 <0.1
MANSFIELD UNIVERSITY 1 <0.1
MARSHALL UNIVERSITY, HUNTINGTON 1 <0.1
MC DANIEL COLLEGE 1 <0.1
MEDICAL UNIV OF SOUTH CAROLINA 1 <0.1
MEHARRY MEDICAL COLLEGE 1 <0.1
MERCER UNIVERSITY MACON 1 <0.1
MERCER UNIVERSITY LAW 1 <0.1
MESSIAH COLLEGE 1 <0.1
MINNESOTA STATE UNIVERSITY - MANKA 1 <0.1
MISSISSIPPI STATE UNIVERSITY 1 <0.1
MISSOURI STATE UNIVERSITY 1 <0.1
MONTANA STATE UNIVERSITY - BOZEMAN 1 <0.1
MOREHEAD STATE UNIVERSITY 1 <0.1
MOUNT VERNON NAZARENE UNIVERSITY 1 <0.1
MURRAY STATE UNIVERSITY 1 <0.1
NATIONAL LOUIS UNIVERSITY 1 <0.1
NEW JERSEY INSTITUTE OF TECHNOLOGY 1 <0.1
NICHOLS COLLEGE 1 <0.1
NORTH CAROLINA SCHOOL OF THE ARTS 1 <0.1
Four Year Institution Frequency Percent
NORTHERN ILLINOIS UNIVERSITY 1 <0.1
NORTHERN KENTUCKY UNIVERSITY 1 <0.1
NORTHWESTERN STATE UNIVERSITY 1 <0.1
NORTHWESTERN UNIVERSITY 1 <0.1
NORTHWOOD UNIVERSITY - WEST PALM BE 1 <0.1
NYACK COLLEGE - ROCKLAND UG 1 <0.1
OHIO UNIVERSITY 1 <0.1
OREGON INSTITUTE OF TECHNOLOGY 1 <0.1
PFEIFFER COLLEGE-TRADITIONAL 1 <0.1
PHILADELPHIA UNIVERSITY 1 <0.1
PLYMOUTH STATE UNIVERSITY 1 <0.1
PRATT INSTITUTE 1 <0.1
PURDUE UNIVERSITY - WEST LAFAYETTE 1 <0.1
RANDOLPH COLLEGE 1 <0.1
REGIONS UNIVERSITY 1 <0.1
REGIS UNIVERSITY-SEMESTERS 1 <0.1
RHODE ISLAND COLLEGE 1 <0.1
RICHARD STOCKTON COLLEGE OF NEW JER 1 <0.1
ROANOKE COLLEGE 1 <0.1
ROGER WILLIAMS UNIVERSITY 1 <0.1
SAGINAW VALLEY STATE UNIVERSITY 1 <0.1
SAINT FRANCIS UNIVERSITY 1 <0.1
SALISBURY UNIVERSITY 1 <0.1
SHIPPENSBURG UNIVERSITY 1 <0.1
SONOMA STATE UNIVERSITY 1 <0.1
SOUTHERN CONNECTICUT STATE UNIVERSI 1 <0.1
SOUTHERN ILLINOIS UNIV EDWARDSVILLE 1 <0.1
SOUTHERN OREGON UNIVERSITY 1 <0.1
ST JOHN FISHER COLLEGE 1 <0.1
ST JOHNS UNIVERSITY 1 <0.1
ST JOSEPH'S COLLEGE - SUFFOLK 1 <0.1
SUNY BUFFALO 1 <0.1
SUNY FARMINGDALE 1 <0.1
SWEET BRIAR COLLEGE 1 <0.1
SYRACUSE UNIVERSITY 1 <0.1
TEXAS A&M UNIVERSITY - GALVESTON 1 <0.1
TEXAS SOUTHERN UNIVERSITY 1 <0.1
TEXAS TECH UNIVERSITY, LUBBOCK 1 <0.1
THE CATHOLIC UNIVERSITY OF AMERICA 1 <0.1
THE EVERGREEN STATE COLLEGE 1 <0.1
THE NEW SCHOOL 1 <0.1
THE UNIVERSITY OF LOUISIANA - MONRO 1 <0.1
TRINITY CHRISTIAN COLLEGE 1 <0.1
TROY UNIVERSITY - MONTGOMERY 1 <0.1
TUFTS UNIVERSITY 1 <0.1
UNION INSTITUTE 1 <0.1
UNIVERSITY OF ALABAMA 1 <0.1
UNIVERSITY OF ARKANSAS AT FAYETTEVI 1 <0.1
UNIVERSITY OF CALIFORNIA-LOS ANGELE 1 <0.1
Four Year Institution Frequency Percent
UNIVERSITY OF CINCINNATI 1 <0.1
UNIVERSITY OF COLORADO AT DENVER 1 <0.1
UNIVERSITY OF CONNECTICUT 1 <0.1
UNIVERSITY OF DELAWARE 1 <0.1
UNIVERSITY OF DETROIT MERCY 1 <0.1
UNIVERSITY OF GEORGIA 1 <0.1
UNIVERSITY OF HAWAII AT MANOA 1 <0.1
UNIVERSITY OF HOUSTON 1 <0.1
UNIVERSITY OF ILLINOIS @ SPRINGFIEL 1 <0.1
UNIVERSITY OF ILLINOIS @ URBANA 1 <0.1
UNIVERSITY OF IOWA 1 <0.1
UNIVERSITY OF MAINE, ORONO 1 <0.1
UNIVERSITY OF MARYLAND EASTERN SHOR 1 <0.1
UNIVERSITY OF MASSACHUSETTS AT AMHE 1 <0.1
UNIVERSITY OF MASSACHUSETTS AT LOWE 1 <0.1
UNIVERSITY OF MIAMI 1 <0.1
UNIVERSITY OF MICHIGAN, DEARBORN 1 <0.1
UNIVERSITY OF MICHIGAN, FLINT 1 <0.1
UNIVERSITY OF MISSISSIPPI 1 <0.1
UNIVERSITY OF MISSOURI-COLUMBIA 1 <0.1
UNIVERSITY OF MISSOURI-ROLLA 1 <0.1
UNIVERSITY OF NEVADA LAS VEGAS 1 <0.1
UNIVERSITY OF NEW ORLEANS 1 <0.1
UNIVERSITY OF NORTH CAROLINA - CHAR 1 <0.1
UNIVERSITY OF NORTHERN COLORADO 1 <0.1
UNIVERSITY OF SOUTH ALABAMA 1 <0.1
UNIVERSITY OF SOUTH CAROLINA - AIKE 1 <0.1
UNIVERSITY OF SOUTH CAROLINA @ BEAU 1 <0.1
UNIVERSITY OF SOUTHERN MAINE 1 <0.1
UNIVERSITY OF SOUTHERN MISSISSIPPI- 1 <0.1
UNIVERSITY OF ST. FRANCIS 1 <0.1
UNIVERSITY OF TENNESSEE CHATTANOOGA 1 <0.1
UNIVERSITY OF TEXAS ARLINGTON 1 <0.1
UNIVERSITY OF TEXAS AT DALLAS 1 <0.1
UNIVERSITY OF WASHINGTON - SEATTLE 1 <0.1
UNIVERSITY OF WISCONSIN - EAU CLAIR 1 <0.1
UNIVERSITY OF WISCONSIN - MILWAUKEE 1 <0.1
UNIVERSITY OF WYOMING 1 <0.1
VALPARAISO UNIVERSITY 1 <0.1
VIRGINIA UNION UNIVERSITY 1 <0.1
VOORHEES COLLEGE 1 <0.1
WASHINGTON BIBLE COLLEGE 1 <0.1
WAYLAND BAPTIST UNIVERSITY-EXTERNAL 1 <0.1
WEBSTER UNIVERSITY 1 <0.1
WESLEY THEOLOGICAL SEMINARY 1 <0.1
WEST VIRGINIA UNIVERSITY 1 <0.1
WESTERN CONNECTICUT STATE UNIVERSIT 1 <0.1
WESTERN ILLINOIS UNIVERSITY 1 <0.1
WHEATON COLLEGE 1 <0.1
Four Year Institution Frequency Percent
WILKES UNIVERSITY 1 <0.1
WILMINGTON UNIVERSITY 1 <0.1
WINTHROP UNIVERSITY 1 <0.1
WOODBURY UNIVERSITY 1 <0.1
TOTAL 4,507
Appendix B:
Transfer Student Survey Instrument
T
RANSFERS
TUDENTS
URVEY1. How many hours per week did you work while attending TCC?
1R Didn't work 2 R Under 10 hrs 3 R 10-20 hrs 4 R 21-30 hrs 5 R More than 30 hrs
2. What was your primary educational objective when first enrolling at TCC? (check only one)
1 R Prepare to transfer to another college or university without completing a 2-year degree at TCC
2 R Improve career/occupational skills
3 R Remediate or review basic skills
4 R Study topics of interest or for self-improvement
5 R Complete a 2-year degree at TCC
6 R Other (please specify)
3. Did your primary educational objective change? 1R Yes 2 R No
If YES, what influenced the change?
4. Did you graduate with an AS, AA, or AAS degree at TCC before transferring? 1R Yes 2 R No
5. Please rate any of TCC's services listed below that you used in planning your program of study:
USED SERVICE?
Please use
marks to rate the service if you used it
YES NO STUDENT SERVICES EXCELLENT VERY GOOD GOOD FAIR POOR
1 R 2 R Academic counseling 3 R 4 R 5 R 6 R 7 R
1 R 2 R Curriculum sheets 3 R 4 R 5 R 6 R 7 R
1 R 2 R Faculty advising 3 R 4 R 5 R 6 R 7 R
1 R 2 R Transfer guide 3 R 4 R 5 R 6 R 7 R
1 R 2 R College catalog 3 R 4 R 5 R 6 R 7 R
1 R 2 R Student handbooks 3 R 4 R 5 R 6 R 7 R
1 R 2 R Career counseling 3 R 4 R 5 R 6 R 7 R
1 R 2 R TCC website 3 R 4 R 5 R 6 R 7 R
1 R 2 R Other 3 R 4 R 5 R 6 R 7 R
6. How many 4-year colleges/universities did you apply to for transfer?
1R One 2 R Two 3 R Three 4 R More than three
7. What 4-year college/university was your 1st choice?
8. What 4-year college/university did you ultimately choose to attend?
9. Was the 4-year college/university you ultimately chose your
1R 1st choice 2 R 2nd choice 3 R 3rd choice 4 R Other
10. Did your 4-year college/university accept all of TCC's credits? 1R Yes 2 R No
If NO, which credits were not accepted?
11. Did you have any major problems associated with your transfer? 1R Yes 2 R No
If YES, please explain.
12. When you left TCC, were you prepared for the academic atmosphere of a 4-year
college/university? 1R Yes 2 R No
If NO, in what areas could have better prepared you?
13. Please rate TCC's proficiency in preparing you to be successful in meeting the following demands of a 4-year
college/university:
Please use
marks
EXCELLENT VERY GOOD GOOD FAIR POOR
Difficulty/amount of reading 1 R 2 R 3 R 4 R 5 R
Writing skills 1 R 2 R 3 R 4 R 5 R
Vocabulary 1 R 2 R 3 R 4 R 5 R
Speaking skills 1 R 2 R 3 R 4 R 5 R
Study skills/habits 1 R 2 R 3 R 4 R 5 R
Math skills 1 R 2 R 3 R 4 R 5 R
Critical thinking 1 R 2 R 3 R 4 R 5 R
Problem solving skills 1 R 2 R 3 R 4 R 5 R
Computer skills (in general) 1 R 2 R 3 R 4 R 5 R
14. Would you recommend TCC to your friends or acquaintances? 1R Yes 2 R No
15. Overall, how would you rate the preparation you received at TCC for transfer?
1 R Excellent 2 R Very Good 3 R Good 4 R Fair 5 R Poor
16. Please indicate your educational status as of Spring 2005.
1 R Full-time 2 R Part-time 3 R Not continuing education at this time
17. Do you expect to complete your four-year degree? 1R Yes 2 R No
If YES, how many years after transfer will it take you to complete your degree?
1 R 1 Year 2 R 2 Year 3 R 3 Years 4 R 4+ Years
18. If you have any ideas on how to improve the transfer process, please comment in the space below.
Thank you for completing this survey!