Department:
National Treasury Department:
REPUBLIC OF SOUTH AFRICA
national treasury
Foreword ... I
1. Introduction ...1
About this report ... 1
The evolution of government debt management ... 1
2. An overview of the South African debt market ...2
Bond market ... 2
Money market ... 3
Repo market ... 3
Government’s funding instruments ... 4
Legal and regulatory framework ... 9
3. Government’s debt position and the fiscal framework ... 12
Debt position ...12
Fiscal framework ...12
4. Financing activities, 2011/12... 14
Treasury bills ...14
Corporation for Public Deposits ...15
Fixed-rate bonds ...15
Inflation-linked bonds ...15
Floating-rate notes ...16
Retail savings bonds ...16
Foreign currency bonds ...17
Bond buyback programme ...17
5. Funding strategy, 2012/13 ... 18
6. Debt portfolio, holdings and investor trends ... 20
Status of government debt portfolio ...20
Debt portfolio against risk benchmarks...22
Holdings of government securities ...23
Investor trends ...25
Guarantees ...26
7. Cash management ... 28
8. Sovereign credit risk ... 29
9. Investor relations ... 30
Glossary... 31
Table 1: Summary of listings, 31 March 2012 ...2
Table 2: National government debt, contingent liabilities and debt-service costs, 2011/12 – 2014/15 ... 12
Table 3: Consolidated government budget balance, 2008/09 – 2014/15 ... 13
Table 4: Financing of national government net borrowing requirement, 2011/12 – 2012/13 ... 14
Table 5: Treasury bill auction performance, 2011/12 – 2012/13 ... 14
Table 6: Fixed-rate bonds auction performance, 2011/12 ... 15
Table 7: Inflation-linked bonds auction performance, 2011/12 ... 15
Table 8: Retail savings bonds – payments and receipts, 2011/12... 16
Table 9: Eurobond issuance, 2011/12 ... 17
Table 10: Weekly Treasury bill auction levels, 2012/13 ... 18
Table 11: Change in cash balances, 2011/12 – 2012/13 ... 19
Table 12: Government debt portfolio, 31 March 2012 ... 20
Table 13: Treasury bill portfolio, 31 March 2012 ... 20
Table 14: Domestic currency bond portfolio, 31 March 2012 ... 21
Table 15: Foreign currency bond portfolio, 31 March 2012 ... 21
Table 16: Modified duration and average term-to-maturity, 31 March 2012 ... 22
Table 17: Guarantees held by major state-owned companies and development finance institutions, 2011/12 ... 27
Table 18: National government cash balances, 31 March 2012 ... 28
Table 19: South Africa’s sovereign credit ratings, 31 March 2012 ... 30
Figure 1: Evolution of debt management in South Africa ...1
Figure 2: JSE turnover (South African bond market) and international comparison, 2011 ...3
Figure 3: Repo market turnover and participants in South African bond market ...4
Figure 4: Consolidated maturity profile of government debt, 31 March 2012 ... 23
Figure 5: Holdings distribution of outstanding Treasury bills, 31 March 2012 ... 23
Figure 6: Holders of the South African bonds, 31 March 2012 ... 24
Figure 7: Holdings of South African fixed-rate bonds, 31 March 2012 ... 24
Figure 8: Holdings of South African inflation-linked bonds, 31 March 2012 ... 25
Figure 9: Age distribution of investor base, 31 March 2012 ... 25
Figure 10: Investor distribution for South Africa’s US$1.5 billion 12-year bond ... 26
FIGURES
Foreword
This is the first annual debt management report produced by the National Treasury. The report, which describes the scope of the government’s debt portfolio and the range of instruments that South Africa uses to meet its borrowing requirements, is part of our commitment to transparency.
The report covers the 2011/12 fiscal year, which ran from 1 April 2011 to 31 March 2012. This period was marked by continued volatility in global financial markets, with consequences for South Africa and other emerging economies. At the same time, the continuing crisis in the Eurozone highlights the importance of prudent debt management.
South Africa is benefiting from the careful and considered approach that it has applied to managing state debt over the past decade. Our stance is informed by the principle of long-term debt sustainability, which complements our efforts to accelerate and broaden economic growth in partnership with the private sector.
South Africa’s capital markets are liquid and deep. The government promotes the development of the bond market by issuing diverse funding instruments. Our risk management framework enables us to keep debt costs within acceptable risk levels. Active management has improved the maturity profile of state debt by reducing the refinancing risks. The investor relations programme has ensured that domestic and foreign investors are an important part of debt management and funding activities.
This report is intended for investors here and abroad – and for all South Africans interested in how the government is handling state debt costs, with an eye on both the present and the future. We welcome any comments, which will be used to improve these reports in the years ahead.
Lungisa Fuzile
1. Introduction
About this report
In the 2012 Budget Review, the Minister of Finance announced that the National Treasury, which is responsible for managing the finances of the national government, would begin to publish annual reports on South Africa’s public debt management as part of its commitment to transparency. This is the first such report.
The government holds South Africa’s largest debt portfolio. This report describes how the portfolio is managed to ensure that the level and rate of growth in public debt is sustainable.
The debt management strategy aims to meet the government’s financing requirements at the lowest possible cost over the medium-to-long term, consistent with an acceptable degree of risk. In support of this goal, the government works to develop the country’s capital and money markets by ensuring efficient functioning of the market for government securities, maintaining benchmark bonds, and actively managing the maturity structure and the composition of state debt.
The evolution of government debt management
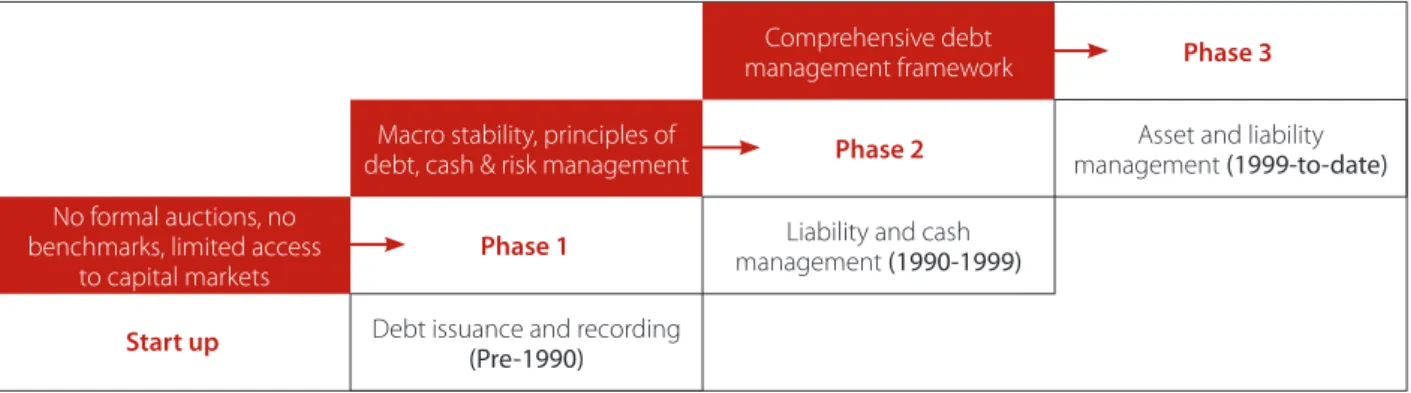
Management of government debt has evolved substantially over the past several decades. The need to develop the debt capital market was identified in the late 1970s.1 Before 1990, the state issued debt three or four times a year. Government bonds were
issued at par when needed and issuance usually coincided with the date of maturing bonds. There were no formal auctions, liquid benchmarks, active secondary market or prevailing market rate. Post-1994, the government began developing macroeconomic frameworks to inform guidelines and active debt management strategies.
To promote the debt capital market and allow for self-regulation, a formal bond exchange – the Bond Exchange of South Africa (BESA)2 was formed in 1996. At the same time, the South African Reserve Bank was appointed as an issuer of and settlement agent for
government bonds. With the necessary institutions in place, discussion on how to improve primary issuance and secondary market activity in government bonds followed. Beginning in 1998, auctions were conducted regularly at predetermined dates. Twelve primary dealers were appointed to ensure market efficiency, liquidity and transparency.
Before 1999, the main objectives of debt management were to develop the domestic market and promote a balanced maturity profile. After 1999, the focus shifted to reducing the cost of debt to within acceptable risk limits, ensuring the government’s access to domestic and international financial markets, and diversifying funding instruments. These objectives continue to anchor the government’s debt management strategy.
Figure 1: Evolution of debt management in South Africa
Source: National Treasury
1 De Kock commission, the Stals report and the Jacobs report. 2 BESA merged with Johannesburg Stock Exchange in 2009.
Comprehensive debt management framework Macro stability, principles of
debt, cash & risk management management Asset and liability (1999-to-date)
No formal auctions, no benchmarks, limited access
to capital markets
Liability and cash management (1990-1999)
Debt issuance and recording
(Pre-1990)
Phase 1 Start up
Phase 2
2. An overview of the South African debt market
Bond market
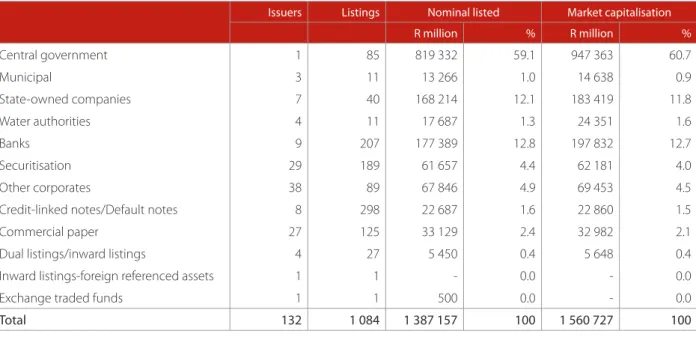
The domestic bond market has experienced substantial growth since 1996. Government has played a pivotal role in this process by creating benchmarks for other issuers. Today, there are 132 issuers providing 1 084 debt instruments.
Government continues to dominate primary listings, accounting for 59 per cent of the nominal listings value of R1.4 trillion at March 2012. In recent years there has also been a large increase in the primary issuance by state-owned companies.
In 1981, the Electricity Supply Commission (Eskom) was the first public entity to issue a bond. The number of state-owned companies issuing debt has since increased to seven, with total issued debt amounting to R168.2 billion. The surge in primary issuance is mainly attributable to expanded investment in public-sector infrastructure.
Table 1: Summary of listings, 31 March 2012
Issuers Listings Nominal listed Market capitalisation
R million % R million %
Central government 1 85 819 332 59.1 947 363 60.7
Municipal 3 11 13 266 1.0 14 638 0.9
State-owned companies 7 40 168 214 12.1 183 419 11.8
Water authorities 4 11 17 687 1.3 24 351 1.6
Banks 9 207 177 389 12.8 197 832 12.7
Securitisation 29 189 61 657 4.4 62 181 4.0
Other corporates 38 89 67 846 4.9 69 453 4.5
Credit-linked notes/Default notes 8 298 22 687 1.6 22 860 1.5
Commercial paper 27 125 33 129 2.4 32 982 2.1
Dual listings/inward listings 4 27 5 450 0.4 5 648 0.4 Inward listings-foreign referenced assets 1 1 - 0.0 - 0.0
Exchange traded funds 1 1 500 0.0 - 0.0
Total 132 1 084 1 387 157 100 1 560 727 100
Source: JSE
South Africa has a highly liquid, sophisticated bond market. In 2008, the BESA was named the most innovative capital markets regulator in Africa at the Africa Investor index series awards in New York.
The secondary market is dominated by over-the-counter (OTC) trading. The OTC market operates on a “report only” basis, meaning that transactions are not concluded in real time, but are reported after they have been concluded and settled. The main participants in the secondary market are brokers, interdealer brokers, market makers (mostly primary dealers) and investors. Bond market investors include banks, pension funds, insurance companies and fund management companies. Turnover in the secondary market has grown from R11 trillion in 2000 to a high of R21 trillion in 2011. The nominal amount outstanding on the South African bond market turned over 15 times in 2011.
Figure 2: JSE turnover (South African bond market) and international comparison, 2011
Source: World Federation of Exchanges, JSE
Activity in the secondary market compares favourably with other international markets. The World Federation of Exchanges ranked the Johannesburg Stock Exchange (JSE) third by market turnover in the 2011 calendar year, contributing US$2.9 trillion or 9 per cent to total global turnover of US$33 trillion.
Money market
On 22 February 2010, the money market officially migrated to a fully electronic dematerialised3 environment, allowing for enhanced
processing. Beneficial ownership is recorded and updated in the central depository securities ownership register kept by Share Transactions Totally Electronic (STRATE).
Repo market
Repurchase (repo) transactions are buy/sell-back transactions involving the sale of securities, accompanied by a later buy transaction. This type of transaction is widely used by domestic banks that require access to cash on a short-term, flexible basis. Repo transactions use bonds as security – while asset ownership is transferred from the seller to the buyer, the seller retains the financial benefit. Repo market volumes have risen from just over R6 trillion in 2000 to R14 trillion in 2011 (see Figure 3). The domestic repo market is expected to continue to grow, due in part to increased trading and active bond market participation from offshore investors. The main participants are banks acting as primary dealers in the government securities market.
3 Dematerialisation is the elimination of physical certificates or documents of title which represent the ownership of securities so that the securities exist only as electronic records
R trillion
2000 2001 2002 2003 2004 2005 2006 2007 2008 2009 2010 2011
25 20 15 10 5 0 US$ million 20,000,000 10,000,000 0
BME Spanish Exanges 17,411,557 5,394,300 2,898,138 2,674,472 1,406,148 915,516 747,191 590,439 518,025 London SE Group
Johannesburg SE NASDAG Nordic Exchange Other Colombia SE Korea Exchange Oslo Børs Istanbul SE
Figure 3: Repo market turnover and participants in South African bond market
Source: JSE
Government’s funding instruments
Domestic short-term loans
Domestic short-term borrowing consists of Treasury bills and cash borrowings from the broader public sector through the Corporation for Public Deposits (CPD). Although Treasury bill issuance is included in the financing of the borrowing requirement, occasionally the need arises for additional short-term financing. For purposes of cash management and financing, government can issue either very short-dated Treasury bills, increase the 91-day Treasury bills, issue longer maturity bills, enter into repo transactions, or use cash deposits with the Reserve Bank (sterilisation deposits, foreign currency swap transactions and the pool of broader public-sector cash).
Treasury bills
Treasury bills are short-term, rand-denominated debt instruments. They are sold at a discount to par and carry no coupon. Treasury bills are issued to the market at different maturities, from one day to 12 months, and are redeemable at par on maturity. Treasury bills are issued by the National Treasury on behalf of the Minister of Finance, representing the government.
Issuance process
Treasury bills are usually issued weekly by invitation to tender, by private placement, or by another means the National Treasury may choose. The Reserve Bank acts as an issuer agent of the National Treasury, and is authorised to receive and deal with applications for Treasury bills.
Bids can only be submitted through the Money Market Internet System – an internet-based auction system that allows pre-registered users to submit online bids. Members of the Financial Services Board (FSB), members of the JSE, companies listed on the JSE and state-owned companies can register with the Reserve Bank to use this system.
Auctions
The National Treasury issues an instruction to the Reserve Bank to issue Treasury bills on its behalf at the beginning of the fiscal year. Should the auction amount increase or decrease during the year, the National Treasury notifies the Reserve Bank.
R trillion
2000 2001 2002 2003 2004 2005 2006 2007 2008 2009 2010 2011
16 14 12 10 8 6 4 2 0
Per cent
0 10 20 30 40 50 60 70 80 90
Issuers
Non-aligned(brokers) Other banks
Primary dealers 3
4
11
82
As the issuer agent, the Reserve Bank issues an invitation to participate in the weekly Friday auction of Treasury bills on the business day prior to the day of the auction. Should Friday be a public holiday, the auction takes place on Thursday and the invitation is issued on Wednesday.
The invitation for bids, published on electronic news services (Reuters, Bloomberg, I-Net Bridge and so on) and on the Reserve Bank’s website, includes the following information:
• Auction date
• Amount of Treasury bills on offer for the different maturities • Closing time of the auction
• Settlement date for the auction and
• Announcement time of the results of the auction.
If bidders are unable to submit bids via the Money Market Internet System, telephonic bids followed by fax or SWIFT4 confirmation
may be submitted. Bids must be for a minimum of R100 000 and in multiples of R10 000 thereafter. Banks must submit separate bids in instances where they bid for themselves and their clients.
Allotment of Treasury bills in each maturity is made sequentially in descending order of the prices bid, from the highest to the lowest price. At the lowest price accepted, Treasury bills are, if necessary, allotted on a pro-rata basis in relation to the amount available at that price. The calculation of the pro-rata allotments are made to the nearest R10 000 and take into consideration the different amounts tendered by each of the bidders at that price.
Results of the auctions are announced, along with details concerning the issuance, on electronic news services and the Reserve Bank’s website.
Settlement
Settlement of the normal weekly auctions is done electronically via the South African Multiple Option Settlement system three days after the close of trade. (This is referred to as T+3, where T stands for trade day). The settlement timeframe can change to ensure that the settlement of the new issuance coincides with the settlement of the maturing Treasury bills. All participants are required to have an account with a bank acting as a settlement agent. Treasury bills are not repayable prior to their maturity date.5
Corporation for Public Deposits
The CPD is a wholly-owned subsidiary of the Reserve Bank. The corporation facilitates the banking arrangements of the government and state-owned companies with the Reserve Bank that allow for inter-lending among these entities with the approval of the National Treasury. The CPD’s main function is to invest money received from the government. The corporation’s activities are managed and controlled by a board of directors appointed by the Minister of Finance. The broader public sector, provinces and some state-owned companies are required to invest their cash with the CPD. The government at times borrows from the CPD to finance a portion of the borrowing requirement.
Domestic long-term loans
The National Treasury funds a sizable portion of the borrowing requirement in the domestic capital market. Domestic long-term funding consists of fixed-rate and inflation-linked bonds.
4 Society for Worldwide Interbank Financial Telecommunication
Fixed-rate bonds
Issuance processFixed-rate bonds pay a fixed coupon rate until the redemption date. They are issued through a panel of eight primary dealers. Only banks are eligible to be part of the primary dealer system. Applicants are required to have at least R1 billion of Tier I capital as defined in the Basel international banking accords and be members of the JSE.
Primary dealers are obliged to participate actively in the weekly auctions by submitting minimum competitive bids equal to14.5 per cent of the amount offered on each bond. In addition, primary dealers are required to quote a two-way price from 8h30 to 16h30 local time. However, they are not obliged to quote prices within 10 minutes of the auction closing time and until the results of the auction are announced.
The National Treasury provides primary dealers with an incentive through a non-competitive bid auction, where they can exercise an option of taking up to 30 per cent of the allocated amount at the same clearing yield of the fixed-rate competitive bid auction. This option remains open for 48 hours after the auction closes. In addition, primary dealer status and performance are given a high weighting in the selection of banks chosen to lead-manage foreign currency issuances.
Auctions
The National Treasury conducts weekly bond auctions according to a calendar published at the beginning of the fiscal year on the websites of both the National Treasury and the Reserve Bank. The nominal amount to be issued on a weekly basis is determined at the beginning of each fiscal year and remains unchanged, unless there is a compelling need to adjust it. Any proposed change is communicated in advance.
Fixed-rate bond auctions are announced on Wednesdays and the auction takes place on the following Tuesdays.6 Decisions about
which bonds to issue, and the corresponding amounts, are made on the announcement day. The announcement letter is sent out to the Reserve Bank for publication and published on electronic news services. The letter specifies the bonds, the amounts on each bond, announcement and settlement days.
On auction day, primary dealers submit bids through the Reserve Bank, which serves as issuance agent of the National Treasury. The Dutch7 auction style is applied. The National Treasury is the price taker for fixed-rate bond auctions because the amount on offer is
fully allocated regardless of the clearing levels. Currently there are three bonds on offer per auction.
The auction starts at 10h00 and closes at 11h00 local time. Bids are submitted on a yield basis and bidders can change bids during the course of the auction. However, once the auction closes, all bids are fixed and final.
Settlement
The South African bond market employs a rolling settlement system, in which transactions become due for settlement a set number of business days after trade. Rolling settlement has been introduced on a T+3 basis for bonds.
After the weekly bond auction, both the National Treasury and the Reserve Bank complete a deal sheet and capture it in their back office systems. On the next business day after the auction (T+1), the Reserve Bank sends the deal sheet to the National Treasury for confirmation. When both parties confirm the details of the trades, the National Treasury tops up the STRATE system with the new issued nominal amount, allowing the Treasury to place new or additional securities into the market via the central securities depository (CSD) system.
6 If the Wednesday or Tuesday is a public holiday, both the announcement and auction are pushed back to the next business day. 7 Single price auction – bidders are allocated at the highest accepted bid price/yield.
Inflation-linked bonds
Issuance processInflation-linked bonds provide investors with a direct hedge against inflation. These bonds were introduced in South Africa in 2000. The principal amount is adjusted according to changes in the headline inflation rate. Although the coupon rate is fixed, the interest payment is based on the inflation-adjusted outstanding amount.
Auctions
Inflation-linked bond auctions are announced on Mondays and take place on the Friday of the same week. There are no primary dealers for inflation-linked bonds, but auction participants are required to sign a master agreement with the Reserve Bank as an issuer agent, and must be a member of the JSE.
The decision on the bond and amount to be issued is based on market assessment and National Treasury analysis. Unlike fixed-rate bond auctions, where the National Treasury is a price taker, in inflation-linked bond auctions the Treasury reserves the right to either fully allocate or under-allocate the amount on offer, depending on the competitiveness of bids submitted relative to market yield. The results are published immediately after the auction on the Reserve Bank website, and the history of auction results is available on the National Treasury’s investor website.8 The auction results reflect the total amount of bids received, amount allotted, best and
worst bids, bid to cover ratio, clearing yield and other details.
Settlement
The settlement process is the same as the fixed-rate bonds settlement process outlined earlier.
Zero-coupon bonds
Zero-coupon bonds are issued at discount and redeemed at par. The bonds do not pay coupon, they make only one payment, which is the principal amount on the maturity date. The bonds are no longer used as funding instruments.
Floating-rate notes
The coupon rate of the floating-rate note is derived from the 91-day Treasury bill and is adjusted quarterly. The instrument is no longer used by the government as a funding instrument.
Retail savings bonds
The National Treasury introduced retail savings bonds in 2004 to encourage South Africans to build up their savings. The retail bond market landscape has improved since 2004, with more banks offering similar products. Unlike conventional government bonds, retail bonds are non-marketable instruments – in other words, they are not resold in the secondary market.
The bonds are available from www.rsaretailbonds.gov.za, and at a range of retail outlets, such as the Post Office. South Africans or permanent residents in possession of a valid identification document are eligible to invest in government retail bonds. Three types of bonds are available: fixed-rate, inflation-linked and cooperative bonds.9 The minimum investment is R1 000 and the maximum is
R5 million. Each deposit constitutes a single investment.
8 http://investor.treasury.gov.za
9 The product was officially launched by the National Treasury during the Cooperative Financial Institutions Indaba in Cape Town in October 2011. It is targeted at financial services cooperatives, cooperative banks and cooperative financial institutions.
Fixed-rate retail bonds are available over 2-, 3- and 5-year periods, and inflation-linked retail bonds offer inflation protection over 3-, 5- and 10-year periods. Investors in fixed-rate retail bonds can receive interest payments semi-annually or reinvest the interest payable, while inflation-linked retail bonds investors do not have an option to reinvest the interest. Inflation-linked retail bonds investors receive capital adjustment in line with inflation and interest payments semi-annually. Investors who are aged 60 or older can opt to have their interest paid out monthly. On inflation-linked retail bonds, the real coupon rate is payable on the inflation-adjusted amount.Interest rates for retail savings bonds are derived from government bond yield curves. The historical and current rates can be accessed from the website.
Foreign currency bonds
The government funds part of its foreign currency commitments in international capital markets using marketable and non-marketable loans. Marketable loans can be traded in secondary markets; non-non-marketable loans cannot. Foreign currency bonds are an example of marketable loans. Multilateral loans and export credit agency funding are examples of non-marketable loans. Foreign currency marketable bonds form a large portion of the foreign currency loan portfolio.
Foreign currency bonds are also issued for benchmarking purposes. A benchmark bond provides a standard against which the performance of other bonds can be measured. Government creates and maintains benchmark bonds in foreign currencies to provide a pricing reference point for South African corporations and state-owned companies to borrow internationally. Foreign currency bonds are issued to diversify sources of funding, reducing concentration risk.
Pre-issuance
Once a decision has been made to issue foreign currency bonds, the National Treasury asks banks to submit funding proposals. Following evaluation, short-listed banks are interviewed to discuss salient features of their proposals and/or any updates since they submitted their proposals. After these interviews, bidders are recommended for approval.
Issuance
The winning bidders work with the National Treasury to ensure successful issuance, assessing matters such as size, maturity, currency, costs and timing of the transaction. The major determinant of the issue size is the level of funding required. The issue must be large enough to act as a liquid benchmark. If it is not, the National Treasury can tap the bond to increase to a liquid benchmark size. Issuance is done into the most active and liquid currency (reflecting which currency investors are active in, which will further influence price dynamics). The choice of currency is also influenced by the need to diversify funding currencies and to build robust yield curves in major currencies.
Post-issuance
The National Treasury is responsible for coupon payments and paying the principal at maturity date. As an issuer in the dollar and yen market, the National Treasury is obliged to disclose issues of material importance to the US Securities and Exchange Commission and the Japan Kanto Local Financial Bureau. Each year an 18K document is filed with the US authorities providing a detailed account of noteworthy economic or political developments in the country. The document is subsequently translated and filed with the Japanese authorities.
Bond buyback programme
Bond buyback can occur on a cash and/or switch basis. A cash basis involves the exchange of a bond for cash; a switch basis involves the exchange of one bond for another bond. The government conducts the bond buyback programme on a switch basis (switch auctions) as part of the liability management strategy.
Switches are used primarily to reduce near-term exposure to refinancing risk. The switch programme is announced in the National Treasury’s annual Budget Review, followed by the publication of the switch auction calendar. Primary dealers are eligible to participate in the auction as prescribed in the terms and conditions. Other participants can submit their bids through the primary dealers. The American10 auction style is used and bids are submitted on a yield basis or price basis, depending on the terms and conditions
of a particular source bond. For instance, floating-rate notes in South Africa are traded on a price basis, while fixed-rate and inflation-linked bonds are traded on a yield basis.
A cash-neutral switch method is used, based on the all-in-price pricing method. The indicative yield or price is set on the auction day and the National Treasury reserves the right to allocate less or none of the offered amount, depending on the market conditions.
Legal and regulatory framework
Legal framework
The Constitution of the Republic of South Africa (Chapter 13) mandates the National Treasury to ensure transparency, accountability and sound financial controls in the management of public finances.
The National Treasury’s legislative mandate is also stipulated in the Public Finance Management Act (1999) (PFMA). Section 66(2)(a) of the PFMA gives the Minister of Finance powers to commit the National Revenue Fund to future financial commitments by borrowing money, issuing a guarantee, indemnity or security, or entering into any other binding transaction. The Minister can borrow: • To finance a national budget deficit
• To refinance maturing debt or a loan paid before the redemption date • To obtain foreign currency
• To maintain credit balances on the bank account of the National Revenue Fund • To regulate internal monetary conditions should the necessity arise
• Or any other purpose approved by the National Assembly by special resolution.
The Minister authorises and approves all domestic and foreign borrowing by national government.
Regulatory framework
South Africa maintains a decentralised financial regulatory structure.
Financial Services Board
The FSB is the primary regulator supervising the functioning of the financial markets. It was established by the Financial Services Board Act (1990). Its functions are to:
• Supervise compliance with laws regulating financial institutions and financial services • Advise the Minister of Finance on matters concerning financial institutions and services
• Promote consumer education programmes and initiatives by financial institutions and bodies representing the financial services industry.
The FSB exercises its regulatory, supervisory and enforcement duties to regulate the capital markets in terms of the Securities Service Act (2004). A recent review of this legislation by the National Treasury and the FSB concluded that it should be replaced by a Financial Market Bill, which has been tabled in Parliament. The bill updates the legislation, taking into account developments in international regulation and developments in South Africa’s broader regulatory framework. The bill will promote a more robust regulatory framework for unlisted securities, enable central reporting for derivative transactions and strengthen efforts to combat market abuse, including insider trading.
Johannesburg Stock Exchange
The JSE is defined as a self-regulatory organisation under the Securities Service Act. It provides listing requirements and trading platforms in a transparent, efficient and orderly marketplace. It also regulates applications for listings and the obligations of listed companies. South Africa was ranked first out of 142 countries for regulation of securities exchanges according to the World Economic Forum Global Competitive Report 2011/12.
JSE listings include equities, bonds, commodities and currency derivatives. In June 2009, BESA became a wholly-owned subsidiary of the JSE, giving investors a platform to trade products in cash and derivatives markets.
New JSE debt-listing requirements came into effect in 2011. Highlights include the following:
• All issuers – including the National Treasury, which was previously exempt – are required to appoint a debt sponsor.
• Where unusual features exist regarding a listing, the JSE must be consulted to discuss such features at the earliest possible date. • The issuer shall publish on the real-time Stock Exchange News Service (SENS) details of any new issues or tap issues, and
communication with investors.
• Issuers are required to submit placing and other documents to list debt securities.
• Debt securities to be listed on the JSE shall be cleared and settled through central securities depository participants (CSDPs) and STRATE.
JSE listings – including vanilla bonds, note programmes and commercial paper – attract both initial and annual listing fees.
Share Transactions Totally Electronic
STRATE is defined as a self-regulatory organisation under the Securities Service Act. STRATE, along with its CSDPs, is responsible for ensuring the safe custody and record keeping of securities. A CSD must be licensed by the FSB on an annual basis. STRATE Ltd is currently the only licensed depository in South Africa. Under the Securities Service Act it is responsible for:
• The custody and administration of securities • The clearing of transactions in listed securities • The settlement of transactions in listed securities.
A participant in a CSD is usually a bank that holds securities on behalf of clients and deposits them into the depository in terms of its rules. STRATE has accepted and supervises nine participants to hold equities and bond securities in the CSD, and during 2011/12 it accepted three international participants.
South African Reserve Bank
The main objective of the Reserve Bank is to achieve and maintain price stability in the interest of balanced and sustainable economic growth in South Africa. The banking supervision department regulates the banking activities (deposit-taking) of commercial banks and is responsible for:
• Updating and communicating the regulatory framework according to international standards • Interacting with key players in the banking industry
• Developing and enhancing supervisory processes • Enhancing business intelligence tools
• Communicate concerning illegal deposit-taking.
The legal framework for the regulation and supervision of banking groups in South Africa is composed of the Banks Act (1990) and its associated regulations and directives.
3. Government’s debt position and the fiscal framework
Debt position
National government debt amounted to R1.2 trillion on 31 March 2012. The government’s level of indebtedness, measured as the aggregate of net debt, provisions and contingent liabilities as a percentage of gross domestic product (GDP), reached 46.6 per cent in 2011/12, and is projected to peak at a sustainable 50.1 per cent of GDP in 2013/14 before declining to 49.8 per cent in 2014/15. This trend is mirrored in debt-service costs, which reached 2.6 per cent of GDP in 2011/12 and is projected to peak at 2.8 per cent of GDP in 2013/14.
Table 2: National government debt, contingent liabilities and debt-service costs, 2011/12 – 2014/15
2011/12 2012/13 2013/14 2014/15
R billion Preliminary outcome Medium-term estimates
Domestic debt
Gross 1 070.9 1 247.4 1 430.6 1 595.6
Net 940.5 1 138.3 1 327.2 1 493.4
Foreign debt
Gross 116.9 107.5 97.6 99.3
Net 52.5 51.1 43.5 44.3
Total gross debt 1 187.8 1 354.9 1 528.2 1 694.9
Total net debt 993.0 1 189.4 1 370.7 1 537.7
as % of GDP 33.1 36.0 37.8 38.5
Provisions 94.4 97.2 92.8 94.8
Contingent liabilities 310.8 338.9 352.6 358.9
of which guarantees 170.1 198.6 217.3 228.2
Net debt, provisions, contingent liabilities 1 398.2 1 625.5 1 816.1 1 991.4
as % of GDP 46.6 49.2 50.1 49.8
Debt-service costs
Domestic 70.5 82.6 94.6 103.1
Foreign 6.0 6.8 6.2 5.9
Total 76.5 89.4 100.8 109.0
as % of GDP 2.6 2.7 2.8 2.7
Source: National Treasury
Fiscal framework
The government’s fiscal stance builds on three principles:
• Counter-cyclicality means spending more relative to GDP during periods of economic weakness and less during periods of strong economic growth.
• Long-term debt sustainability means ensuring that spending levels do not continually increase debt and interest costs. • Intergenerational equity means that future generations should not be overburdened by the costs of current spending. By applying these principles consistently, the government can improve economic conditions and strengthen its fiscal position in a volatile global environment.
Table 3 shows the actual and projected consolidated government budget balance over a seven-year period. From 2012/13, the fiscal position will improve as reflected in declining budget deficits. Lower deficits reduce the government’s gross borrowing requirement, resulting in a slower growth in debt stock and debt-service costs.
Table 3: Consolidated government budget balance, 2008/09 – 2014/15
2008/09 2009/10 2010/11 2011/12 2012/13 2013/14 2014/15
R million Outcome Estimate Medium-term estimates
National government -27 158 -167 518 -135 403 -156 648 -170 025 -159 536 -142 358
% of GDP -1.2 -6.9 -4.9 -5.2 -5.2 -4.4 -3.6
Provincial government -8 690 108 5 270 2 522 7 432 7 293 9 626
% of GDP -0.4 0.0 0.2 0.1 0.2 0.2 0.2
Extra budgetary institutions 10 828 7 823 13 474 11 789 9 102 8 988 11 216
% of GDP 0.5 0.3 0.5 0.4 0.3 0.2 0.3
Consolidated budget balance -25 020 -159 587 -116 659 -142 337 -153 491 -143 255 -121 516
% of GDP -1.1 -6.5 -4.2 -4.8 -4.6 -4.0 -3.0
4. Financing activities, 2011/12
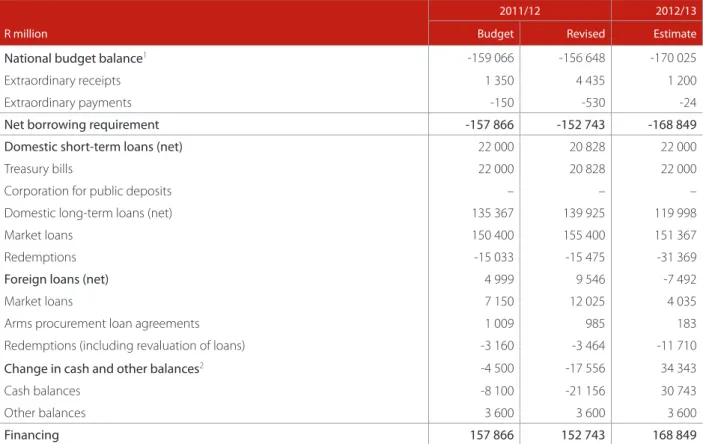
The 2011 Budget tabled by the Minister of Finance projected a net borrowing requirement of R157.9 billion. This excludes loan redemptions, meaning the repurchase of bonds at or before maturity. The revised outcome for the borrowing requirement during 2011/12 was R152.7 billion, R4 billion lower than planned. This difference was mainly due to an increase in cash balances resulting from revenue overruns and underspending.
Table 4: Financing of national government net borrowing requirement, 2011/12 – 2012/13
2011/12 2012/13
R million Budget Revised Estimate
National budget balance1 -159 066 -156 648 -170 025
Extraordinary receipts 1 350 4 435 1 200
Extraordinary payments -150 -530 -24
Net borrowing requirement -157 866 -152 743 -168 849
Domestic short-term loans (net) 22 000 20 828 22 000
Treasury bills 22 000 20 828 22 000
Corporation for public deposits – – –
Domestic long-term loans (net) 135 367 139 925 119 998
Market loans 150 400 155 400 151 367
Redemptions -15 033 -15 475 -31 369
Foreign loans (net) 4 999 9 546 -7 492
Market loans 7 150 12 025 4 035
Arms procurement loan agreements 1 009 985 183
Redemptions (including revaluation of loans) -3 160 -3 464 -11 710
Change in cash and other balances2 -4 500 -17 556 34 343
Cash balances -8 100 -21 156 30 743
Other balances 3 600 3 600 3 600
Financing 157 866 152 743 168 849
Source: National Treasury
Treasury bills
In 2011/12, total issuance of Treasury bills amounted to R357.9 billion. After redemptions of R338.9 billion, net issuance amounted to R19 billion, R1.8 billion lower than planned. The average bid to cover ratio of auctions was 2.3 times the amount on offer.
Table 5: Treasury bill auction performance, 2011/12 – 2012/13
Issuance Average yield Average bid to cover ratio
Maturities R million % times
91-day 201 122 5.54 1.71
182-day 71 680 5.66 2.36
273-day 50 960 5.78 2.38
364-day 34 150 5.88 2.58
Source: National Treasury
1 A negative number reflects a deficit
Corporation for Public Deposits
During the final quarter of 2011/12, total balances in the government’s CPD portfolios peaked at R47 billion, of which R25.9 billion was investments by provincial governments. The government’s borrowing from the CPD peaked at R35.4 billion in 2011/12.
Fixed-rate bonds
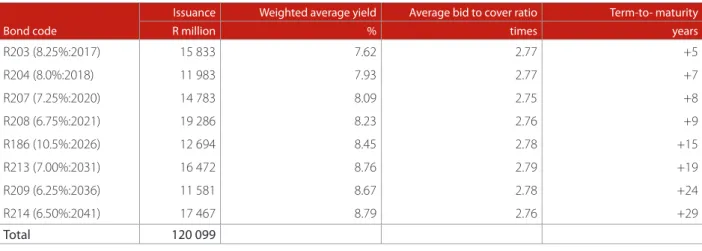
The domestic capital market remains the main source of financing for the borrowing requirement, accounting for over 80 per cent of the gross borrowing requirement in 2011/12. A nominal amount of R120 billion was issued for fixed-rate bonds. Fixed-rate bonds accounted for 79 per cent of total issuance and the remaining 21 per cent was raised using inflation-linked bonds. The split between fixed-rate and inflation-linked bonds is informed by risk management guidelines.
The fixed-rate bond weekly auction nominal amount of R2.1 billion was maintained in 2011/12. In January 2012 the number of bonds issued per auction was increased from two to three. Issuance was fairly spread across the curve. Table 6 shows the performance of fixed-rate bonds during the year.
Table 6: Fixed-rate bonds auction performance, 2011/12
Issuance Weighted average yield Average bid to cover ratio Term-to- maturity
Bond code R million % times years
R203 (8.25%:2017) 15 833 7.62 2.77 +5
R204 (8.0%:2018) 11 983 7.93 2.77 +7
R207 (7.25%:2020) 14 783 8.09 2.75 +8
R208 (6.75%:2021) 19 286 8.23 2.76 +9
R186 (10.5%:2026) 12 694 8.45 2.78 +15
R213 (7.00%:2031) 16 472 8.76 2.79 +19
R209 (6.25%:2036) 11 581 8.67 2.78 +24
R214 (6.50%:2041) 17 467 8.79 2.76 +29
Total 120 099
Source: National Treasury
The bid to cover ratio of 2.8 indicates that the amount of bids received was, on average, more than double the offered amount. Most importantly, the nominal bond auctions cleared at an average of two basis points below prevailing market rates, reflecting strong demand.
Inflation-linked bonds
The nominal weekly auction amount was increased in October 2011 from R600 million to R800 million. The increment was initiated to make up for the shortfall in the non-competitive bid auctions. In 2011/12 the National Treasury issued nominal R30 billion in 48 auctions.
Table 7: Inflation-linked bonds auction performance, 2011/12
Issuance Weighted average yield Average bid to cover ratio Term-to- maturity
Bond code R million % times years
R212 (2.75%: 2022) 9 280 2.36 2.8 +9
R210 (2.60%: 2028) 8 320 2.49 3.3 +16
R202 (3.45%: 2033) 10 287 2.52 2.8 +21
Total 30 117
There are currently six inflation-linked bonds in the debt portfolio, of which four are used as funding instruments. The R189 (6.25 per cent: 2013) and R197 (5.50 per cent: 2023) bonds are currently not used for funding purposes due to refinancing risks. The bulk of the issuance was concentrated on the R202 and R212 bonds, accounting for 33.3 per cent and 30.7 per cent of the issuance respectively. The R211 bond was the least-issued, at 3.1 per cent of total inflation-linked bond issuance.
Despite an increase in weekly issuance levels, demand for inflation-linked bonds remained strong, as shown in the real yields and high subscription rates.
Floating-rate notes
The only floating-rate note remaining in the portfolio, the R205, was redeemed on 31 March 2012.
Retail savings bonds
Robust demand supported strong growth in retail savings bonds. A total of R4.6 billion was raised, equating to average monthly investments of R389 million by individual investors.
In total, R16.2 billion has been invested in retail savings bonds since inception in 2004. Over the last two calendar years (2010 and 2011) the average daily investments reached R13 million.
Table 8: Retail savings bonds – payments and receipts, 2011/12 R million
Payments
Early withdrawal 19.9
Deceased estate 55.8
Reimbursed1 0.6
Total payments 76.3
Receipts
New investments 4 631.0
Re-starts2 1.4
Total receipts 4 632.4
Source: National Treasury
1 Refunded deposits of amounts which were below the minimum investment requirement for retail bonds 2 Existing investments that have been terminated and restarted at higher interest rates
Foreign currency bonds
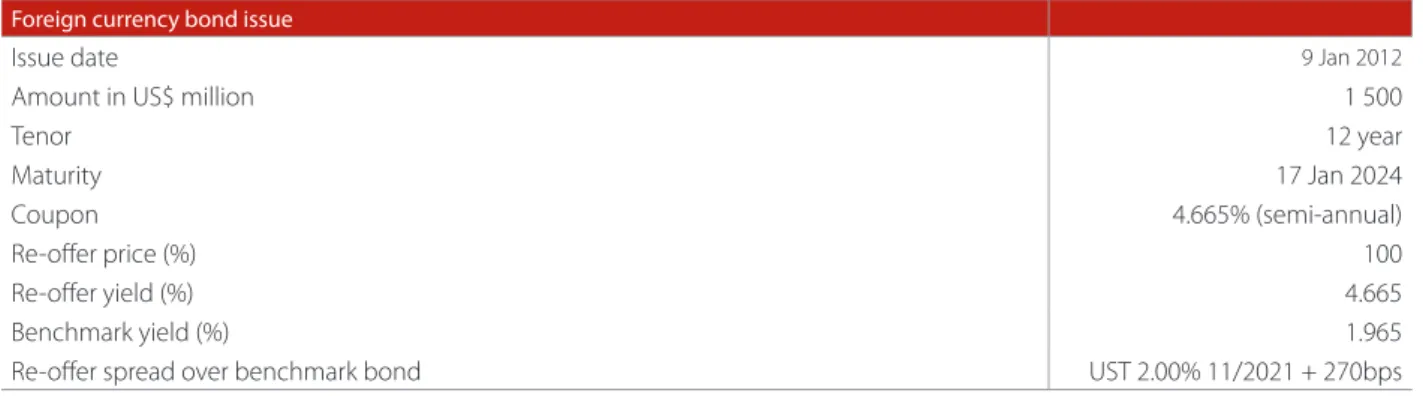
In January 2012, South Africa issued a US$1.5 billion bond with a 12-year maturity, prefunding for the 2012/13 fiscal year.
Table 9: Eurobond issuance, 2011/12 Foreign currency bond issue
Issue date 9 Jan 2012
Amount in US$ million 1 500
Tenor 12 year
Maturity 17 Jan 2024
Coupon 4.665% (semi-annual)
Re-offer price (%) 100
Re-offer yield (%) 4.665
Benchmark yield (%) 1.965
Re-offer spread over benchmark bond UST 2.00% 11/2021 + 270bps
Source: National Treasury
Bond buyback programme
In the 2010 Budget Review, the Minister of Finance announced a switch programme for the R189 (6.25 per cent, 2013) bond and R205 (floating-rate, 2012) note. The programme started in 2010 with the goal of reducing R189 bond redemptions by R45 billion (including revaluations) and R205 floating-rate note redemptions by R8 billion respectively. In 2011/12, R17 billion was switched – R10 billion of the R189 (6.25 per cent, 2013) and R7 billion of the R205. Since 2010, the total amount switched from the R189 bond, including revaluations, is R29 billion.
5. Funding strategy, 2012/13
The government’s funding strategy is informed by variables in the fiscal framework (revenue, expenditure and budget balance) and macroeconomic variables (GDP growth, interest rates, exchange rates and inflation rates).
The gross borrowing requirement is in turn determined by taking into consideration the budget balance, extraordinary receipts and payments, and maturing debt. International and domestic market conditions, risk guidelines, cash management requirements and any other specific policy priorities are also taken into account, with various simulations before a strategy is finalised.
A larger budget deficit of R170 billion is expected in 2012/13 (2011/12: R156.6 billion). Net Treasury bill issuance will be increased by R22 billion, accompanied by significant use of accumulated cash balances. With effect from 30 March 2012, the weekly auction levels of Treasury bills were adjusted to increase issuance in 2012/13 by R22 billion.
Table 10: Weekly Treasury bill auction levels, 2012/13
R million 2011/12 Adjusted, 2012/13 Increase/(decrease) 2012/13
Term Weekly auction levels Net increase
91-day 3 825 3 685 (140) 1 007
182-day 1 380 1 515 135 3 510
273-day 980 1 130 150 5 850
364-day 660 880 220 11 633
Total 6 845 7 210 365 22 000
Source: National Treasury
The government will introduce five new domestic long-term bonds in 2012/13 to create new benchmark bonds and to smooth the maturity profile. The two fixed-rate bonds will have 11-year and 36-year maturities, and the three inflation-linked bonds will have 13-year, 26-year and 39-year maturities. The bond buyback programme on a switch basis for domestic and foreign redeeming bonds will be maintained.
Table 11: Change in cash balances, 2011/12 – 2012/13
2011/12 2012/13
R million Budget 2011 Revised Unaudited Estimates
Rand currency
Opening balance 109 053 111 413 111 413 129 425
Cash utilised for domestic funding -6 896 18 012 19 038 -20 365
Closing balance 102 157 129 425 130 451 109 060
Of which:
Tax and loan accounts 35 000 62 268 63 294 41 903
Sterilisation deposits 67 157 67 157 67 157 67 157
Change in cash balance1
(opening less closing balance) 6 896 -18 012 -19 038 20 365
Foreign currency2
Opening balance 57 241 62 143 62 143 65 287
Domestic foreign exchange purchases 22 285 3 444 3 444 8 352 International borrowing 8 159 13 010 12 595 4 218 Cash utilised for foreign funding -15 448 -13 310 -13 806 -22 948
Closing balance 72 237 65 287 64 376 54 909
US$ equivalent 10 064 8 881 7 624
Change in cash balance1
(opening less closing balance) -14 996 -3 144 -2 233 10 378
Total change in cash balances1 -8 100 -21 156 -21 271 30 743
Total closing cash balance 174 394 194 712 194 827 163 969
Source: National Treasury
1 A negative value indicates an increase in cash balances and a positive value indicates that cash is utilised to finance part of the borrowing requirement 2 Rand values at which foreign currency was purchased or borrowed
6. Debt portfolio, holdings and investor trends
Status of government debt portfolio
Total government debt stood at R1 trillion in April 2011 and increased to about R1.2 trillion at 31 March 2012. A combination of domestic and foreign funding, switch auctions, revaluations of inflation-linked bonds and exchange rate movements contributed to the increase.
Table 12: Government debt portfolio, 31 March 2012
R million % of total
Fixed-rate bonds 668 274 56.20 Inflation-linked bonds 220 973 18.58 Treasury bills 155 159 13.05 Corporation for Public Deposits 13 105 1.10
Floating-rate note 0 0.00
Zero-coupon bonds 984 0.08
Retail savings bonds 12 060 1.01
Other loans 46 0.09
Total domestic debt 1 071 601 90.12
Foreign currency bonds 98 953 8.32 Other foreign currency loans 18 464 1.55
Total foreign currency debt 117 417 9.88
Total government debt 1 188 018 100
Source: National Treasury
Treasury bills make up 13.1 per cent of the debt portfolio. An analysis of the Treasury bill portfolio is shown in Table 13.
Table 13: Treasury bill portfolio, 31 March 2012
Maturity R million Interest rate (%) % of portfolio
91-day 46 909 5.65 30.23
182-day 35 880 5.78 23.12
273-day 38 220 5.89 24.63
364-day 34 150 6.02 22.01
Total 155 159 100.00
Source: National Treasury
The fixed-rate bonds for which primary dealers are obliged to quote constitute 56.2 per cent of total government debt. Adding retail savings bonds to the fixed-rate debt increases the fixed-rate portion to 57.3 per cent. Inflation-linked bonds account for 18.6 per cent and revaluations 6.1 per cent of total government debt. Table 15 shows the composition of domestic fixed-rate and inflation-linked bonds.
Table 14: Domestic currency bond portfolio, 31 March 2012
Bond code R million Coupon (%) Yield (%) All-in-Price Maturity
Fixed-rate bonds
R 206 31 861 7.500 5.770 102.62 15-Jan-14
R 201 39 021 8.750 6.015 106.38 21-Dec-14
R 157 63 260 13.500 6.690 119.68 15-Sep-15
R 203 80 041 8.250 7.265 104.22 15-Sep-17
R 204 76 614 8.000 7.580 102.16 21-Dec-18
R 207 88 630 7.250 7.795 96.91 15-Jan-20
R 208 79 937 6.750 7.860 93.02 31-Mar-21
R 186 97 308 10.500 8.365 117.80 21-Dec-26
R 213 29 507 7.000 8.725 84.18 28-Feb-31
R 209 52 767 6.250 8.825 74.53 31-Mar-36
R 214 26 688 6.500 8.875 75.41 28-Feb-41
Inflation-linked bonds
R 189 25 789 6.250 -0.500 214.19 31-Mar-13
R 211 21 546 2.500 0.690 118.42 31-Jan-17
R 212 25 009 2.750 1.950 116.63 31-Jan-22
R 197 61 204 5.500 1.970 255.32 7-Dec-23
R 210 30 872 2.600 2.270 140.34 31-Mar-28
R 202 56 552 3.450 2.280 189.02 7-Dec-33
Source: National Treasury
The foreign currency bond portfolio is skewed towards US-dollar denominated debt, which makes up 70 per cent of the portfolio. Efforts are under way to diversify in other currencies.
Table 15: Foreign currency bond portfolio, 31 March 2012
Bond code ($,€,¥) million Coupon (%) Yield (%) Price Maturity
US dollar
2012 1 000 7.375 1.079 100.37 25-Apr-12
2014 1 000 6.500 1.441 110.73 2-Jun-14
2017 141 8.500 3.611 123.06 23-Jun-17
2019 2 000 6.875 3.517 121.05 27-May-19
2020 2 000 5.500 3.715 112.16 9-Mar-20
2022 1 000 5.875 4.142 114.25 30-May-22
2024 1 500 4.665 4.359 102.79 17-Jan-24
2041 750 6.250 5.101 117.28 8-Mar-41
Euro
2013 1 250 5.250 1.416 104.21 16-May-13
2016 750 4.500 2.712 106.70 5-Apr-16
Yen
2020 30 000 3.800 4.553 94.94 1-Jun-20
2021 30 000 3.800 4.613 93.87 7-Sep-21
Debt portfolio against risk benchmarks
Risk benchmarks
The government’s risk framework is designed to manage the costs and risks associated with its debt portfolio, establishing prudential limits and operational guidelines for short-, medium- and long-term risk.
One of the major risk concerns is the composition of debt. The strategic benchmark limits domestic debt to 80 per cent of the total debt and foreign currency debt to 20 per cent of the total. Of the domestic debt, 70 per cent is fixed-rate debt (fixed-rate bonds) and 30 per cent is indexed and discount debt (Treasury bills, inflation-linked bonds, floating-rate notes and zero-coupon bonds). The strategic benchmarks and a smooth maturity profile provide a framework for risk tolerance, helping the government to evaluate the trade-off between expected cost and market risk. Annual funding guidelines should not deviate by more than 5 percentage points from 70 per cent fixed-rate debt and 30 per cent indexed and discount debt.
Fixed-rate versus indexed and discount debt: The proportion of fixed-rate debt (including retail bonds) in the portfolio rose marginally to 63.6 per cent in March 2012 from 63.2 per cent a year earlier. Indexed and discount debt decreased to 36.4 per cent in March 2012 from 37.8 per cent in March 2011.
Foreign currency versus domestic debt: Foreign currency debt remained below 10 per cent, apart from a brief period in September 2011, when it increased to 10.27 per cent due to a decline in the exchange value of the rand against major international currencies. At 31 March 2012, foreign currency debt made up 9.88 per cent of total debt – well below the strategic risk guideline of between 20 per cent and 25 per cent. While manageable foreign currency debt could mean that government has enough room to issue in the global markets, exchange rate volatility remains a key risk factor.
Risk indicators of domestic government debt
Table 16: Modified duration and average term-to-maturity, 31 March 2012 Selected risk indicators
Average term-to-maturity (years) excluding T-bills 10.62 Modified duration (years) excluding T-bills 6.83 Average term-to-maturity (years) including T-bills 9.15 Modified duration (years) including T-bills 5.91
Weighted coupon (%) 7.58
Weighted yield (%) 6.52
Source: National Treasury
The average term-to-maturity and modified duration of the domestic benchmark debt portfolio increased marginally to 10.62 years and 6.83 years respectively at 31 March 2012 from 10.30 years and 6.60 years a year earlier. A combination of funding in medium- to long-term bonds, low coupon bonds and the general shape of the yield curve contributed to changes in the risk indicators.
Maturity profile
Over the past 6 years, the government has successfully restructured the debt portfolio through switch auctions. The strategy accords well with the principle of lengthening the maturity profile. The switch auctions of the R189 inflation-linked bond in 2011/12 reduced potential refinancing risk of about R60 billion in 2012/13. The R189 bond is projected to redeem at R26 billion based on macroeconomic projections set out in the 2012 Budget. Although the switch was successful, refinancing risks remain during the 2017/18 – 2021/22 period.
Figure 4: Consolidated maturity profile of government debt, 31 March 2012
Source: National Treasury
Holdings of government securities
Treasury bill holdings
Figure 5 shows the distribution of Treasury bill holdings. The “other” category is made up of smaller domestic and foreign investors. Foreign investors hold 3 per cent of Treasury bills.
Figure 5: Holdings distribution of outstanding Treasury bills, 31 March 2012
Source: National Treasury
Domestic government bond holdings
Non-resident investors have increased their participation in the domestic government bond market, with these holdings more than doubling to 29.2 per cent of the total between 2008 and 2012.
R million
2012/13 2014/15 2016/17 2018/19 2020/21 2022/23 2024/25 2026/27 2028/29 2030/31 2032/33 2034/35 2036/37 2038/39 2040/41
Foreign bonds
Domestic bonds TB’s
200 000 180 000 160 000 140 000 120 000 100 000 80 000 60 000 40 000 20 000 0
Other, 20% Standard Bank, 20%
First Rand Bank, 18%
Investec, 14% HSBC, 7%
ABSA, 9%
Figure 6: Holders of the South African bonds, 31 March 2012
Holders of SA domestic government bonds Domestic and foreign investor trends, 2006-2012
Source: STRATE and National Treasury
Holdings of government bonds by pension funds and other financial institutions have declined by 12 per cent and 15 per cent respectively since 2006, while insurers and monetary institutions increased their holdings by 2 per cent over the same period. Fixed-rate bond holdings by non-residents are spread across all maturities. This indicates a broad investor base – including pension funds, banks and insurers – with a range of risk appetites.
Figure 7: Holdings of South African fixed-rate bonds, 31 March 2012
Source: STRATE and National Treasury
As at March 2012, non-residents increased their purchases of South Africa’s new ultra-long bonds – the R213 (7 per cent, 2031) and the R214 (6.50 per cent, 2041) – bringing their shares to 35 per cent and 22 per cent respectively. Long-term insurers, whose liabilities need to be matched by asset maturity, remained natural buyers of long-term fixed-rate bonds, with 53 per cent of a 30-year R214 (6.50 per cent, 2041) holding.
1 Includes: Collective investment schemes, Finance Companies, Public-sector financial intermediaries 2 Includes: Banks and the South African Reserve Bank
Other financial1 institutions, 8% Monetary2 institutions, 17% Insurers, 12% Foreign sector, 29%
Pension funds, 32% Other, 2% Per c en t Per c en t M ar -06 M ar -07 M ar -08 M ar -09 M ar -10 M ar -11 Sep -06 Sep -07 Sep -08 Sep -09 Sep -10 Sep -11 M ar -12 100 95 90 85 80 75 70 65 60 35 30 25 20 15 10 5
Local investors Foreign investors (right axis)
100% 80% 60% 40% 20% 0% R206 (7.50%, 2014) R201 (7.50%, 2014) R207 (7.25%, 2020) R213 (7.00%, 2031) R157 (13.50, 2015) R208 (6.75%, 2021) R209 (6.25%, 20236) R204 (8.00%, 2018) R186 (10.50%, 2026) R214 (6.50%, 2041) Foreign sector Monetary institutions Long-term insurers Short-term insurers Private self-administered funds Pension funds Other financial institutions Other
Figure 8: Holdings of South African inflation-linked bonds, 31 March 2012
Source: STRATE and National Treasury
Domestic pension funds and monetary institutions dominate inflation-linked bond holdings, with a combined share of 55 per cent. Pension funds hold inflation-linked bonds to protect assets against rising inflation, while banks hold these instruments to replicate their inflation-linked liabilities.
Investor trends
Retail savings bonds
The number of retail savings bondholders has grown from 37 259 in March 2011 to 44 163 at 31 March 2012. Of these investors, 54 per cent are women and 46 per cent are men. The number of investments grew from 54 070 on 1 April 2011 to 88 000 on 31 March 2012. As Figure 9 shows, these bonds are extremely popular among investors aged 50 years and older. The government is working to make retail savings bonds even more accessible and attractive to the South African public, with a focus on specific target markets.
Figure 9: Age distribution of investor base, 31 March 2012
Source: National Treasury
100% 80% 60% 40% 20% 0% R189 (6.25%, 2013) R211 (2.50%, 2017) R212 (2.75%, 2022) R197 (5.50%, 2023) R210 (2.60%, 2028) R202 (3.45%, 2033) Foreign sector Monetary institutions Long-term insurers Short-term insurers Private self-administered funds Pension funds Other financial institutions Other
6,000 5,000 4,000 3,000 2,000 1,000 0 R million Age
<20 20-29 30-39 40-49 50-59 60-69 >70
Foreign currency-denominated bonds
Foreign currency-denominated bonds are well distributed geographically, with a greater participation of real money/asset managers depicted in Figure 10 below.
Figure 10: Investor distribution for South Africa’s US$1.5 billion 12-year bond
Source: Barclays/ABSA capital
Guarantees
State-owned companies invest in infrastructure that contributes to South Africa’s long-term economic growth and its broader developmental goals. To fund the infrastructure programmes, these entities borrow money against their balance sheets. The government continues to support their efforts to increase the investor base and diversify funding sources.
From time to time, the government may decide to help state-owned companies access cost-effective funding by providing them with a guarantee. A guarantee is a government obligation that will result in expenditure on the occurrence of a specific event, such as the inability of a borrowing entity to service its debt. The National Treasury carefully monitors guarantees and their potential impact on the fiscus. Credit risk analysis of state-owned companies and development finance institutions that have received guarantees is conducted regularly to determine the government’s contingent liability exposure. This risk analysis is also taken into account when evaluating applications for new guarantees by the National Treasury’s fiscal liability committee.
In summary, the process for guarantee requests and approvals is as follows:
• The Cabinet Minister responsible for the entity submits a request to the Minister of Finance for concurrence with the issuance of a guarantee.
• The fiscal liability committee assesses the request on the basis of the guidelines set out above and submits a recommendation to the Minister of Finance.
• After considering the fiscal liability committee’s recommendation, the Minister of Finance decides whether a guarantee will be granted.
1% 5% 8%
9%
76% 49%
2% 20%
29%
US UK Europe Asia Asset manager Bank Insurance/Pension Hedge fund Other
Overview of new and existing guarantees
Table 17 shows the guarantees held by major public entities. No new guarantees were issued during 2011/12.
Table 17: Guarantees held by major state-owned companies and development finance institutions, 2011/12 Institution
R billion Guarantee Exposure/Utilised
Total 470.2 170.1
Of which:
Eskom 350.0 86.1
South African National Roads Agency Limited 40.0 23.8
Development Bank of Southern Africa 28.3 25.9
Trans-Caledon Tunnel Authority 25.4 18.5
Transnet 9.5 6.9
Land Bank 3.8 1.1
7. Cash management
Cash management plays a central role in managing liquidity and debt, and supports effective collaboration between the National Treasury and the Reserve Bank in managing money market liquidity. Cash and debt management are integrated into government’s asset and liability operations.
The forecasting of expenditure and non-tax revenue by government departments, tax revenue projections provided by the South African Revenue Service, and debt-service and redemptions cash estimates are used to project the gross borrowing requirement. This information provides the basis to establish funding limits as part of the debt management strategy. Government makes both short- and long-term forecasts. Forecasts are made for three-year periods each month, and three-month forecasts are made daily. Cash management operations include the investment of cash balances. The government’s total cash includes deposits held by the Reserve Bank and commercial banks. Cash deposits with the Reserve Bank include:
• Deposits used to “sterilise” excess cash created in the money market when buying foreign exchange reserves. While these sterilisation deposits are not readily available to finance expenditure, they are available for short-term cash management purposes, subject to agreement with the Reserve Bank.
• Foreign exchange deposits made from money borrowed in global markets or from purchases in the domestic market can be used to meet foreign exchange commitments.
• Investments with the CPD.
Operational cash to meet government’s commitments in rand is invested with commercial banks. Total cash balances at 31 March 2012 are shown in Table 18.
Table 18: National government cash balances, 31 March 2012
R billion
South African Reserve Bank 131.6
Sterilisation deposits 67.2
Foreign currency deposits 64.4
US$ equivalent 8.8
Commercial banks 63.3
Tax and loan accounts 63.3
Foreign currency deposits 0.05
US$ equivalent1 0.06
Total 194.8
Of which:
Rand 130.5
Foreign currency 64.4
Source: National Treasury