TTTTA B L E O F A B L E O F A B L E O F A B L E O F CCCCO N T E N T SO N T E N T SO N T E N T SO N T E N T S TA B L E O F CO N T E N T S
Table of Contents
The Basics of PCR and RT-PCR . . . 2
The Basics of PCR . . . 2
The Basics of RT-PCR . . . 2
Increasing RT-PCR Sensitivity . . . 3
Isolating High-Quality RNA . . . 3
Using RNase H–Reverse Transcriptases . . . 4
Higher RT Incubation Temperatures . . . 5
Additives to Enhance RT . . . 5
RNase H Treatment . . . 5
Improving Detection of Small Amounts of RNA . . . 6
One-Step vs. Two-Step RT-PCR . . . 6
Improving RT-PCR Specificity . . . 7
Priming cDNA Synthesis . . . 7
Higher RT Incubation Temperatures . . . 7
Minimizing Contaminating Genomic DNA . . . 7
RT-PCR Applications . . . 8
5´ and 3´ RACE . . . 8
Quantifying mRNA Expression . . . 8
Improving PCR Specificity . . . 10
Primer Design . . . 10
Primer Annealing Temperature . . . 10
Touchdown PCR . . . 11
Primer Concentration . . . 11
Primer Purity and Stability . . . 11
Hot Start . . . 12
Magnesium Concentration . . . 13
Additives to Enhance PCR . . . 13
Nested PCR . . . 13
Increasing PCR Sensitivity . . . 14
Template Quality . . . 14
Template Concentration . . . 14
Enzyme Choice . . . 14
Improving Fidelity . . . 15
Enzymes with Proofreading . . . 15
Enzyme Mixes . . . 15
Other Parameters . . . 15
Other Things to Consider . . . 16
Amplifying Long Targets . . . 16
Prevention of Carry-Over Contamination . . . 16
Purification of PCR Products . . . 16
PCR Applications . . . 17
Multiplex PCR . . . 17
Genotyping with Dinucleotide Repeat Markers . . . 17
Tools for Detecting Polymorphisms . . . 17
Troubleshooting Guide . . . 18
References . . . 20
Related Products . . . 22
Selected Primer Sequences . . . 28
CHAPTER 1
CHAPTER 2
CHAPTER 3
CHAPTER 4
CHAPTER 5
CHAPTER 6
CHAPTER 7
CHAPTER 8
CHAPTER 9
CHAPTER 10 CHAPTER 11 CHAPTER 12 APPENDIX A
N6 N6 N6 N6 N6
N6 N6 N6 N6 N6 The Basics of PCR
T
he Polymerase Chain Reaction (PCR)process uses multiple cycles of tem-plate denaturation, primer annealing, and primer elongation to amplify DNA
sequences(1). It is an exponential process
since amplified products from the previous cycle serve as templates for the next cycle of
amplification, making it a highly sensitive technique for the detection of nucleic acids. Typically, enough amplified product is generated after 20 to 30 cycles of PCR so that it can be visualized on an ethidium bromide-stained gel. The reaction is composed
of several components(table 1). The template
can include purified genomic or plasmid DNA; RNA converted to cDNA; or unpuri-fied, crude biological samples such as bacte-rial colonies or phage plaques. The primers determine the sequence and the length of the amplified product. The most frequently used thermostable polymerase is Taq DNA polymerase. This enzyme is appropriate for routine amplifications, but the use of other thermostable polymerases can enhance results. Amplification reactions also contain buffer, deoxynucleotide triphosphates, and magne-sium. The magnesium ion concentration affects enzyme activity, primer annealing, melting temperature of the template and the PCR product, fidelity, and primer-dimer
formation(2). How the interaction of these
components, cycling parameters, as well as other factors contribute to successful PCR will be discussed in the following chapters.
The Basics of RT-PCR
RT-PCR combines cDNA synthesis from
RNA templates with PCR(figure 1)to provide
a rapid, sensitive method for analyzing gene expression. RT-PCR is used to detect or quantify the expression of messages, often
from small amounts of RNA(3,4). In addition,
the technique is used to analyze differential gene expression or clone cDNAs without
constructing a cDNA library(5,6). RT-PCR is
more sensitive and easier to perform than other RNA analysis techniques, including Northern blots, RNase protection assays,
in situ hybridization, and S1 nuclease assays
(7,8).
The template for RT-PCR can be total
RNA or poly(A)+selected RNA. RT
reac-tions can be primed with random primers, oligo(dT), or a gene-specific primer (GSP) using a reverse transcriptase. RT-PCR can be carried out either in two-step or one-step
formats. In two-step RT-PCR, each step is performed under optimal conditions. cDNA synthesis is performed first in RT buffer and one tenth of the reaction is removed for PCR. In one-step RT-PCR, reverse tran-scription and PCR take place sequentially in a single tube under conditions optimized for both RT and PCR.
This Guide describes the keys to suc-cessful RT-PCR and PCR. High sensitivity (getting enough product from small samples) and high specificity (selective amplification of only the desired product) are the hallmarks of successful PCR. Optimal RT-PCR and PCR can be obtained through careful exper-imental design, including selecting the appro-priate enzymes, designing optimal primers, using different buffers and additives, estab-lishing cycling parameters, and preparing high quality templates.
2 T H E B A S I C S O F P C R A N D R T - P C R
CH A P T E R 1 CH A P T E R 1 CCH A P T E R H A P T E R 11
CH A P T E R 1
The Basics of PCR and RT-PCR
FIGURE 1. RT-PCR overview.
Cells or Tissue
AAAAAAA(A)n
AAAAAAA(A)n
AAAAAAA(A)n AAAAAAA(A)n
AAAAAAA(A)n
AAAAAAA(A)n TTTTTTTT
AAAAAAA(A)n TTTTTTTT AAAAAAA(A)n TTTTTTTT
AAAAAAA(A)n
random hexamer priming oligo(dT) priming
RNA Isolation
cDNA Synthesis
PCR Amplification gene specific priming
AAAAAAA(A)n
AAAAAAA(A)n
AAAAAAA(A)n
GSP
Table 1
Component Final Concentration
Template 104–106copies of DNA template
Primer 1 0.1– 0.5 µM
Primer 2 0.1– 0.5 µM
10X Reaction buffer 1X Magnesium 1.0 –3.0 mM dNTP mix 200 µM each dNTP Thermostable DNA polymerase 1– 4 units/100 µl reaction
Isolating High-Quality RNA
S
uccessful cDNA synthesis starts withhigh-quality RNA. High-quality RNA is substantially full length, and does not contain inhibitors of reverse
transcrip-tases such as EDTA or SDS(9). The quality
of the RNA dictates the maximum amount of sequence information that can be converted into cDNA. One popular RNA isolation protocol is the single-step method which uses guanidine isothiocyanate/acidic phenol
(10). The TRIZOL®Reagent method(see figure
below) is an improvement on this single-step method and can be used to isolate high qual-ity, undegraded RNA from various cells and
tissues(11,12). The TRIZOLReagent method
can be used to isolate RNA from as little as
100 cells or 1 mg of tissue(13).
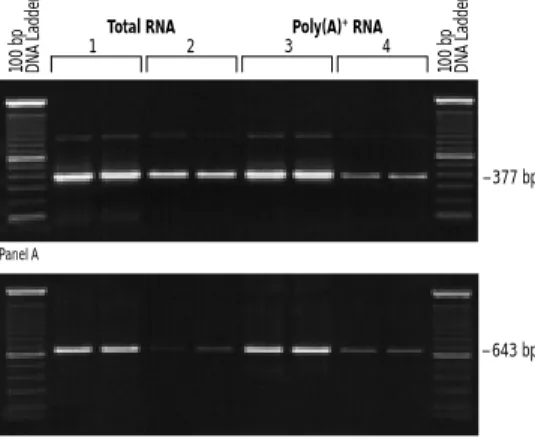
Oligo(dT) selection for poly(A)+RNA
is typically not necessary. Amplified product is detectable when either total RNA or
poly(A)+RNA is used as the starting
tem-plate(figure 2) (14). In addition, isolating
poly(A)+RNA may lead to variability of
mRNA enrichment between samples, which can bias the detection or quantification
of message. However, poly(A)+RNA may
increase the sensitivity of detection when analyzing rare messages.
RNA isolated from RNase-rich samples, such as the pancreas, may need to be stored in formamide to maintain high quality RNA, due to the carry-over of trace amounts of
RNase(15). This is especially true for long
term storage. RNA isolated from rat pancreas and stored in water showed substantial degra-dation after just 1 week, whereas RNA isolated from rat liver, which contains lower amounts of RNases, was stable in water for 3 years
(15). In addition, transcripts > 4 kb are more
susceptible to degradation by trace amounts
of RNases than shorter transcripts(16). To
increase the stability of stored RNA samples, dissolve the RNA in deionized formamide and store at –70°C. The formamide used for storage of RNA must not contain impurities
that cause RNA degradation(16). RNA from
pancreas was stable for at least 1 year in form-amide. When ready to use the RNA, simply precipitate it by adding NaCl to 0.2 M followed by 4 volumes of ethanol. Incubate 3 to 5 min at room temperature and centrifuge
at 10,000×g for 5 min.
RNase inhibitors are often added to RT reactions to help improve cDNA length and yield. Add RNase inhibitors to the first-strand reaction in the presence of buffer and a reducing agent, such as DTT, since procedures prior to cDNA synthesis that denature the inhibitor will release bound RNases that can degrade RNA. Protein RNase inhibitors protect RNA against degradation by RNases A, B, and C, but do not protect against RNases found on the skin. Thus, even when using these inhibitors be careful not to introduce RNases from your fingertips.
Outline of Procedure for TRIzOL®Reagent
CH A P T E R 2 CCCH A P T E R H A P T E R H A P T E R 222
C H A P T E R 2
I N C R E A S I N G R T - P C R S E N S I T I V I T Y 3
Increasing RT-PCR Sensitivity
FIGURE 2. Comparison of total RNA and poly(A)+RNA in RT-PCR. cDNA was synthesized in duplicate from 5 or 1 µg total HeLa RNA (lanes 1 and 2, respectively) or from 500 ng or 50 ng of poly(A)+
HeLa RNA (lanes 3 and 4, respectively) with oligo(dT) primers and SUPERSCRIPT™II RT. The amplified targets were a 377-bp fragment near the 5´ end of the DNA polymerase εmRNA and a 643-bp frag-ment of the replication protein A mRNA, which are both moderately abundant targets. One tenth of the cDNA reaction was amplified for 30 cycles usingTaqDNA polymerase.
–377 bp
–643 bp
100 bp DNA Ladder 100 bp DNA Ladder
Total RNA Poly(A)+RNA
1 2 3 4
Panel A
Panel B
TRI
ZOLReagent can isolate high-quality RNA from
as little as 100 cells or 1 mg of tissue.
Elapsed Time <1 h
Homogenize sample in TRIZOLReagent
Separate Phases (add chloroform)
Precipitate RNA
Using RNase H–Reverse Transcriptases
Reverse transcriptases catalyze the conversion of RNA to cDNA. Both moloney murine leukemia virus (M-MLV) and avian myleo-blastosis virus (AMV) reverse transcriptases have endogenous RNase H activity in addi-tion to their polymerase activity. The RNase H activity competes with the polymerase activity for the hybrid formed between the RNA tem-plate and the DNA primer or growing cDNA strand and degrades the RNA strand of the
RNA:DNA complex (see figure). RNA
tem-plate that is cleaved by RNase H activity is no longer an effective substrate for cDNA synthesis, decreasing both the amount and size of the cDNA. Therefore, it is advanta-geous to eliminate or greatly reduce the RNase H activity of reverse transcriptases.
SUPERSCRIPT™II RT, an M-MLV RNase
H–RT, and T
HERMOSCRIPT™RT, an avian
RNase H–reverse transcriptase, yield greater
amounts of cDNA and more full-length cDNA than M-MLV RT and AMV RT,
respectively(figure 3) (17–19). RT-PCR
sensi-tivity can be limited by the amount of cDNA
synthesized. THERMOSCRIPTRT has
signi-ficantly greater sensitivity than AMV RT (figure 4) (18). The size of RT-PCR products is limited by the ability of a reverse tran-scriptase to synthesize full-length cDNA, especially when cloning large cDNAs. SUPERSCRIPTII RT significantly increased the yield of long RT-PCR products
com-pared to M-MLV RT(figure 5) (20). RNase
H–reverse transcriptases also have increased
thermostability, so reac-tions can be performed above the normal incuba-tion temperature of 37°C to 42°C.
10 10 1,000
THERMOSCRIPTRT
10 100 1,000
AMV RT
FIGURE 4. Effect of RT on sensitivity of RT-PCR.cDNA was synthe-sized from total HeLa RNA at 50°C with oligo(dT) primers using THERMOSCRIPT™RT or AMV RT. PCR was 35 cycles with P
LATINUM®Taq DNA Polymerase and primers for human DNA polymerase ε.
1 Kb P
LUS
DNA Ladder
™
Figure 3
FIGURE 3. Effect of RT on yield of first-strand cDNA.cDNA was synthesized from 2.5 µg (for THERMOSCRIPT™RT and AMV) or 1 µg (for SUPERSCRIPT™II RT and M-MLV) of a 7.5-kb mRNA using oligo(dT) primer and 10 µCi of [α-32P]dCTP with the recommended synthesis conditions. Total
yield of first-strand ( ) was calculated from TCA precipitation. Full-length cDNA ( ) was assayed by cutting and counting size-fractionated bands from alkaline agarose gels.
cDNA Synthesized (ng)
900 800 700 600 500 400 300 200 100 0
THERMOSCRIPTRT M-MLV RT
AMV RT SUPERSCRIPTII RT
Effect of RNase H on first-strand cDNA.RNase H degrades RNA in an RNA:DNA complex during cDNA synthesis. Red arrows represent potential cleavage sites.
Obstacles Posed by RNase H
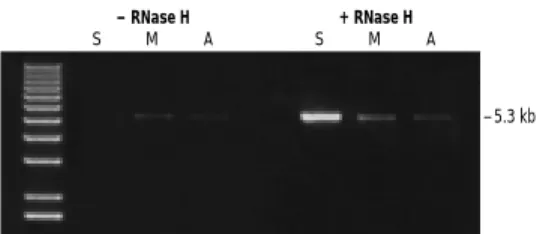
FIGURE 5. Effect of RT on sensitivity in long RT-PCR.The synthesis of full-length cDNA for human tuberous sclerosis II mRNA (5.3 kb) and human DNA polymerase εmRNA (6.8 kb) was catalyzed by SUPERSCRIPT™II RT (lane S) or M-MLV RT (lane M). cDNA was synthe-sized from 5 µg total HeLa RNA with oligo(dT) primers. Samples were treated with RNase H and one tenth of the cDNA reaction was amplified with ELONGASE®Enzyme Mix for 35 cycles.
S M S M
kb
– 6.8 – 5.3 RNA (ng)
– 3.5 kb
4 I N C R E A S I N G R T - P C R S E N S I T I V I T Y
Increasing RT-PCR Sensitivity
(continued)
CCCCH A P T E R H A P T E R H A P T E R H A P T E R 2222
CH A P T E R 2
T T T T T T T T
AAAAAAAA T T T T T T T TAAAAAAAA
T T T T T T T T
AAAAAAAA
AAAA
TTTTTTTT
Higher RT Incubation Temperatures
Higher RT incubation temperatures(table 2)
can help disrupt RNA secondary structure
and increase the yield of product(18). For
many RNA templates, incubating the RNA and primer at 65°C in the absence of buffers or salts and quickly chilling on ice eliminates most secondary structure and allows primer binding. However, secondary structure may still exist in some templates even after heat denaturation. The amplification of products from these difficult templates can be
improved by using THERMOSCRIPTRT and
performing the RT reactions at higher
tem-perature(figure 6) (18). Higher temperatures
can also improve specificity, especially when using a gene-specific primer (GSP) for cDNA
synthesis(see page 7). If using a GSP, make
sure the Tmof the primer is as high as the
planned incubation temperature. Do not use oligo(dT) and random primers above 60°C; random primers require an initial 10 min incubation at 25°C before increasing the temperature to 60°C. In addition to using
elevated RT temperatures, increase specificity by shifting the RNA/primer mix directly from the 65°C denaturation temperature to the RT incubation temperature and add pre-warmed 2X reaction mix (cDNA synthesis hot start). This helps prevent intramolecular base pairing that can occur at lower temper-atures. Using a thermal cycler can simplify the multiple temperature shifts required for RT-PCR.
Tth thermostable
poly-merase, which functions as a DNA polymerase in the
pres-ence of Mg++and a reverse
transcriptase in the presence
of Mn++, can also be
incu-bated up to 65°C. However,
the presence of Mn++
during PCR reduces fidelity. This makes Tth polymerase less suitable for applications that require highly accurate amplification, such as cloning cDNAs. In addition, Tth polymerase is a less efficient reverse transcriptase, which reduces sensitivity and, since a single enzyme is used for both reverse transcription and PCR, a control reaction without RT cannot be used to distinguish amplified cDNA from amplified contami-nating genomic DNA.
Additives to Enhance RT
Additives including glycerol and DMSO can be added to first-strand synthesis reactions to help destabilize nucleic acid duplexes and melt RNA secondary structure. Up to 20% glycerol or up to 10% DMSO can be used
without effecting SUPERSCRIPT II RT or
M-MLV RT activity(9). AMV RT will also
tolerate up to 20% glycerol without loss of activity. For maximum RT-PCR sensitivity in SUPERSCRIPTII RT reactions, add 10% glycerol and incubate at 45°C. If one tenth of the RT reaction is added to the PCR, the final concentration of glycerol in the amplification reaction is 0.4%, which will not inhibit PCR.
RNase H Treatment
Treating cDNA reactions with RNase H prior to PCR can improve sensitivity. For some targets, it is thought that the RNA in the cDNA reaction may prevent binding of the amplification primers. In these cases, RNase H treatment can improve sensitivity. RNase H treatment is often necessary when ampli-fying longer, full-length cDNA targets, such
as the low copy target tuberous sclerosis II (figure 7) (20). For this difficult target, RNase H treatment improved the signal from cDNA
generated with either SUPERSCRIPTII RT or
M-MLV RT. For many RT-PCR applications, RNase H treatment is optional since incu-bation at 95°C for the PCR denaturation step often hydrolyzes the RNA in the RNA:cDNA complex.
CH A P T E R 2 CH A P T E R 2 CCH A P T E R H A P T E R 22
CH A P T E R 2
Table 2
Reverse Transcriptase Incubation Temperature
AMV 37°C–45°C M-MLV 37°C
SUPERSCRIPT™II RT 37°C–50°C
THERMOSCRIPT™RT 42°C–65°C*
*RNA begins to hydrolyze at temperatures above 65°C. For targets ≤1 kb, 70°C first-stand synthesis temperatures can be used. For targets >1 kb, use first-strand synthesis temperatures ≤65°C.
TABLE 2. RT incubation temperatures.
FIGURE 7. Effect of RNase H treatment on RT-PCR.The synthesis of full-length cDNA for human tuberous sclerosis II mRNA (5.3 kb) from 5 µg of total HeLa RNA was catalyzed by SUPERSCRIPT™II RT (S), M-MLV RT (M), or AMV RT (A). One half of the reaction was treated with RNase H for 30 min. An amount of the treated or untreated RT reaction equivalent to 0.5% of the starting RNA was amplified for 35 cycles with ELONGASE®Enzyme Mix.
– 5.3 kb
S M A
+ RNase H
S M A
– RNase H
1 Kb PLUS
DNA Ladder™
50°C 55°C 60°C 50°C 55°C 60°C
THERMOSCRIPTRT AMV RT
FIGURE 6. Effect of temperature on a difficult template.cDNA was synthesized at the indi-cated temperatures from 10 ng of soybean total RNA with THERMOSCRIPT™RT or AMV RT and a gene-specific primer for 18S rRNA. 40 cycles of PCR was performed with one tenth of the cDNA reaction and PLATINUM®TaqDNA Polymerase High Fidelity.
1.5 kb –
Improving Detection of Small Amounts of RNA
RT-PCR is particularly challenging when only small amounts of RNA are available. The addition of glycogen as a carrier during RNA isolation helps improve the yield from small
samples(13). RNase-free glycogen is added at
the same time TRIZOL Reagent is added.
Glycogen is water soluble and remains in the aqueous layer with the RNA to aid subsequent precipitation. The recommended
concen-tration of RNase-free glycogen is 250 µg/ml for <50 mg of tissue or <106cultured cells.
The addition of acetylated BSA(figure 8) to
RT reactions performed with SUPERSCRIPTII
RT can increase sensitivity(21). Also, for small
amounts of RNA, reducing the amount of SUPERSCRIPT II RT and adding 40 units
of RNASEOUT™Ribonuclease Inhibitor can
enhance the level of detection. If glycogen is
used during the RNA isolation, the addition of
BSA or RNase inhibitor to SUPERSCRIPTII RT
reactions is still recommended.
One-Step vs. Two-Step RT-PCR
Two-step RT-PCR is popular and useful for detecting multiple messages from a single RNA sample. However, a one-step RT-PCR
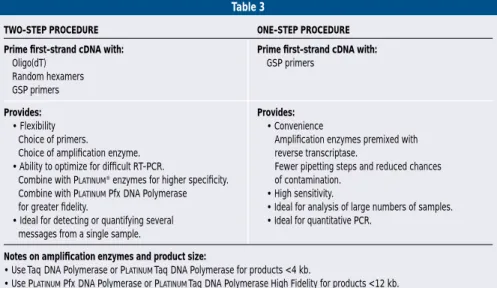
method offers other benefits(table 3) (22).
One-step RT-PCR is easier to use when pro-cessing large numbers of samples, and helps minimize carry-over contamination since tubes do not need to be opened between cDNA synthesis and amplification. Since the entire cDNA sample is amplified, one-step RT-PCR can provide greater sensitivity,
down to 0.1 pg total RNA(figure 9) (22). For
successful one-step RT-PCR, use an antisense gene-specific primer (GSP) to prime cDNA synthesis.
6 I N C R E A S I N G R T - P C R S E N S I T I V I T Y
Increasing RT-PCR Sensitivity
(continued)
1 2 3 4 5 6 7
1 2 3 4 5 6 7
A B
FIGURE 8. Effect of BSA on RT-PCR sensitivity.50 pg, 5 pg, 500 fg, 50 fg, 5 fg, and 0.5 fg (lanes 1 to 6, respectively) of CAT mRNA transcript were reverse transcribed without (Panel A) or with (Panel B) 0.5 µg of acetylated BSA using SUPERSCRIPT™II RT. The “no-RT” control contained 50 pg of CAT transcript (lane 7). 30 cycles of PCR was performed withTaqDNA polymerase.
Table 3
TWO-STEP PROCEDURE ONE-STEP PROCEDURE
Prime first-strand cDNA with: Prime first-strand cDNA with:
Oligo(dT) GSP primers
Random hexamers GSP primers
Provides: Provides:
• Flexibility • Convenience
Choice of primers. Amplification enzymes premixed with Choice of amplification enzyme. reverse transcriptase.
• Ability to optimize for difficult RT-PCR. Fewer pipetting steps and reduced chances Combine with PLATINUM®enzymes for higher specificity. of contamination.
Combine with PLATINUMPfxDNA Polymerase • High sensitivity.
for greater fidelity. • Ideal for analysis of large numbers of samples. • Ideal for detecting or quantifying several • Ideal for quantitative PCR.
messages from a single sample.
Notes on amplification enzymes and product size:
• UseTaqDNA Polymerase or PLATINUMTaqDNA Polymerase for products <4 kb.
• Use PLATINUMPfxDNA Polymerase or PLATINUMTaqDNA Polymerase High Fidelity for products <12 kb. • Use ELONGASE®Enzyme Mix for products >12 kb.
• For one-step RT-PCR, useTaqDNA Polymerase or PLATINUMTaqDNA Polymerase for products <3.5 kb; and use PLATINUMTaq
DNA Polymerase High Fidelity for products <9 kb.
TABLE 3. Comparison of two-step and one-step RT-PCR.
100 bp DNA Ladder
1 2 3 4 5 6
–353 bp
FIGURE 9. Sensitivity of one-step RT-PCR. A β-actin fragment
was amplified from 0, 0.1, 1, 10, 102, and 103pg of total HeLa RNA
(lanes 1 to 6, respectively) using the SUPERSCRIPT™One-Step RT-PCR System. Reactions were incubated at 50°C for 30 min; 94°C for 2 min; then 40 cycles of 94°C for 15 s and 55°C for 30 s and 68°C for 90 s; followed by 68°C for 5 min. Reactions contained 200 nM of sense and antisense primer.
CCCCH A P T E R H A P T E R H A P T E R H A P T E R 2222
CH A P T E R 2
Priming cDNA Synthesis
F
irst-strand cDNA synthesis reactionsmay be primed using three different methods. The relative specificity of each method influences the amount and the variety of the cDNA synthesized.
Random primers are the least specific of the three methods. The primers anneal to multiple sites along the entire transcript to generate short, partial-length cDNAs. This method is often used to capture 5´ end sequences and make cDNA from RNA templates with regions of secondary structure or pause sites that reverse transcriptases
can-not copy(2,3). To maximize the size of the
cDNA, the ratio of primers to RNA may need to be determined empirically for each RNA preparation. The starting concentration range is 50 to 250 ng of random primers per 20 µl reaction. Since the majority of the cDNA synthesized from total RNA with random
primers is ribosomal, poly(A)+selected RNA
is often used as the template.
Oligo(dT) priming is more specific than random primers. It hybridizes to the poly(A) tails found at the 3´ ends of most eukaryotic
mRNAs(23). Since poly(A)+RNA constitutes
approximately 1% to 2% of a total RNA pop-ulation, the amount and complexity of cDNA is considerably less than when random primers are used. Because of its higher speci-ficity, oligo(dT) priming generally does not require optimization of the primer-to-RNA
ratio or poly(A)+selection. The use of 0.5 µg
of oligo(dT) primer per 20 µl reaction is
recommended. Oligo(dT)12-18is suitable for
many RT-PCR applications. Oligo(dT)20is
provided with the THERMOSCRIPTRT-PCR
System, since it has greater thermostability for use at higher RT incubation temperatures. A gene-specific primer (GSP) is the most specific primer for the RT step. GSPs are antisense oligonucleotides that hybridize to
specific RNA target sequences, instead of annealing to entire RNA populations as with random primers or oligo(dT). The same rules for designing PCR primers are applied to the design of the GSP for the RT reaction
(see chapter 5). A GSP can be the same
sequence as the amplification primer which anneals closest to the 3´ end of the message; or a GSP can be designed to anneal down-stream of the reverse amplification primer. Some targets require the design of more than one antisense GSP for successful RT-PCR, since secondary structure of the RNA target may prevent primer binding. The use of 1 pmole antisense GSP in a 20-µl first-strand reaction is recommended.
Higher RT Incubation Temperatures
To take full advantage of the specificity provided by GSPs, use an RT with greater thermostability. Thermostable RTs can be incubated at higher temperatures to increase
reaction stringency(17,18). For example, if a
GSP has an annealing temperature of 55°C, the specificity conferred by the GSP is not fully utilized if the RT reaction is performed with AMV RT or M-MLV RT under low
stringency at 37°C. However, SUPERSCRIPT
II RT and THERMOSCRIPT RT allow for
reaction temperatures of 50°C and greater (table 2, page 5), which can eliminate the nonspecific products generated at lower
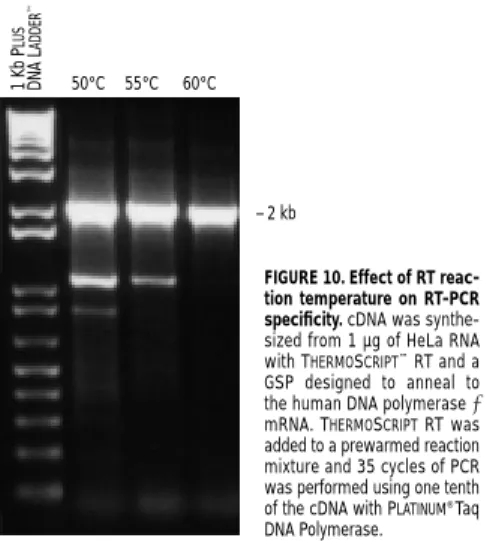
temperatures(figure 10). When maximizing
specificity, add the RNA/primer mix directly from the 65°C denaturation temperature to the RT incubation temperature and add pre-warmed 2X reaction mix (cDNA synthesis hot start). This helps prevent intramolecular base pairing that can occur at lower temper-atures. Using a thermal cycler can simplify the multiple temperature shifts required for RT-PCR.
Minimizing Contaminating Genomic DNA
One potential difficulty encountered with RT-PCR is genomic DNA contamination of RNA. Using a good RNA isolation
tech-nique, such as TRIZOLReagent, minimizes
the amount of contaminating genomic DNA in the RNA preparation. To avoid generating products from genomic DNA, remove the contaminating DNA by treating RNA with DNase I, Amplification Grade before reverse transcription. To terminate the DNase I digestion, incubate the sample at 65°C for 10 min in the presence of 2.0 mM EDTA. The EDTA chelates the magnesium and prevents magnesium dependent hydrol-ysis of the RNA that can occur at higher temperatures.
To distinguish amplified cDNA from amplified contaminating genomic DNA, design primers that anneal in separate exons. The PCR products derived from cDNA will be shorter than products ampli-fied from contaminating genomic DNA. In addition, perform a control experiment with-out RT for each RNA template to determine whether a given fragment is of genomic DNA or cDNA origin. Products generated in the absence of RT are of genomic origin.
I M P R O V I N G R T - P C R S P E C I F I C I T Y 7
Improving RT-PCR Specificity
CH A P T E R 3 CH A P T E R 3 CCH A P T E R 3H A P T E R 3 CH A P T E R 3
50°C 55°C 60°C
1 Kb P
LUS
DNA L
ADDER
™
– 2 kb
FIGURE 10. Effect of RT reac-tion temperature on RT-PCR specificity.cDNA was synthe-sized from 1 µg of HeLa RNA with THERMOSCRIPT™RT and a GSP designed to anneal to the human DNA polymerase ε mRNA. THERMOSCRIPTRT was added to a prewarmed reaction mixture and 35 cycles of PCR was performed using one tenth of the cDNA with PLATINUM®Taq DNA Polymerase.
5´ and 3´ RACE
R
apid amplification of cDNA Ends(RACE) is a procedure to capture unknown sequences at either the 5´ or 3´ end of a transcript. Unlike conventional RT-PCR, which employs two specific primers, RACE uses one sequence-specific primer and either the poly(A) tail of mRNAs (3´ RACE) or a homopolymeric tail
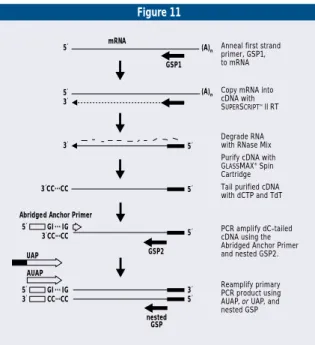
added to cDNA ends (5´ RACE)(figure 11).
RACE has been used for the amplification
and cloning of rare mRNAs(23-25). RACE
products can be cloned, directly sequenced, used to prepare probes, or combined to
gener-ate full-length cDNA(25-27). One method for
joining 5´ and 3´ RACE products is to use the sequence information generated by 5´ and 3´ RACE to design new primers which
will amplify the entire cDNA sequence(26).
The use of RNase H–RT and high-fidelity
thermostable polymerases allows higher fidelity amplifications of longer sequences to generate full-length cDNA clones.
5´ RACE is more challenging and less specific than RT-PCR applications, since only
one of the amplification primers is gene-specific. 5´ RACE products may be a single product, multiple products, or even a smear
with no distinguishable products(figure 12)
(28). The quality of the result depends on the
specificity of the GSPs used in first-strand synthesis and amplification, the specificity of the anchor primer during amplification, the complexity and abundance of the target, and the length of the product. Amplification with nested primers (up to three rounds of nested amplification) and using size-selected ampli-fied product as the target in successive rounds of amplification increases the specificity of 5´ RACE (see nested PCR discussion on page 13). Increasing the RT incubation temperature and PCR annealing temperature, as well as de-creasing the magnesium concentration in the amplification reaction, can enhance specificity.
5´ RACE sensitivity is affected by the RT used and secondary structure at the 3´-end of the cDNA that may inhibit cDNA tailing. Incomplete cDNA synthesis lowers the yield of full-length product and contributes to the smearing pattern observed with some targets since shorter cDNAs are tailed and
ampli-fied. Since SUPERSCRIPTII RT
generates more full-length cDNA, it can increase the level of detection of 5´ end sequence, especially for
tran-scripts >1 kb(28).
Double-stranded 3´ termini and hairpin structures impair tailing of cDNA by decreasing the availability of the 3´-OH for tailing. The initial incubation of the cDNA at 94°C followed by chilling on ice helps to disrupt secondary structure. Some difficult targets may require the addition of DMSO
for effective tailing(figure 12)
(28). The tailing enzyme,
ter-minal deoxynucleotidyl transferase is tolerant of up to 20% DMSO.
If no products are visible or if only a smear is visible after nested amplification, a Southern blot can be used to detect products. This requires internal sequence information to use as a probe.
Quantifying mRNA Expression
Quantifying mRNA expression is challenging RT-PCR, but offers advantages over tradi-tional RNA analysis methods. RT-PCR is more sensitive than Northern blot or ribo-nuclease protection analysis and requires less RNA and sequence information. However, RT-PCR involves two enzymatic steps that can contribute to variability in the amount of RT-PCR product. The amount of RNA con-verted to cDNA affects yield, but the major difficulty in quantitative PCR is the expo-nential nature of PCR, in which small vari-ations between samples translates to large
differences in product yield(29). Two popular
8 R T - P C R A P P L I C A T I O N S
CCCCH A P T E R H A P T E R H A P T E R H A P T E R 4444
CH A P T E R 4
RT-PCR Applications
FIGURE 11. Summary of the 5´ RACE procedure.
Figure 11
5´ mRNA
GSP1 (A)n (A)n 5´ 3´ 3´ 3´CC...CC 3´CC...CC 5´ GI ... IG
Anneal first strand primer, GSP1, to mRNA
GSP2
Copy mRNA into cDNA with SUPERSCRIPTTM II RT
Degrade RNA with RNase Mix Purify cDNA with
GLASSMAX® Spin
Cartridge Tail purified cDNA with dCTP and TdT
PCR amplify dC-tailed cDNA using the Abridged Anchor Primer and nested GSP2.
Reamplify primary PCR product using AUAP, or UAP, and nested GSP
5´
5´ 5´
Abridged Anchor Primer
nested GSP 5´ 3´ UAP AUAP 5´ GI ... IG 3´ CC...CC
FIGURE 12. 5´ RACE.cDNA was synthesized from 5 µg HeLa total RNA with SUPERSCRIPT™II RT at 45°C. 10 µl of purified cDNA was tailed in the presence of 10% DMSO. 1 µl of the tailing reaction was directly amplified for 40 cycles with primers for human tuberous sclerosis and ELONGASE®Enzyme Mix (primary PCR 2.8 kb; lane 1). A 10 µl gel plug was removed around the 2.8-kb band. The DNA was eluted in 50 µl of TE. Nested PCR (30 cycles) was performed using 1 µl of size-selected PCR product (nested PCR 2.7 kb; lane 2). The gel is stained with SYBR®Green I. –kb
–––– 2.8 – 2.7 1 2 1 Kb DNA Ladder
CH A P T E R 4 CH A P T E R 4 CCH A P T E R H A P T E R 44
CH A P T E R 4
R T - P C R A P P L I C A T I O N S 9
methods for quantifying mRNA abundance are competitive, quantitative PCR and
real-time PCR(4,30).
In competitive PCR, an exogenous RNA transcript (internal standard RNA) is added before the RT step to control for sample-to-sample variation. The internal standard RNA is reverse transcribed and amplified with the target to control for differences in the efficiency of cDNA conversion and ampli-fication. Quantitation is performed by co-amplification of the specific target sequence together with known concentrations of the internal standard RNA. The abundance of the target is determined by comparing the signal obtained for the internal standard to the signal for the target.
The internal standard RNA shares the same primer recognition sites with the tar-get, but is a different size. Several methods
exist to generate internal standards(31). One
of the simplest methods involves installing the primer recognition sites on nonspecific
spacer DNA by PCR(31). This product can
be cloned into a vector carrying the T7 or SP6 RNA polymerase promoter, or the RNA promoter sequences can be included on the forward primer in order to install the
sequences by PCR(32). Then, RNA standards
can be generated by in vitro transcription. Competitive, quantitative PCR can be per-formed in one-step RT-PCR using a GSP or performed in a two-step reaction using a GSP or oligo(dT). Oligo(dT) sequence can be installed by adding poly(dT) sequences
to the reverse primer(32).
Competitive RT-PCR is an end-point analysis that requires the amplification efficiency of the target and the internal stan-dard to be equal. Some prior knowledge of the amount of starting target is necessary to establish a concentration range for the internal standard. For accurate quantitation, reactions containing more standard than tar-get and less standard than tartar-get are required.
Real-time RT-PCR is non-competitive and detects the product as it is being formed. Several probes can be used to assay the accu-mulation of product including fluorogenic 5´ nuclease probes and Molecular Beacons
(33,34). The first method is based on the 5´ nuclease activity of Taq DNA polymerase, which is used to cleave a hybridization probe
at the branch point during extension(33). The
assay uses probes with two fluorescent labels, one dye serves as a reporter and the other quenches its signal until the probe is cleaved.
Molecular Beacons contain a 5´ fluoro-phore and 3´ quencher. These probes are designed with a hairpin structure bringing the fluorophore and quencher in close
prox-imity to quench fluorescence(34). The stem
structure is composed of 5 to 7 nucleotides and is GC rich. The outer loop structure is composed of 15 to 30 nucleotides and is complementary to the target sequence. When the target sequence is present, the
molecular beacon hybridizes to the target, relaxing the hairpin structure and allowing fluores-cence.
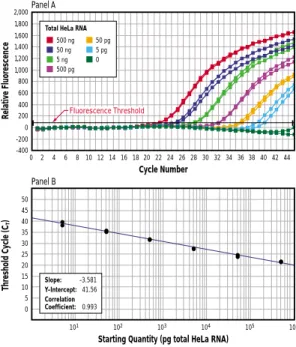
For both probes, fluorescent measurements are made in real time during each cycle of PCR using a thermal cycler coupled to an optical excitation and detection device. The amount of fluores-cence released is proportional to the amount of PCR product. The cycle at which the amount of released fluorescence crosses an established baseline fluorescence is known as the threshold cycle
or CT. The CTvalue is inversely
proportional to the amount of starting target. Thus,
high-copy-number samples will have low CT
values and low-copy-number
samples will have high CTvalues
(figure 13).
For absolute quantification of messages, a standard curve is generated using an in vitro
transcribed RNA. The CTvalue is determined
for different concentrations of the in vitro
transcribed RNA. Then the CT values are
plotted against the RNA concentrations to generate a standard curve for quantifying the level of expression in unknown samples (figure 13, panel B).
Real-time RT-PCR offers advantages over competitive RT-PCR. Fluorescence monitoring is highly sensitive and highly accurate with a linear-dose response over a
wide range of target concentrations(figure 13)
(30). Samples do not require
post-amplifi-cation analysis and little prior knowledge of target abundance is required. Use a two-step RT-PCR strategy for quantifying multiple messages in a single RNA sample and use a one-step strategy for added convenience when processing large numbers of samples.
-400 -200 0 200 400 600 800 1,000 1,200 1,400 1,600 1,800 2,000
0 2 4 6 8 10 12 14 16 18 20 22 24 26 28 30 32 34 36 38 40 42 44
0 5 10 15 20 25 30 35 40 45 50 105 104 103 102
101 106
Slope: -3.581 Y-Intercept:41.56 Correlation Coefficient: 0.993 500 ng 50 ng 5 ng 500 pg 50 pg 5 pg 0
Total HeLa RNA
Fluorescence Threshold
FIGURE 13. Real-time PCR quantitation of retinoblastoma mRNA.RT-PCR of duplicate samples of total HeLa RNA was performed with the PLATINUM®Quantitative RT-PCR THERMOSCRIPT™One-Step System (cDNA synthesis was performed at 60°C) and detected using a FAM-labeled Molecular Beacon probe (400 nM) on an ABI Prism®7700. Panel A. Relative fluorescence intensity of duplicate samples during PCR. Panel B. Standard curve.
Relative Fluorescence Threshold Cyc le (C T ) Cycle Number
Starting Quantity (pg total HeLa RNA)
Panel A
Primer Design
C
areful primer design is one of themost important aspects of PCR. The ideal primer pair anneals to unique sequences that flank the target and not to other sequences in the sample. Poorly designed primers may amplify other, non-target sequences. The following guidelines describe the desirable characteristics of a primer sequence that increase specificity: • Typical primers are 18 to 24 nucleotides in
length. The primer needs to be long enough for the sequence to be unique and to reduce the probability of the sequence being found at non-target sites. However, primers greater than 24 nucleotides do not confer greater specificity. Longer sequences can hybridize with some mismatching, which decreases specificity, and hybridize slower than shorter
sequences, which may decrease yield(2).
• Select primers that are 40% to 60% GC or mirror the GC content of the template. • Design primers with G or C residues in the
5´ and central regions. This increases the primer’s stability and confers hybridization stability with the target sequence.
• Avoid complementary sequences at the 3´ end of primer pairs. This prevents ampli-fication from the primers themselves to form primer-dimers.
• Avoid a GC-rich 3´ end. Design primers to contain 3 As or Ts within the last 5
nucleotides(35).
• Avoid mismatches at the 3´ end. The last 3´ nucleotide needs to anneal to the template for the polymerase to catalyze extension
(36).
• Avoid sequences with the potential to form internal secondary structure. This desta-bilizes primer annealing.
Additional sequences that are not present on the target, such as restriction sites and promoter sequences, can be added to the 5´ end of a primer without affecting specificity. These sequences are not included when
esti-mating the Tmof a primer. However, check
these regions for complementarity and internal secondary structures.
Sometimes only limited sequence infor-mation is available for primer design. For example, if only the amino acid sequence is known, degenerate primers are designed. Degenerate primers are a mix of different sequences representing all possible bases coding for a single amino
acid. To improve specificity, minimize the degeneracy con-sulting codon usage tables for base preference in different
organisms (2). In addition,
deoxyinosine may be used in places where more than one base is possible. Inosine pairs
with all bases and will lower the annealing temperature of the primer. Do not include degenerate bases at the 3´ end of the primer, since annealing of the last three bases on the 3´ end can be enough to initiate PCR at the wrong sites. Use higher primer concentrations (1 µM to 3 µM) because many of the primers in the degenerate mixture are not specific for the target(37).
Primer Annealing Temperature
Another important parameter for primers is
the melting temperature (Tm). This is the
temperature at which 50% of the primer and its complementary sequence are present in a
duplex DNA molecule. The Tmis necessary
to establish an annealing temperature for PCR. Ideally, the annealing temperature is
low enough to guarantee efficient annealing of the primer to the target, but high enough to minimize nonspecific binding. Reason-able annealing temperatures range from 55°C to 70°C. Annealing temperatures are
generally set about 5°C below the Tmof the
primers.
There are several formulas for estimating
the Tm(38-40). Table 4 lists two of the
com-monly used formulas for determining a
primer’s Tm. The first formula was derived for
hybridization in high salt (1 M) and is valid for primers <18 bases. The second formula
estimates Tmbased on GC content and salt
concentration. The most reliable method for
determining the Tmof a primer is the
nearest-neighbor analysis(38). This method predicts
the hybridization stability of a primer from
the primary sequence and the identity of the neighboring bases. Most computer programs use nearest-neighbor analysis.
The Tmcan vary significantly depending
on the formula used and the primer sequence. Since most formulas provide an estimated
Tmvalue, the annealing temperature is only a
starting point. Specificity can be increased by analyzing several reactions with increas-ingly higher annealing temperatures. Begin
at 5°C below the estimated Tmand increase
the annealing temperature in 2°C incre-ments. Higher annealing temperatures can reduce the formation of both primer-dimer and nonspecific products. For best results,
both primers need to have a similar Tm.
Primer pairs whose Tmvaries by more than
5°C exhibit greater mispriming due to the
10 I M P R O V I N G P C R S P E C I F I C I T Y
CCCCH A P T E R H A P T E R H A P T E R H A P T E R 5555
CH A P T E R 5
Improving PCR Specificity
Table 4
Simple Formula(39)(valid for primers <18 bases) Tm= 4°C ×(G + C) + 2°C ×(A + T)
Tmfor Oligonucleotides(40)(dependent on salt concentration) Tm= 81.5 + 16.6 ×(log10[Na+]) + 0.41 ×(%G + C) – 675/n Where n = number of bases and [Na+] = monovalent (Na+or K+) cations
TABLE 4. Formulas to estimate Tm.
Careful primer design
is one of the most important
aspects of PCR. Poorly designed
primers may amplify other,
non-target sequences.
use of lower annealing temperatures during
cycling. If two primers have a different Tms,
set the annealing temperature 5°C below
the lowest Tm. Or to increase specificity,
perform 5 cycles at the annealing temper-ature established by the primer with the
higher Tmand then the remaining cycles at
the annealing temperature established by
lower Tm. This allows some copies of the
target to be generated under more stringent conditions.
Touchdown PCR
Touchdown PCR increases sensitivity by using stringent annealing conditions during
the early cycles of PCR(41). Cycling begins
with annealing temperature approximately
5°C above the estimated Tm. It is
incremen-tally decreased by 1°C to 2°C every cycle until the annealing temperature is about
5°C below the Tm. Only targets with the
greatest homology will be amplified. These products will continue to be amplified and will compete out nonspecific products amplified in later cycles. Touchdown PCR is useful in applications where the degree of homology between the target sequences and
the primer are unknown, such as AFLP®
DNA fingerprinting.
Primer Concentration
Primer concentration can affect specificity. Optimal primer concentration typically falls between 0.1 to 0.5 µM. Higher concen-trations of primer may result in the amplifi-cation of nonspecific products.
To determine primer concentration, read
the optical density at 260 nm (OD260). Then,
using Beers Law(formula 1) calculate the
concentration by using the absorbance and the reciprocal of the millimolar extinction coefficient (nmol/OD). The millimolar extinction coefficient can be calculated
using formula 2(42). Unlike large
double-stranded DNA molecules where an averaged
extinction coefficient can be used, the use of the extinction coefficient calculated for the primer is essential to accurately
deter-mine the concentration(42). This is because
primers are short and the base composition can vary greatly. Both the extinction coeffi-cient (OD/µmol) and the reciprocal of the extinction coefficient (µmol/OD) are
pro-vided on the GIBCOBRL®Custom Primer
certificate of analysis. In addition, do not estimate primer concentration on ethidium bromide-stained gels using oligonucleotides as standards, since the staining capability of the standard and the primer can vary greatly
depending on their sequence(43).
Primer Purity and Stability
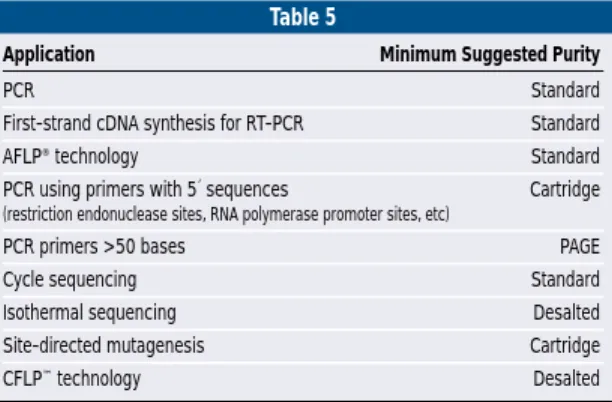
Standard purity Custom Primers are
suffi-cient for most PCR applications(table 5).
With Life Technologies®P
ARALLELARRAY
SYNTHESIS™technology, desalting is not
nec-essary. The benzoyl and isobutyryl groups removed by desalting are found in lower
amounts with PARALLELARRAYSYNTHESIS
technology, compared to other methods, and thus do not interfere with PCR. Some appli-cations require purification to remove any less than full-length sequences generated during synthesis. These truncated sequences are generated because DNA synthesis chem-istry is not 100% efficient. It is a cyclical
process in which DNA is synthesized 3´→5´
using chemical reactions that are repeated for each base added. Failures can occur during any cycle. Longer primers, especially primers >50 bases, have a greater portion of truncated sequences and may require purification.
Primer yield is affected by the efficiency of the synthesis chemistry and by the method of purification. Life Technologies guarantees the total oligonucleotide yield as a minimum
number of OD units(table 6, page 12). Custom
Primers are shipped lyophilized. It is best to reconstitute primers in TE [10 mM Tris-HCl (pH 8.0), 1 mM EDTA] to bring the final concentration to 100 µM. TE is better than deionized water since the pH of the water is often slightly acidic and can cause hydrolysis of the oligonucleotide.
The stability of the primer depends on storage conditions. Store lyophilized and reconsti-tuted primers at –20°C. Primers
reconstituted in TE at ≥10 µM
are stable for >6 months at –20°C, but only <1 week when stored at room temperature (15°C to 30°C). Lyophilized primers are stable >1 year at –20°C, and up to 2 months when stored at room tempera-ture (15°C to 30°C).
I M P R O V I N G P C R S P E C I F I C I T Y 11
CH A P T E R 5 CH A P T E R 5 CCH A P T E R H A P T E R 55
CH A P T E R 5
Table 5
Application Minimum Suggested Purity
PCR Standard First-strand cDNA synthesis for RT-PCR Standard
AFLP®technology Standard
PCR using primers with 5´ sequences Cartridge
(restriction endonuclease sites, RNA polymerase promoter sites, etc)
PCR primers >50 bases PAGE
Cycle sequencing Standard
Isothermal sequencing Desalted Site-directed mutagenesis Cartridge
CFLP™technology Desalted
TABLE 5. Minimum recommended primer purity for PCR applications.
Formula 1
Concentration= A260×dilution factor ×the reciprocal of the extinction coefficient ×conversion factors
Example:To calculate the concentration of an oligonucleotide in 1 ml, measure the A260of 10 µl of the oligonucleotide in 990 µl of water (1:100 dilution). If the A260= 0.14 OD and the oligonucleotide has a reciprocal extinction coefficient of 4.9 nmol/OD, the concentration would be calculated as follows:
Concentration= 0.14 OD ×100 ×4.9 nmol ×1 µmol ×103ml
ml OD 103nmol L
= 69 µM
Formula 2
Millimolar Extinction Coefficient of Oligonucleotide= A(15.2) + C(7.05) + G(12.01) + T(8.4) at pH 8.0 Where A, C, G, and T are the number of dAs, dCs, dGs, and dTs(35).
12 I M P R O V I N G P C R S P E C I F I C I T Y CCCCH A P T E R H A P T E R H A P T E R H A P T E R 5555
CH A P T E R 5
Hot Start
Hot-start PCR is one of the most important methods, in addition to good primer design, for increasing PCR specificity. Even though the optimal extension temperature for Taq DNA polymerase is approximately 72°C, the polymerase has activity at room temperature
(44). Thus, nonspecific products are often
generated during PCR set-up and at the start of thermal cycling when reactions are briefly incubated at temperatures well below the
annealing temperature(45,46). Once these
nonspecific products are formed they can be efficiently amplified. Hot-start PCR is partic-ularly effective when the sites available for designing primers are limited due to the location of genetic elements, such as site-directed mutagenesis, expression cloning, or the construction and manipulation of genetic elements for DNA engineering.
A popular method that limits Taq DNA polymerase activity is to set-up amplification reactions on ice and place them into a pre-heated thermal cycler. This method is simple and inexpensive, but does not completely
inactivate enzyme activity and therefore does not completely eliminate the amplification of nonspecific products.
Hot start delays DNA synthesis by with-holding one of the essential components until the thermal cycler reaches the
denatur-ation temperature. Most manual hot-start methods involve the delayed addition of Taq DNA polymerase, which can be cumber-some especially for high-throughput
applica-tions(46). Other hot-start methods use wax
barriers to encapsulate an essential compo-nent, such as magnesium or enzyme, or to physically separate reaction components, such as template and buffer, from each other. Melting of the wax during thermal cycling releases and mixes all of the components together. Like manual hot-start methods, wax barrier methods can be cumbersome, prone to contamination and unreliable in high-throughput applications.
PLATINUMDNA Polymerases are con-venient and highly-effective for automatic
hot-start PCR (figure 14). PLATINUM Taq
DNA Polymerase is comprised of recombi-nant Taq DNA polymerase complexed with monoclonal antibodies to Taq DNA
poly-merase(47). The antibodies prevent enzyme
activity during PCR set-up and even during prolonged incubations at room temperature.
Taq DNA polymerase is released into the
reaction after incubation at 94°C during the denaturation step, restoring full polymerase activity. In comparison to chemically modi-fied Taq DNA polymerase for hot-start PCR, PLATINUM enzymes do not require
pro-longed incubation at 94°C (10 to 15 min) to activate the polymerase. Greater than 90% of Taq DNA polymerase activity is restored
in 2 min at 94°C with PLATINUMTaq DNA
Polymerase(48).
Magnesium Concentration
Magnesium affects several aspects of PCR including DNA polymerase activity, which can affect yield; and primer annealing, which can affect specificity. The dNTPs and template bind magnesium and reduce the amount of free magnesium available for enzyme activity. The optimal magnesium concentration varies for each primer pair and template, but the starting concentration in typical PCR containing 200 µM dNTPs is 1.5 mM (Note: for real-time quantitative PCR use 3 to 5 mM magnesium with
fluo-rescent probes)(2). Higher concentrations of
free magnesium can result in greater yield, but can also increase nonspecific
amplifi-cation and reduce fidelity(49,50). To
deter-mine the best concentration, perform a magnesium titration using from 1 mM to 3 mM in 0.5 mM increments. To reduce the
Improving PCR Specificity
(continued)
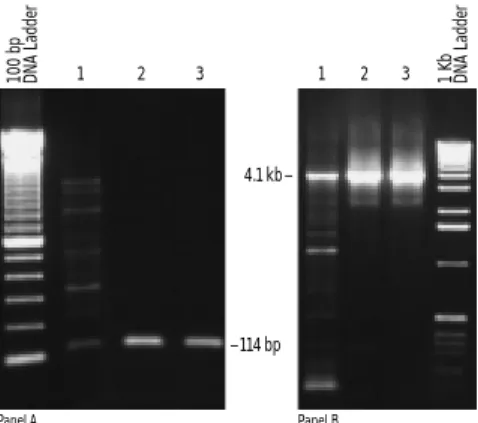
4.1 kb –
–114 bp
1 2 3
1 2 3
100 bp DNA Ladder 1 Kb DNA Ladder
FIGURE 14. Improved specificity with PLATINUM®Taq DNA
Poly-merase.Panel A. Detection of cloned HIV DNA in human genomic DNA. 1,000 copies of plasmid DNA with the HIV gag region was mixed with 100 ng of genomic DNA and amplified with primers to the gag region. Lane 1.TaqDNA polymerase with room temperature assembly. Lane 2.TaqDNA polymerase with manual hot start by addition of enzyme at 94°C. Lane 3. PLATINUMTaqDNA Polymerase with room temperature assembly. Panel B. Amplification of 4.1 kb of human β-globin from 100 ng of human genomic DNA. Lane 1.Taq DNA polymerase with room temperature assembly. Lane 2.TaqDNA polymerase with assembly on ice and placed in a preheated (80°C) thermal cycler. Lane 3. PLATINUMTaqDNA Polymerase with room tem-perature assembly.
Panel A Panel B
Table 6
Minimum Yield (OD) for Different Primer Purities* Standard/
Number of Bases Synthesis Scale Desalted Cartridge HPLC PAGE
<20 50 nmole 2 2 NA NA
200 nmole 8 8 3 1
1 µmole 20 20 10 3
10 µmole 200 NA 100 30
≥20 50 nmole 5 2 NA NA
200 nmole 20 10 3 1
1 µmole 50 25 15 5
10 µmole 500 NA 150 50
Note: For primers >50 bases, PAGE purification is recommended and HPLC is not an option. NA is not available.
*These yields are seen with the following 5´ modifications: biotin, fluorescein (FITC), rhodamine, primary amines (NH2), phosphate (PO4),
HEX, TET, FAM, and phosphorothioates (S-Oligos). Other modifications may have slightly lower yields.
need for magnesium optimization, use PLATINUMTaq DNA Polymerase. PLATINUM Taq DNA Polymerase functions over a
broader range of magnesium concentration than Taq DNA polymerase so less
optimi-zation is required(figure 15)(47).
Additives to Enhance PCR
Optimization of the annealing temperature, primer design, and magnesium concentra-tions is adequate to achieve high specificity amplification of many targets. However, some targets, including those with a high-GC content, require additional measures. Additives that affect DNA melting temper-ature provide another method for improving
product specificity and yield (figure 16).
Complete denaturation of the template is
required to obtain the best results. Addi-tionally, secondary structure can prevent primer binding and enzymatic elongation.
PCR additives, including formamide,
DMSO, glycerol, betaine, and PCRX
Enhancer Solution can enhance
amplifi-cation(51-53). Their proposed mechanism is
to lower the melting temperature, thereby aiding primer annealing and helping the DNA polymerase extend through regions
of secondary structure(53). PCRXSolution
has additional benefits. It requires less
magnesium optimization and works with PLATINUMTaq DNA Polymerase(figure 16)
and PLATINUMPfx DNA Polymerase. Thus,
combining PLATINUMtechnology and
addi-tives enhances specificity while minimizing the need for the third approach-magnesium optimization. For best results, optimize the
concentration of the additives (figure 17),
especially DMSO, formamide, and glycerol
that inhibit Taq DNA polymerase(46,52).
Nested PCR
Sequential rounds of amplification using nested primers can improve specificity and
sensitivity(3). The first round is a standard
amplification of 15 to 20 cycles. A small aliquot of the initial amplification is diluted 1:100 to 1:1,000 and added to the second round of amplifica-tion with 15 to 20 cycles. Alternatively, the initial amplifi-cation product can be size selected by gel purification. Two different primer sets are used for the two rounds of amplifi-cation. The second amplification uses a nested set of primers that bind to the target just inside the first set of primers. The chance of amplifying multiple targets is reduced with nested PCR since fewer targets will be comple-mentary to both sets of primers; whereas performing the same total number of cycles (30 to 40) with the same set of primers often amplifies nonspecific targets. Nested PCR can increase the sensitivity from limited amounts of target, such as amplifying a rare message, and increase the specificity of more challenging PCR applications such as 5´ RACE.
CH A P T E R 5 CH A P T E R 5 CCH A P T E R H A P T E R 55
CH A P T E R 5
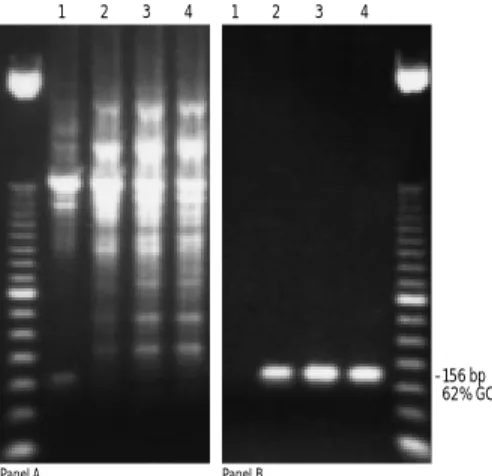
FIGURE 16. Improved specificity with PCRxEnhancer Solution.
A 156-bp fragment (62% GC content), was amplified from 100 ng of human genomic DNA using PLATINUM®TaqDNA Polymerase. MgCl
2
was titrated (1.0, 1.5, 2.0, 2.5 mM, lanes 1 to 4 respectively) using: standard PCR buffer (panel A) or PCRxAmplification Buffer with 1X
PCRxEnhancer Solution (panel B). Cycling was 35 cycles of 94°C for
30 s; 60°C for 30 s, and 68°C for 1 min.
–156 bp 62% GC
Panel A Panel B
0 X 1 X 2 X 2.5 X 3 X 3.5 X 4 X
–149 bp 78% GC
FIGURE 17. Titration of PCRxEnhancer Solution.A 149-bp (78%
GC) trinucleotide repeat-containing sequence was amplified from 100 ng of human genomic DNA with PLATINUM®TaqDNA Polymerase in 1X PCRxAmplification Buffer with varying amounts of PCRx
Enhancer Solution (0 to 4X).
1 2 3 4 1 2 3 4
FIGURE 15. Broader magnesium range with PLATINUM®Taq DNA Polymerase.A 2.8-kb region of the
human β-globin gene was amplified from 100 ng of human genomic DNA. Panel A.Taq DNA polymerase with assembly on ice and placed in a preheated (80°C) thermal cycler. Panel B. PLATINUMTaqDNA Poly-merase with room temperature assembly.
100 bp DNA Ladder
I M P R O V I N G P C R S P E C I F I C I T Y 13
1.0 1.4 1.8 2.2 2.6 3.0 (mM MgCl2)
1.0 1.4 1.8 2.2 2.6 3.0 (mM MgCl2)
Panel A Panel B
14 I N C R E A S I N G P C R S E N S I T I V I T Y CCCCH A P T E R H A P T E R H A P T E R H A P T E R 6666
CH A P T E R 6
Increasing PCR Sensitivity
Template Quality
T
emplate quality affects product yield. Anumber of contaminants found in DNA
preparations can inhibit PCR (46).
Reagents such as SDS, which are used in stan-dard genomic DNA preparations, can inhibit amplification reactions at concentrations as low as 0.01%. Newer methods for isolation of
high-quality genomic DNA include DNAZOL®
Reagents(53), which are guanidine-detergent
lysing solutions, and the FTA® Products,
which is a matrix-bound method for the storage and purification of DNA from
blood and other biological samples(table 7) (55).
Template Concentration
The amount of starting template is important for obtaining good product yields. For most
amplifications, 104 to 106 starting target
molecules allows sufficient amplification to visualize the product on an ethidium
bro-mide-stained gel(2). The optimal amount of
template required depends on the size of the
genome(table 8) (56). For example, 100 ng to
1 µg of human genomic DNA, correlating to
3×10⁴to 3×10⁵molecules, is sufficient to
detect a PCR product from a single-copy gene. For plasmid DNA, which is much smaller, the amount of DNA added to PCR is in the picogram range.
Enzyme Choice
In addition to using high-quality template DNA, the choice of polymerase also affects
yield(see table on page 22). PLATINUM
merases provide better yield than other poly-merases because they prevent amplification of nonspecific product during PCR set-up (figure 18). For high-sensitivity PCR of long products (up to 12 kb), choose an enzyme
mix, preferably in a PLATINUMformat, such
as PLATINUM Taq DNA Polymerase High
Fidelity. This enzyme combines the benefits of PLATINUMtechnology with those of enzyme mixes (Taq DNA Polymerase mixed with a proofreading polymerase).
Table 8
Target Molecules/µg Amount of DNA (µg)
Genomic DNA Size (bp)* of Genomic DNA for ~105Molecules
E. coli 4.7 ×10⁶ 1.8 ×10⁸ 0.001
Saccharomyces cerevisiae 2.0 ×10⁷ 4.5 ×10⁷ 0.01
Arabidopsis thaliana 7.0 ×10⁷ 1.3 ×10⁷ 0.01
Drosophila melanogaster 1.6 ×10⁸ 6.6 ×10⁵ 0.5
Homo sapiens 2.8 ×10⁹ 3.2 ×10⁵ 1.0
Xenopus laevis 2.9 ×10⁹ 3.1 ×10⁵ 1.0
Mus musculus 3.3 ×10⁹ 2.7 ×10⁵ 1.0
Zea mays 1.5 ×10¹⁰ 6.0 ×10⁴ 2.0
pUC 18 plasmid DNA 2.69 ×10³ 3.4 ×10¹¹ 1 ×10⁻⁶ * Haploid genome size
TABLE 8. Correlation of genome size and number of molecules.
1 Kb P
LUS
DNA L
ADDER
™
1 2 3 4 5 1 2 3 4 5 1 2 3 4 5
FIGURE 18. Amplification with different thermostable polymerases.Human blood was spotted on FTA®Cards. DNA was amplified directly from 1 to 3 mm punches of washed FTA Cards in 50 µl usingTaq DNA polymerase (panel A), PLATINUM®TaqDNA Polymerase (panel B), and PLATINUMTaqDNA Polymerase High Fidelity (panel C). Amplified products were 4.1, 5.2, 7.5, 8.0, and 8.4 kb in lanes 1 to 5, respectively.
Taq DNA Polymerase PLATINUMTaqDNA Polymerase PLATINUMTaqDNA Polymerase High Fidelity
TABLE 7. Methods for genomic DNA isolation.
Table 7
Method Description
Proteinase K/phenol extraction Classic method
DNAZOL®Reagents Fast, phenol-free DNA isolation
FTA®Products Matrix-bound purification and storage
–kb
– 8.4
CH A P T E R 7 CH A P T E R 7 CCH A P T E R H A P T E R 77
CH A P T E R 7
Enzymes with Proofreading
P
CR applications involving cloningand sequence analysis, expression of PCR products, or site-directed mutagenesis require high-fidelity PCR.
Taq DNA polymerase is considered a
low-fidelity polymerase since it lacks 3´ to 5´ exonuclease (proofreading) activity. The use of thermostable polymerases with 3´
exo-nuclease activity improve fidelity(57,58).
However, these polymerases can give lower
yields than Taq DNA polymerase. PLATINUM
Pfx DNA Polymerase has significantly better
fidelity than Taq DNA polymerase and offers the advantage of high yield and
speci-ficity of PLATINUMproducts(figure 19) (59).
Enzyme Mixes
Mixing Taq DNA polymerase with a second polymerase with 3´ exonuclease activity provides greater fidelity than Taq DNA polymerase alone and allows for higher yield and amplification of longer templates.
The GIBCOBRL high fidelity enzyme mix,
PLATINUM Taq DNA Polymerase High
Fidelity has 6-times greater fidelity than Taq DNA polymerase alone and can amplify up to 12 kb.
Other Parameters
Besides enzyme, high dNTP or magnesium concentrations can reduce fidelity. Decreasing the concentration of dNTPs from 200 µM to 25-50 µM can increase accuracy. If the concentration is not the same for all four nucleotides, the fidelity will be effected. Performing fewer cycles of PCR also can help increase fidelity, since the probability of a mutation increases with increasing cycle number and product length.
Improving Fidelity
1 Kb P
LUS
DNA L
ADDER
™
1 Kb P
LUS
DNA L
ADDER
1 Kb P
LUS
DNA L
ADDER
FIGURE 19. High sensitivity and specificity with PLATINUM®Pfx DNA Polymerase.Genomic DNA (100, 50, 10, 5, 1, and 0 ng, lanes 1 to 6)
was amplified with primers for a 1.1-kb fragment of human thrombospondin for 35 cycles. Panel A. 1 unit of PLATINUMPfxDNA Polymerase with room temperature set-up. Panel B. 2.5 units of PfuTurbo™DNA Polymerase with set-up on ice. Panel C. 1 unit ofTaqDNA Polymerase with set-up on ice.
Panel A Panel B Panel C
–1.1 kb
1 2 3 4 5 6 1 2 3 4 5 6 1 2 3 4 5 6
![FIGURE 3. Effect of RT on yield of first-strand cDNA. cDNA was synthesized from 2.5 µg (for T HERMO S CRIPT ™ RT and AMV) or 1 µg (for S UPER S CRIPT ™ II RT and M-MLV) of a 7.5-kb mRNA using oligo(dT) primer and 10 µCi of [α- 32 P]dCTP with the recommende](https://thumb-us.123doks.com/thumbv2/123dok_us/8544387.2303477/4.918.83.420.585.810/figure-effect-strand-synthesized-hermo-cript-cript-recommende.webp)