2013 Transparency Report Card
- Bringing state & local government to light
2013 Transparency
Report Card
Bringing state & local governments to light
Kristin McMurray
Managing Editor, Sunshine Review
Table of Contents
Executive Summary
4
Changing the way governments
6
do business
The best, worst of government
8
websites
The future of state & local
13
transparency
Appendix A: Transparency scoreboard
14
Appendix B: Methodology
17
Appendix C: Checklist defined
20
Transparency is an American issue, not a par-tisan issue for Republicans or Democrats to showboat. In 2008, Sunshine Review devel-oped the original 10-point transparency check-list. Since then, Sunshine Review used the checklist to evaluate state, county, city, and school district websites for transparency prac-tices.
During the past year, Sunshine Review used these transparency checklists to conduct its first nationwide report on the proactive disclo-sure of government information. The report
examines the websites of each state govern-ment, the five largest counties and cities in each state, and the ten largest school districts in each state.
Evaluations confirmed what the Sunny Awards indicated since 2010—transparency is not a fad, but rather, it is a staple of good govern-ment.
State government websites outperformed local government websites, with 26 percent of state websites scoring in the “A” range, and 60 per-cent scoring a “B” or above. In contrast, 28 percent of county websites scored a “B” or above, and 44 percent of cities scored a “B” or above. School district websites had the most dismal grades with just 20 percent of school districts scoring a “B” or
above.
States continue to struggle with proactively disclosing lobbying data, how to obtain public records, and with in-creasing the ease of finding supplemental data.
Both counties and cities struggled with reporting the cost of government sector lobbying costs, publishing contracts and disclosing how to obtain public records. School districts failed to comprehensively re-port contract agreements, how to obtain pub-lic records, publish audits, or provided state-ments about their funding.
All government entities, however, suc-cessfully disclosed how to contact elected officials, annual budgets, and meeting minutes. All state websites reported tax revenue data and dis-closed audit information, and 70 per-cent of school districts posted infor-mation about their academic perform-ance.
The five states earning the highest grades are California, Illinois, Maryland, Pennsylvania, and Washington. The
five worst states are Alabama, Kentucky Mis-sissippi, Nebraska, and South Dakota. Even California, the best performing state, failed to
attain an “A” average, which is a disservice to citizens.
Category Grade States
Exceeds Expectations B+ California, Illinois, Maryland, Pennsylvania,
Texas, Virginia, and Washington
Above Average B Colorado, Delaware, Florida, Georgia, Hawaii,
Indiana, Iowa, Massachusetts, Missouri, New Jersey, New York, North Carolina, Ohio, Ore-gon, Tennessee, Utah, and Wisconsin
Acceptable B- Alaska, Arizona, Connecticut, Kansas and
Oklahoma
Lagging C+ Arkansas, Louisiana, Maine, Michigan,
Min-nesota, Montana, New Hampshire, Rhode Island, South Carolina, Wyoming
Poor C Alabama, Idaho, Kentucky, Mississippi,
Ne-braska, Nevada, New Mexico, North Dakota, South Dakota, Vermont, West Virginia
Sunshine Review’s mission focuses on state and local government transparency, engaging citizens, and changing the way governments do business. After developing the original transparency checklist in 2008, Sunshine Re-view launched the Sunny Awards in 2010 and rated all 3,140 counties in America. Sunny Awards were given to websites that earned an “A” grade, and in that first year, only 40 web-sites merited a “Sunny Award.” When asked why we did not report on the biggest failures in 2010, the answer was that there were simply too many to report.
In 2011 the number of Sunny Award winners jumped to over 100, and in 2012 the number doubled again, with more than 200 government entities earning an “A” grade. In 2012, U.S. Pub-lic Interest Research Group (PIRG) also reported that 46
states had established transparency portals allowing citizens access to the state’s check-books,1 proving that transparency is not a fad,
but an established part of the political land-scape.
In 2012, Sunshine Review spoke to hundreds of government officials about how to better serve their constituents through their websites. The best place to start putting good govern-ance into practice is by disclosing information on the government website.
A tale of two counties
Two of the best examples of improvements come from the state of Colorado.
Douglas County was the first county in Colo-rado to earn an “A+” website transparency
grade from Sunshine Review. The county dedicated itself to incorpo-rating transparency into the way it governed, in its mission, vision and code of conduct. In short, Douglas County officials viewed transpar-ency as an essential part of their jobs and citizens responded very positively to their actions by building stronger relationships and filing fewer public records requests.
Then there is the story of Adams County, Colo-rado. Adams county was under investigation
1 US. PIRG, Following the Money, March 2012
Changing the way governments do
business
for a number of corruption charges including theft, bribery, sexual harassment, unlawful perks in the manner of free cars, and ultimately bilking taxpayers out of at
least $1.8 million.2,3 After
seeing the successes in Douglas County, Adams County officials decided they needed to correct their approach to govern-ing, and in May 2011 they committed to sweeping ethics reforms.
Where did this reform take the county? By February 2012, the county had cre-ated a transparency portal modeled after Sunshine Review’s checklist, earning
the county its first Sunny Award. In April 2012, the county created a “Transparency Hotline” and exactly one year after committing to gov-ernment transparency, the county officials re-ported saving $1 million from their reform efforts.4
What these two counties have in common is that they were not just dedicated to earning an
A+ from Sunshine Review, but that they were dedicated to ensuring that citizens have ac-cess to information. The two counties also il-lustrate the differences be-tween proactive and reac-tive approaches to trans-parency. Achieving good governance by enacting transparent practices be-fore a problem emerges benefits government offi-cials and constituents alike. While government can achieve great reform in the wake of scandal, a reactive approach does not change alter that citizens’ money has been wasted and their trust shattered. The onus is on the citizens to change the way govern-ments do business.
In contrast, proactive disclosure ensures that citizens have the information necessary to hold their local governments accountable by mak-ing sure they are are conductmak-ing business properly and honestly in the first place.
2 Denver Post, Adams County officials get deals on county cars, Jan. 30, 2011
3 Denver Post, Adams manager must pay $1.8 million in Quality Paving restitution, Oct. 17, 2012 4 Denver Post, Adams County’s reform pledge, one year later, May 30, 2012
“A responsibility of the Board, on behalf of our citizens and taxpayers,
is to see to it that Douglas County Government is open and transpar-ent. We recognize that nothing is more critical to building a reputation
for stability and credibility as stew-ards of public assets than public trust and – especially for
govern-ment – informational and fiscal transparency is foundational to that
achievement.” - Commissioner Jill Repella, Douglas County, Colorado
State websites
Overall, state websites were graded better than local government websites. Every state met Sunshine Review’s criteria for disclosing tax revenues, audits and contact information for administrative officials. Every state, with the exception of Alabama, disclosed information necessary to contact elected officials.
However, only three states fully complied with Sunshine Review’s lobbying requirements, in-cluding disclosure of state funded lobbying activity, agency lobbying and of a database of registered lobbyists. Arizona, Massachusetts, and Washington did disclose this information. Only 32 percent of states provided contact information for all public information officers in a central location. Over half, 60 percent, of
state websites included features like an internal search function, which increases user’s ease of access.
The highest performing states, California, Massachusetts, Washington, and Wisconsin all earned an “A+.”
The poorest performing states were Kentucky, New Mexico, and Nebraska, which satisfied only five out of the 10 checkpoints and earned just a “C” grade.
County websites
Forty-five states have active county
govern-The best, worst of government
websites
* Each letter stands for a point on the transparency checklist. See Appendix C for checklist definitions.
ments. States without active county govern-ment include: Connecticut, Massachusetts, New Hampshire, Rhode Island, and Vermont. Colorado and Illinois counties all received high marks, earning an “A” average. A total of 40 percent of counties earned an average above a “B” grade.
Counties diligently disclosed a current annual budget and archived budgets for at least three years—97 percent of counties meeting all of Sunshine Review’s criteria. (See Appendix C, Table C-2) However, counties failed to disclose approved vendor contracts, government sec-tor lobbying information, and how to obtain
public records. Only 12 percent accurately disclosed government sector lobbying mation and less than half fully disclosed infor-mation about contracts and contract informa-tion for public officials.
Highest grades
State Score Grade
Colorado 92.00% A-Illinois 90.00% A-Kansas 88.00% B+ Alaska 86.00% B+ Arizona 86.00% B+ Georgia 86.00% B+ Virginia 86.00% B+
Lowest grades
City websites
Sunshine Review evaluated the five most populous cities in every state. In thirteen states
State Score Grade
Idaho 42.00% D+ Nevada 42.00% D+ West Virginia 40.00% D Maine 36.00% D-South Dakota 32.00% D-Arkansas 28.00% F
the capital city is not among the five largest cities. In such instances, Sunshine Review evaluated the five largest cities and the state capital. (See Appendix B).
Kansas’ cities averaged an “A” grade, while 44 percent of states averaged a “B” or above.
Cities outperformed counties at disclosing permit applications and ordinances with 93 percent meeting Sunshine Review’s criteria. Largely due to the number of cities in charge of planning ordinances and zoning. Other suc-cesses include 92 percent posting contact in-formation for public officials and 91 percent of cities disclosing the most current budget and budgets for the past three years.
Like counties, cities struggled to disclose in-formation on approved contract statements with only half of evaluated cities meeting the criteria. Even fewer disclosed how to attain public records and only 12 percent completely disclosing lobbying information to the public.
Highest grades
Lowest grades
School district websites
There are over 14,000 school districts in the
State Score Grade
Kansas 90.00% A-Arizona 88.00% B+
Utah 88.00% B+
Texas 84.00% B+
New Mexico 84.00% B+
State Score Grade Alabama 50.00% C-Mississippi 50.00% C-South Dakota 49.70% C-Delaware 48.00% D+ West Virginia 28.00%
D-US, and education spending accounts for roughly 30 percent of most state budgets.5
Sunshine Review evaluated the 10 largest school districts in each state, with the excep-tion of Tennessee. There, Sunshine Review evaluated 11 school districts due to an up-coming school district merger.
Overall, school districts performed the poorest on the transparency checklist. Not a single dis-trict averaged an “A” grade and only 14 per-cent of districts evaluated, or seven states, managed to average a “B” grade. Twenty-four states had school districts averaging lower than a “C” grade and 14 states with districts scoring in the “D” range. West Virginia is the only state to earn a a failing grade.
School districts also had the lowest percent-ages for fully disclosing how to contact elected and administrative officials. Only 72 percent disclosed contact information for administra-tive officials and 66 percent provided contact information for school board members.
Academic performance reports were provided by 69 percent of school districts. A mere 58 percent provided information on current and archived budgets, as opposed to the near 90 percent of county and city governments that made that information available to citizens on their website.
Like counties and cities, school districts also struggled to provide information on vendor and labor agreements, with just 32 percent able to meet Sunshine Review’s criteria (See Appendix C, Table C-3). School district websites rarely provided information on how to request public records (only 28 percent).
Highest grades
State Score Grade
Florida 87.00% B+
Utah 86.00% B+
Virginia 86.00% B+
Ohio 81.00% B
North Carolina 81.00% B Illinois 81.00% B
Lowest grades
State Score Grade
Montana 36.00% D-Maine 35.20% D-North Dakota 32.00% D-Mississippi 32.00% D-West Virginia 18.00% F * See Appendix C for checklist definitions.
Transparency data mandates
trickling down
Over the past five years, individuals largely drove transparency by creating an array of in-novations and a multitude of practices for maintaining data. When the U.S. House of Representatives passed the Digital Account-ability and Transparency Act (DATA Act) in 2012 it put into motion the idea of mandating how data is maintained.6 States like California,
Georgia7 and Indiana are also working to
in-corporate local data into their state websites. The biggest complaint from state officials thus far is the different practices for maintaining lo-cal information. Lolo-cal officials do not see why they have to resubmit information that is al-ready disclosed online. In Georgia, local budg-ets over $1 million must be submitted to the University of Georgia to be posted online, but in 2012 only 33 percent of cities, 57 percent of counties, and 83 percent of school districts complied.8
If the Senate passes the DATA Act in 2013, it is more likely that state lawmakers will put forth similar legislation regulating how local data is maintained and shared with state legislatures.
While that could be a possible long-term benefit, such legislation could lead to a short-term increase in spending on data that is al-ready available to citizens.
The future of Sunshine
Review’s Transparency
Checklist
In 2013 Sunshine Review will implement changes to its transparency checklist. For the 2013 Sunny Awards, Sunshine Review will re-evaluate all state websites according to an up-dated state website evaluation. (Changes noted in Appendix D)
In April, Sunshine Review, working with other pro-transparency advocates, will conduct a survey to create new requirements for county, city, and school district websites. In July, Sun-shine Review will share these requirements with local officials. Officials will then have time and assistance to transition to the new trans-parency checklist before Sunshine Review re-leases its 2014 Transparency Report Card and announces the 2014 Sunny Awards.
6Sunlight Foundation, Red line of DATA Act, September 21, 2012 7 General Assembly of Georgia, HB 122
8CBS Atlanta, Ga. governments fail to post electronic budgets, July 23, 2012
The future of state & local
government transparency
Appendix A: Transparency
scorecard
State Overall % Overall Grade State % State Grade Counties % Alabama Alaska Arizona Arkansas California Colorado Connecticut Delaware Florida Georgia Hawaii Idaho Illinois Indiana Iowa Kansas Kentucky Louisiana Maine Maryland Massachusetts Michigan Minnesota Mississippi Missouri Montana Nebraska Nevada New Hampshire New Jersey New Mexico New York North Carolina North Dakota Ohio
53.52% C 60.00% C 52.00%
69.88% B- 70.00% B- 86.00%
68.40% B- 60.00% C 86.00%
62.72% C+ 80.00% B 28.00%
88.10% B+ 100.00% A+ 80.00%
76.32% B 80.00% B 92.00%
69.25% B- 80.00% B NA
73.27% B 90.00% A- 69.70%
73.10% B 70.00% B- 78.00%
74.08% B 80.00% B 86.00%
70.72% B 80.00% B 62.00%
58.52% C 70.00% B- 42.00%
83.80% B+ 90.00% A- 90.00%
74.28% B 90.00% A- 62.00%
77.12% B 80.00% B 74.00%
68.72% B- 60.00% C 88.00%
56.09% C 50.00% C- 64.00%
63.64% C+ 70.00% B- 66.00%
62.02% C+ 80.00% B 36.00%
83.10% B+ 90.00% A- 78.00%
77.50% B 100.00% A+ NA
63.51% C+ 70.00% B- 50.00%
63.28% C+ 60.00% C 68.00%
56.44% C 70.00% B- 52.00%
76.06% B 80.00% B 76.40%
63.65% C+ 80.00% B 52.00%
50.44% C 50.00% C- 58.00%
57.10% C 70.00% B- 42.00%
65.75% C+ 70.00% B- NA
74.25% B 90.00% A- 68.00%
57.80% C 50.00% C- 58.00%
77.50% B 90.00% A- 76.00%
76.64% B 80.00% B 76.00%
59.00% C 70.00% B- 54.00%
State Overall % Overall Grade State % State Grade Counties % Oklahoma Oregon Pennsylvania Rhode Island South Carolina South Dakota Tennessee Texas Utah Vermont Virginia Washington West Virginia Wisconsin Wyoming
69.28% B- 80.00% B 80.00%
73.60% B 80.00% B 76.00%
82.92% B+ 90.00% A- 78.00%
61.25% C+ 70.00% B- NA
62.32% C+ 60.00% C 68.00%
55.75% C 70.00% B- 32.00%
70.00% B 80.00% B 70.00%
81.32% B+ 90.00% A- 74.00%
79.36% B 80.00% B 72.00%
58.18% C 60.00% C- NA
80.64% B+ 80.00% B 86.00%
85.30% B+ 100.00% A+ 76.00%
58.76% C 90.00% A- 40.00%
75.28% B 100.00% A+ 44.00%
63.68% C+ 80.00% B 46.00%
State County
Grade Cities % Cities Grade School % School District Grade Alabama Alaska Arizona Arkansas California Colorado Connecticut Delaware Florida Georgia Hawaii Idaho Illinois Indiana Iowa Kansas Kentucky Louisiana
C 50.00% C- 45.00% D+
B+ 74.00% B 58.00% C
B+ 88.00% B+ 66.00% C+
F 60.00% C 54.00%
C-B 83.10% B+ 75.00% B
A- 68.00% C+ 67.00% C+
NA 74.00% B 43.00% D
B- 48.00% D+ 59.00% C
B 73.10% B 87.00% B+
B+ 64.00% C+ 63.00% C
C+ NA NA 60.00% C
D+ 52.00% C- 53.00%
C-A- 71.50% B 81.00% B
C+ 72.00% B 49.00%
C-B- 82.00% B 76.00%
B-B+ 90.00% A- 64.00% C+
C+ 66.30% C+ 64.00% C+
C+ 68.00% C+ 45.00% D+
State County
Grade Cities % Cities Grade School % School District Grade Maine Maryland Massachusetts Michigan Minnesota Mississippi Missouri Montana Nebraska Nevada New Hampshire New Jersey New Mexico New York North Carolina North Dakota Ohio Oklahoma Oregon Pennsylvania Rhode Island South Carolina South Dakota Tennessee Texas Utah Vermont Virginia Washington West Virginia Wisconsin Wyoming
D- 66.40% C+ 35.20%
D-B 83.10% B 77.00% B
NA 62.00% C+ 48.00% D+
C 63.20% C+ 65.00% C+
C+ 72.00% B 68.00% C+
C 50.00% C- 32.00%
D-B- 72.00% B 77.00% B
C 59.80% C 36.00%
D-C 62.00% C+ 39.00% D
D+ 53.10% C- 43.00% D
NA 74.00% B 49.00%
C-C+ 64.80% C+ 50.00%
C-C 84.00% B+ 63.00% C
B- 73.10% B 54.00%
C-B- 72.00% B 81.00% B
C 64.00% C+ 32.00%
D-B 82.00% B+ 81.00% B
B 58.00% C 45.00% D+
B- 70.00% B- 64.00% C+
B 83.00% B+ 76.00% B
NA 58.00% C 47.00% D+
C+ 70.00% B- 64.00% C+
D- 49.70% C- 48.00% D+
B- 66.00% C+ 51.50%
C-B- 84.00% B+ 69.00%
B-B- 88.00% B+ 86.00% B+
NA 69.70% B- 43.00% D
B+ 82.00% B+ 86.00% B+
B- 76.60% B 68.00% C+
D 28.00% D- 18.00% F
D+ 60.00% C 54.00%
How websites are audited
Sunshine Review evaluated websites accord-ing to our 10-point transparency checklist, which evaluates websites based on items of information provided on government-sponsored websites. (See Table B-1, B-2, and B-3 for definitions of these points.)
Sunshine Review conducts comprehensive annual evaluations of official government web-sites across the nation. These evaluations in-clude the official state website to county and municipal website and also school district websites.
Sunshine Review then conducts audits on the five largest counties and cities and the ten largest school districts. Target locations are determined by the population size for each entity as reported by the 2010 Census. Cur-rently the US has 3,140 counties, over 19,000 municipalities9 and more than 14,000 school
districts.10 Sunshine Review evaluated the five
most populous counties, cities, the capital, and ten largest school districts designated by enrollment in each each state, evaluating one government-sponsored website for each en-tity, ensuring an equal representation in each
state. In total, for this report Sunshine Review examined 50 state websites, 225 county web-sites, 238 city webweb-sites, and 501 school dis-trict websites, a total of 1,014 government websites.
Five states do not use county governance; these including Connecticut, Massachusetts, New Hampshire, Rhode Island, and Vermont. For these exceptions, only the state, cities and school districts grades were evaluated for the overall transparency score.
In thirteen states the capital city is not among the five largest cities. In these instances Sun-shine Review evaluated the five largest cities and the state capital city and determined the average of all six. These states included: Cali-fornia, Florida, Illinois, Kentucky, Maine, Mary-land, Michigan, Missouri, Montana, Nevada, New Jersey, New York, Pennsylvania, South Dakota, Vermont, and Washington.
Other outliers include Hawaii, which has no cities with functioning governments, and in Tennessee where eleven school districts were evaluated due to an upcoming school district merger. Also, Hawaii has only one school dis-trict, the Department of Education.
9 United State Census Bureau, Census of Governments, 2002 10 United States Census Bureau, School Districts, 2010
Sunshine Review conducted its evaluations from January of 2012 to December of 2012, with final evaluations in January of 2013 by associate writers. Upon the completion of each state evaluation, Sunshine Review alerts elected officials to the review and provides them a two-week period to
cor-rect, update information, or dis-cuss concerns about their grade, and we address those issues before the information is released to the media. Media release takes place on a rolling state-by-state basis.
Before publication of the 2013 Transparency Report Card, Sun-shine Review gave elected offi-cials one month to complete further updates, corrections, etc. Over 100 officials responded and these changes were incor-porated in the report.
Calculating grades
Sunshine Review engages in an eight-step process to produce the transparency grades. The first step in the process was developing the 10-point transparency checklist. Three checklists were created for state websites, county websites & city websites, and school district website evaluations (Appendix B).
These criteria resulted from a coordinated ef-fort of over 100 pro-transparency organiza-tions, including the Goldwater Institute, the Lucy Burns Institute, the Sunlight Foundation, Open City, Webitects, and the Journalism De-partment of Columbia College.
Next, Sunshine Review identified the appropriate websites to re-view, and reviewed the entity according to the appropriate checklist. Sunshine Review as-sociate writers audited each website. Grades reflected the number of points on the check-list for which criteria were com-pletely met. When an entity par-tially met the criteria, no point was awarded. A point scale de-termined the letter grade awarded for each fulfilled point. For example, 0-2 qualified for an “F” grade, 3-4 for a “D” grade and so on.
Afterward, Sunshine Review calculated the score for each level of the state’s government by tallying the total points for all the reviewed sites and finding the average. These averages were then compared to the checklist point scale.
Points
Grade
10
A+
9
A-8
B
7
B-6
C
5
C-4
D
3
D-0-2
F
After processing these scores, Sunshine Re-view calculated the overall grade for each state was calculated using a weighted scale. State websites accounted for half of the overall grade due to their size and impact on con-stituents’ lives. County, city, and school district website grades accounted for the other 50 percent of the grade(16 percent each). In cases where states did not use county gov-ernment, cities and schools each accounted for 25 percent of the overall score. The impor-tance of each level of local government for education funding, permits applications, and public health and safety overlapped across city, county and school district levels, and af-fected the weight we gave each entity.
Finally, Sunshine Review publicized grades were publicized to the media in a timely man-ner to ensure state and local government would be held accountable to their perform-ance and encouraged to provide missing items from the transparency checklist.
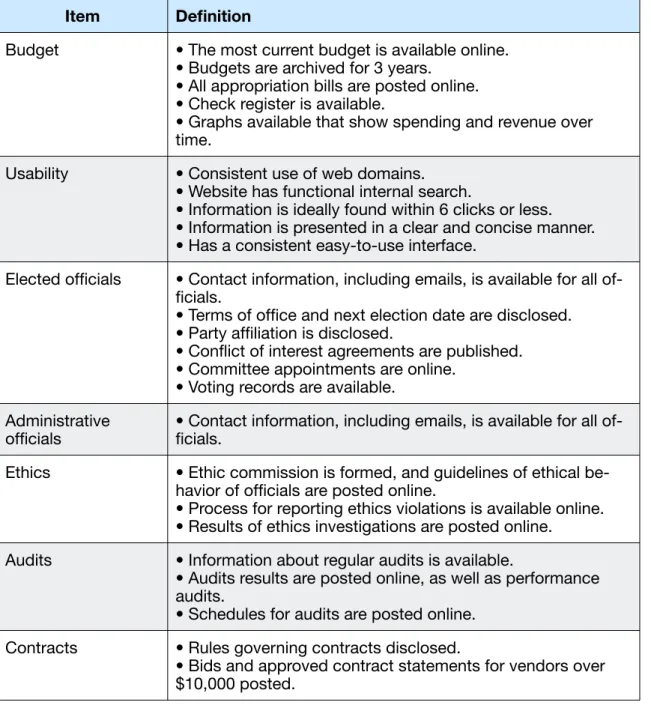
Table C-1: State checklist
Item Definition
Budget • The most current budget is available online.
• Budgets are archived for 3 years. • All appropriation bills are posted online. • Check register is available.
• Graphs available that show spending and revenue over time.
Usability • Consistent use of web domains.
• Website has functional internal search.
• Information is ideally found within 6 clicks or less. • Information is presented in a clear and concise manner. • Has a consistent easy-to-use interface.
Elected officials • Contact information, including emails, is available for all of-ficials.
• Terms of office and next election date are disclosed. • Party affiliation is disclosed.
• Conflict of interest agreements are published. • Committee appointments are online.
• Voting records are available. Administrative
officials • Contact information, including emails, is available for all of-ficials. Ethics • Ethic commission is formed, and guidelines of ethical
be-havior of officials are posted online.
• Process for reporting ethics violations is available online. • Results of ethics investigations are posted online.
Audits • Information about regular audits is available.
• Audits results are posted online, as well as performance audits.
• Schedules for audits are posted online.
Contracts • Rules governing contracts disclosed.
• Bids and approved contract statements for vendors over $10,000 posted.
Appendix C: Checklist
definitions
Table C-2: County and city
checklist
Item Definition
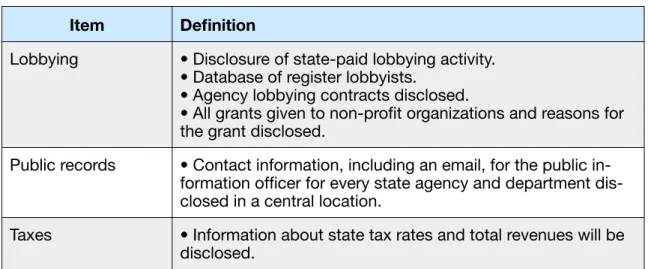
Lobbying • Disclosure of state-paid lobbying activity. • Database of register lobbyists.
• Agency lobbying contracts disclosed.
• All grants given to non-profit organizations and reasons for the grant disclosed.
Public records • Contact information, including an email, for the public in-formation officer for every state agency and department dis-closed in a central location.
Taxes • Information about state tax rates and total revenues will be disclosed.
Item Definition
Budget •Budget for current fiscal year.
•Budgets for the past three years.
Meetings • Meeting minutes and agendas for the current year.
• Archives of meeting minutes and agendas for three years. • A meeting calendar that discloses the time and location of public meetings.
Elected officials • Contact information, including emails, is available for all of-ficials.
• Terms of office and next election date are disclosed. Administrative
officials • Contact information, including emails, is available for all of-ficials. Permits, zoning • Zoning ordinances are disclosed.
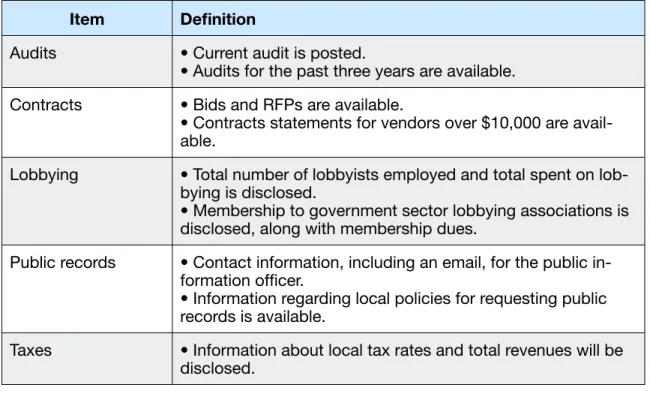
Table C-3: School district
checklist
Item Definition
Audits • Current audit is posted.
• Audits for the past three years are available.
Contracts • Bids and RFPs are available.
• Contracts statements for vendors over $10,000 are avail-able.
Lobbying • Total number of lobbyists employed and total spent on lob-bying is disclosed.
• Membership to government sector lobbying associations is disclosed, along with membership dues.
Public records • Contact information, including an email, for the public in-formation officer.
• Information regarding local policies for requesting public records is available.
Taxes • Information about local tax rates and total revenues will be disclosed.
Item Definition
Taxes • District discloses federal, state, and local tax revenues that fund the school.
Budgets • Current budget is posted.
• Budget for past three years are available.
Meetings • Meeting minutes and agendas for the current year.
• Archives of meeting minutes and agendas for three years. • A meeting calendar that discloses the time and location of public meetings.
Item Definition
Elected officials • Contact information, including emails, is available for all of-ficials.
• Terms of office and next election date are disclosed. Administrative
officials • Contact information, including emails, is available for all of-ficials.
Contracts • Bids and RFPs are available.
• Approved vendor contract statements for $10,000 and above are disclosed.
• Labor agreements are disclosed and/or pay scales.
Audits • Current audit is posted.
• Audits for the past three years are available.
Public records • Contact information, including an email, for the public in-formation officer.
• Information regarding local policies for requesting public records is available.
Background checks • Guidelines for conducting criminal background checks for staffs is published online.
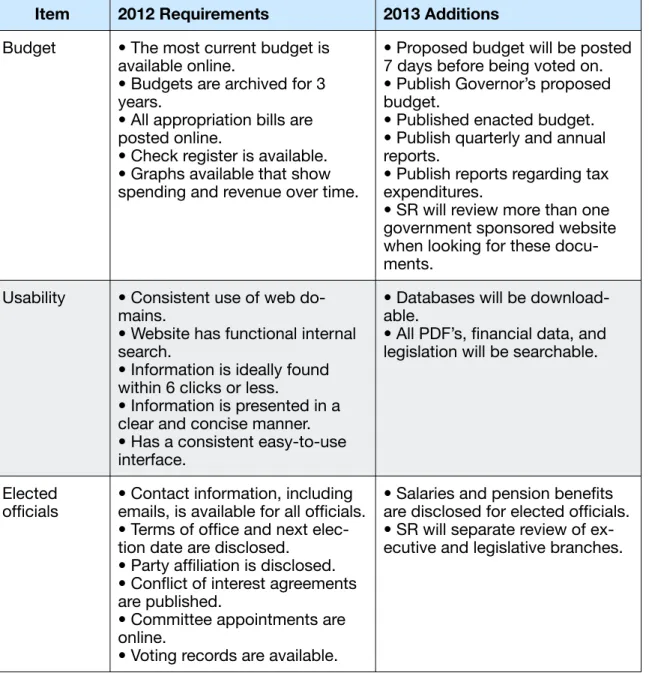
Table D-1: 2012 v. 2013 State
Transparency checklist
comparison
Appendix D: 2013 Checklist
changes
Item 2012 Requirements 2013 Additions
Budget • The most current budget is available online.
• Budgets are archived for 3 years.
• All appropriation bills are posted online.
• Check register is available. • Graphs available that show spending and revenue over time.
• Proposed budget will be posted 7 days before being voted on. • Publish Governor’s proposed budget.
• Published enacted budget. • Publish quarterly and annual reports.
• Publish reports regarding tax expenditures.
• SR will review more than one government sponsored website when looking for these docu-ments.
Usability • Consistent use of web do-mains.
• Website has functional internal search.
• Information is ideally found within 6 clicks or less.
• Information is presented in a clear and concise manner. • Has a consistent easy-to-use interface.
• Databases will be download-able.
• All PDF’s, financial data, and legislation will be searchable.
Elected
officials • Contact information, including emails, is available for all officials. • Terms of office and next elec-tion date are disclosed.
• Party affiliation is disclosed. • Conflict of interest agreements are published.
• Committee appointments are online.
• Voting records are available.
• Salaries and pension benefits are disclosed for elected officials. • SR will separate review of ex-ecutive and legislative branches.
Item 2012 Requirements 2013 Additions
Administra-tive
officials
• Contact information, including
emails, is available for all officials. • Will be replaced by Executive and Legislative reviews.
Ethics • Ethic commission is formed,
and guidelines of ethical behavior of officials is online.
• Process for reporting ethics vio-lations is available online.
• Results of ethics investigations are posted online.
• None.
Audits • Information about regular audits is available.
• Audits results are posted online, as well as performance audits. • Schedules for audits are posted online.
• None.
Contracts • Rules governing contracts dis-closed.
• Bids and approved contract statements for vendors over $10,000 posted.
• Complete statements for awarded contracts must be dis-closed.
Lobbying • Disclosure of state-paid lobby-ing activity.
• Database of register lobbyists. • Agency lobbying contracts dis-closed.
• All grants given to non-profit organizations and reasons for the grant disclosed.
• Executive and Legislative lob-bying recorded.
• Lobbying databases will specify lobbyist, company, client, agency being lobbied, and purpose of lobbying.
Item 2012 Requirements 2013 Additions
Public
records • Contact information, including an email, for the public informa-tion officer for every state agency and department disclosed in a central location.
• Citizens will be able to request public records online, either by email or a submission form. • Information regarding public information violations and how to pursue them is disclosed.
• Executive sessions and appro-priation meetings will be broad-cast online or archived.
• At least 24 hours of notice is given prior to a public meeting. • Annual compliance surveys will be posted online that measure the number of public record re-quests submitted, number ful-filled, average time for compli-ance, and reasons for denials. Taxes • Information about state tax
rates and total revenues will be disclosed.
• This section will be replaced by “Total compensation”, requiring each department list the cost of salaries and benefits.