Factors Influencing Hyperuricemia:
Evidence from Sukoharjo, Central Java, Indonesia
Dewi Wulandari
Graduate Program in Nursing, School of Health Sciences Mitra Husada, Karanganyar ABSTRACT
Background: Hyperuricemia is an elevated serum uric acid level. It causes urate deposits in the joints, tendons, and other tissues as physiological prerequisites for gout. Hyperuricemia is also related to the existence and severity of several comorbidities, such as hypertension, cardiovascular disease, diabetes, and metabolic syndrome. The result of basic health research in 2018 showed that the prevalence of joint disease in Indonesia based on a doctor's diagnosis was 7.3%. The highest prevalence was in Aceh (13.3%). The lowest prevalence was in West Sulawesi (3.2%). This study aimed to examine factors associated with hyperuricemia.
Subjects and Method: This was an analytical observational study with a case control design. The study was conducted in Sukoharjo, Central Java, from January to April, 2018. A sample of 90 study subjects was selected by consecutive sampling. The dependent variable was hyperuricemia. The independent variables were age, sex, stress, purine-rich foods intake, and family history of gout. Stress was measured by depression, anxiety, and stress scale (DASS 42). The other variables were collected by questionnaire. The data were analyzed by a multiple logistic regression.
Results: Older age (OR= 13.80; 95% CI= 3.36 to 56.66; p<0.001), female (OR= 1.94; 95% CI= 3.36 to 7.62; p= 0.345), purine-rich foods intake (OR= 5.01; 95% CI= 1.48 to 16.97; p= 0.010), and stress (OR= 6.14; 95% CI= 1.83 to 20.60; p= 0.003) increased the risk of hyperuricemia. Family history of gout (OR= 1.47; 95% CI= 0.43 to 5.04; p= 0.537) increased the risk of hyperuricemia, but it was statistically non-significant.
Conclusion: Age, female, purine-rich foods intake, and stress increase the risk of hyperuricemia. Family history of gout increases the risk of hyperuricemia, but it was statistically non-significant.
Keywords: hyperuricemia, purine-rich food, stress
Correspondence:
Dewi Wulandari. School of Health Sciences Mitra Husada. Jl. Ahmad Yani 167, Gapura Papahan Indah, Papahan, Tasikmadu, Karanganyar 57722, Central Java. Email: [email protected]. Mobile: 089695098491.
BACKGROUND
Uric acid is the final product of purine metabolism in humans. The normal refe-rence of uric acid in human blood is 1.5-6 mg/dL in women and 2.5 -7 mg/dL in men (Wardhana, 2018). Hyperuricemia is de-fined as an elevated serum uric acid level which. It causes urate deposits in the joints, tendons, and other tissues as physiological prerequisites for gout. Hyperuricemia is also associated with the existence and seve-rity of several co-morbidities, such as hy-pertension, cardiovascular disease,
diabe-tes, dyslipidemia, chronic kidney disease, atrial fibrillation, and metabolic syndrome (Ichida et al., 2012; Maruhashi et al., 2018). Hyperuricemia can occur due to increased uric acid metabolism (over production), de-creased uric acid excretion (under excre-tion), or a combination of them (Kurniari, 2011)
years and above experienced hyperuri-cemia. Compared to developed countries, the prevalence of hyperuricemia tends to be lower in developing countries. For example, the prevalence of hyperuricemia was 10.6% in Thailand and 8.4% in Saudi Arabia (Song et al., 2018). A recent meta-analysis of 36 articles from 2000 to 2014 showed that the prevalence of hyperuricemia in Mainland China was 13.3%, while in Tibet China reached 37.2% (Zhang et al., 2018).
The prevalence of hyperuricemia in Indonesia is still unclear. The prevalence of hyperuricemia in residents of Central Java was 24.3% in men and 11.7% in women. Based on a preliminary study of hyperuri-cemia in Sembiran Village, Bali Province, the prevalence of hyperuricemia was 18.9%. Meanwhile, based on a field study, the pre-valence of hyperuricemia in residents of Denpasar city was 18.2%. In addition, the prevalence of hyperuricemia in residents of Nusa Ceningan, Nusa Penida District, was 17%. Based on a study conducted in rural tourism areas in Ubud District, the preva-lence of hyperuricemia was 12% (Kurniari, 2011).
Based on the result of the Basic Health Research (Ministry of Health RI, 2018), the prevalence of joint disease in Indonesia, based on a doctor's diagnosis was 7.3%. The highest prevalence was in Aceh (13.3%) and the lowest was in West Sulawesi (3.2%). The prevalence of joint disease at the age of 15-24 years was 1.2%; 25-34 years was 3.1%; 35-44 years was 6.3%; 45-54 years was 11.1%; 55-64 years was 15.5%; 65-74 years was 18.6%; and 75 years and above was 18.9%. The prevalence of joint disease in women was 8.5%; in men was 6.1%; in urban residents was 6.9% and in rural residents was 7.8%. The highest prevalence occurred in farmers, which was 9.90.
Hyperuricemia is affected by several factors, including sex, BMI (Body Mass Index), purine intake, and carbohydrate intake (Setyoningsih, 2009). Factors asso-ciated to the suspected occurrence of hyper-uricemia are family history, obesity, fruc-tose intake, purine intake, and fluid intake (Khoirina, 2016). Based on a study con-ducted by Diantari in 2012, purine intake affects uric acid level; however, fluid did not affect uric acid level in women aged 50-60 years.
Based on a study conducted in Tibet, China, the characteristics associated with hyperuricemia were farmer (OR= 1.75; 95% CI= 1.02 to 2.99), low education level (OR= 1.57, 95% CI= 1.10 to 2.24), alcohol con-sumption (OR= 1.80; 95% CI= 1.19 to 2.70), hypertension (OR= 1.48; 95% CI= 1.09 to 2.01), BMI (OR= 1.12; 95% CI= 1.08 to 1.16) and serum creatinine (OR= 1.05; 95% CI= 1.03 to 1.06) (Zhang et al., 2018).
This study aimed to analyze the factors influencing hyperuricemia.
SUBJECTS AND METHOD 1. Study Design
This was an observational analytic study with a case control design. The study was conducted in Sukoharjo, Central Java, from January to April 2018.
2.Study Sample
A sample of 90 study subjects was selected for this study by consecutive sampling.
3.Study Variables
The dependent variable was hyperuricemia. The independent variables were age, sex,
family history of gout, stress, and purine-rich foods intake.
4.Study Instrument
Data on stress was measured by Depress-ion, Anxiety, and Stress Scale (DASS 42) questionnaire. Purine level was measured by uric acid meter.
5.Data analysis
This study was analyzed using univariate, bivariate, and a multiple logistic regression.
RESULTS 1. Sample characteristics
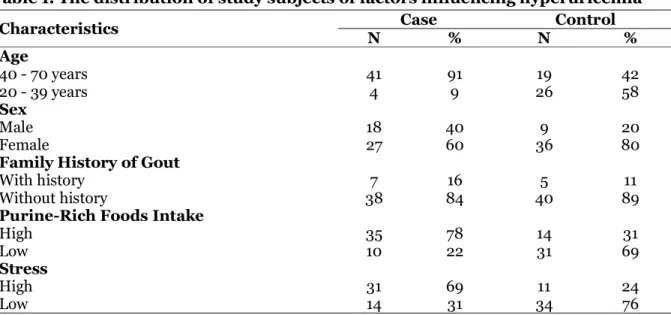
The characteristics of the study subjects can be seen in Table 1.
Table 1. The distribution of study subjects of factors influencing hyperuricemia
Characteristics N Case % N Control %
Age
40 - 70 years 41 91 19 42
20 - 39 years 4 9 26 58
Sex
Male 18 40 9 20
Female 27 60 36 80
Family History of Gout
With history 7 16 5 11
Without history 38 84 40 89
Purine-Rich Foods Intake
High 35 78 14 31
Low 10 22 31 69
Stress
High 31 69 11 24
Low 14 31 34 76
Based on the characteristics of the study subjects, the majority of subjects in the case group (91%) were 40-70 years of age, while in the control group (58%) were 20-39 years of age. The majority of subjects were female (60% in the case group and 80% in the control group). Only a small number of subjects had family history of gout (16% in the case group and 11% in the control group).
Most of the subjects in the case group (78%) consumed purine-rich foods with high intensity. Meanwhile, most of the
sub-jects in the control group (69%) consumed purine-rich foods with low intensity. Most of the subjects in the case group (69%) had high stress level. In addition, most of the subjects in the control group (76%) had low stress level.
2. Bivariate Analysis
<0.001), and female (OR= 2.67; 95% CI= 1.04 to 6.85; p= 0.041).
Table 2. The result of the bivariate analysis of factors influencing hyperuricemia
Independent Variables OR 95% CI p
Lower limit Upper limit
Age 14.03 4.29 45.87 <0.001
Sex (female) 2.67 1.04 6.85 0.041
Family History of Gout 1.47 0.43 5.04 0.537 Purine-rich foods intake 7.75 3.01 19.93 <0.001
Stress 6.84 2.71 17.31 <0.001
3. Multivariate Analysis
Table 3. The results of the multivariate analysis
Independent Variables OR 95% CI p
Lower limit Upper limit
Age 13.80 3.36 56.66 <0.001
Sex (female) 1.94 0.49 7.62 0.345
Purine-Rich Foods Intake 5.01 1.48 16.97 0.010
Stress 6.14 1.83 20.60 0.003
Table 3 showed the results of multivariate analysis. Table 3 showed that older age (OR= 13.80; 95% CI= 3.36 to 56.66; p <0.001), female (OR= 1.94; 95% CI= 3.36 to 7.62; p= 0.345), purine-rich foods intake (OR= 5.01; 95% CI= 1.48 to 16.97; p= 0.010), and stress (OR= 6.14; 95% CI= 1.83 to 20.60; p= 0.003) increased the risk of hyperuricemia. Family history of gout (OR= 1.47; 95% CI= 0.43 to 5.04; p= 0.537) increased the risk of hyperuricemia, but it was statistically non-significant.
DISCUSSION
1. The influence of age on hyperuri-cemia
This study showed that age factor influ-enced hyperuricemia (OR = 13.80; 95% CI= 3.36 to 56.66; p<0.001). People aged 40 years and above had higher risk for having hyperuricemia. This probably occurred because there was a decline in kidney func-tion at the age of 40 years and above in the process of excretion of metabolic waste in the body. It was characterized by high levels
of urea and creatinine. Other factors that cause uric acid level increases at <40 years of age are obesity, high blood pressure, abnormal blood cholesterol level, and men who are in the severity level of alcohol dependence (Choi et al., 2005). Based on the age spectrum, the risk factor of hyper-uricemia in young adults (30-39 years) is hyperlipidemia; meanwhile, lifestyle and some clinical syndromes play an important role in the middle-aged people (40-59 yrs). Different risk factors between sexes in the middle age are the effects of alcohol con-sumption in men and the effects of meno-pause in women. Impaired kidney function and the use of diuretics are important factors in the elderly (≥60 years) (Lin and Chou, 2000).
(r= 0.17), fasting blood sugar (r= 0.13), and the occurrence of hypertension, CVD and diabetes (p<0.001). Other studies show that subjects with hyperuricemia have older age, BMI, SBP, DBP, TG, and FPG in men and women (Zheng et al., 2018).
Based on a study conducted by Setyo-ningsih (2009), age has a positive correla-tion with gout (r= 0.85; p<0.001). It means that the strength of correlation is moderate. The result of the linear regression analysis showed that each increase in 1 age score would increase 0.068 score of uric acid (b= 0.104; p <0.001).
2.The influence of sex on hyper-uricemia
Based on the result of this study, men had higher risk for having hyperuricemia (OR= 1.94; 95% CI= 3.36 to 7.62; p= 0.345). The uric acid level in men in the blood at puber-ty can reach 5.2 mg/dl. It will increase with age because there is no estrogen hormone as uricosuric agent. It is a chemical that assists the excretion of uric acid through the kidney. The mechanism of uricosuric agent in uric acid excretion is to inhibit URAT1 (urate transporter-1) from the lumen to the proximal tubular cells when regulating electrolyte fluid balance (Setyoningsih, 2009).
The result of this study is in line with a study conducted by Billa et al. (2018), that there is a statistically significant correlation between sexes (male vs. female; p <0.0001) and different age categories (<30 years vs. 31-50 years); p = 0.02; 31-50 years vs.> 50 years; p <0.0001; ≤ 30 years and> 50 years; p <0.0001; chi square test). It is related to the prevalence of HU in the overall popu-lation. A study conducted by Zhang et al. (2018), showed that the prevalence of hyperuricemia in men is higher than in women (41% vs. 34.4%, p= 0.011).
3.The influence of family history of gout on hyperuricemia
This study showed that family history of gout increased the risk of hyperuricemia (OR= 1.47; 95% CI= 0.43 to 5.04; p= 0.537). A study conducted by Kuo et al. (2015), states that the main risk factors of gout are hyperuricemia, genetics, dietary factors, drugs, comorbidities, and lead exposure.
Impaired uric acid excretion by the kidney is one of the causes of increased level of uric acid, hyperuricemia, and nephro-pathy. The kidney filters free circulating uric acid. It filters around 70% of the total uric acid excretion from the body. Based on a study conducted by Chittoor et al. (2017), all kidney urinary excretions were significantly inherited (p <2 × 10⁻⁶). Its range was from 0.41 to 0.74. The empirical threshold value for genome area significance was set at p <1 × 10⁻⁷. There was a strong correlation (p <8 × 10⁻⁸) between uric acid excretion and single nucleotide polymorphism (SNP) in the 446 zinc finger protein (ZNF446) (rs20-33711 (A / G), MAF: 0.30). Minor alleles (G) were associated with increased uric acid clearance. The study also found a suggestive correlation between gout clearance and SNP in ZNF324, ZNF584, and ZNF132 (in the 72 kb area on 19q13; p <1 × 10⁻⁶, MAFs: 0.28-0.31). This study showed the importance of the 19q13 area in regulation of uric acid excretion by the kidney in Hispanic children.
4.The influence of stress on hyper-uricemia
nervous system (e.g. heart rate and blood pressure). Even though a greater acute autonomic response has been found in adult men, but women has showed increa-sed sensitivity to the higher adrenal cortex (Murphy and Loria, 2017).
Gout is associated with mental health, but its nervous mechanism is still unclear (Goodman et al., 2016). Cortisol hormone production increase when stress occurs. Therefore, the metabolism of carbo-hydrates, fats, proteins, and purines also increases. Increased purine metabolism causes an increase in uric acid level in the blood. A study by Bobaya (2016), there is a correlation between stress and gout arthri-tis in Tobelo Community Health Center, Tobelo District, North Halmahera.
5.The influence of purine-rich foods intake on hyperuricemia
This study showed that purine-rich foods intake could increase the risk of hyperuri-cemia (OR= 5.01; 95% CI= 1.48 to 16.97; p= 0.010). Some purine-rich foods such as liver, intestine, red meat, sardines are often consumed by subjects in the case group. Besides, foods with low purine such as tofu, tempeh, and long beans are more often consumed by subjects in the control group. The content and bioavailability of purines in food ingredients varies. Besides, the change of purines to uric acid also depends on the relative cellularity and the trans-cription and cellular metabolic activity of the food. Transcription activity is the ability of cells to interpret the genetic code of one type of nucleic acid into another form. In this case, cells are able to convert purines in food into uric acid. Purines derived from animal source foods have high level of bioavailability. Besides, the amount of ani-mal source foods is also high. Most of exo-genous purines, which are derived from food, will be directly converted to uric acid without the occurrence of tissue nucleic
acids. However, guanine, hypoxanthine, and exogenous xanthine which do not combine into nucleic acids will rupture and form uric acid with the guanase enzymes assistance and oxidant xanthine in the intestinal epithelium (Choi and Curhan, 2004).
A study by Kusumayanti et al. (2015), the patterns of purine consumption and obesity had significant differences. The sequence of risk factors of hyperuricemia was obesity (OR = 2.32; 95% CI: 1.13-4.75); frequency of rich-purine foods consumption (OR= 2.16; 95% CI: 1.06 to 4.00); level of purine consumption (OR= 2.14; 95% CI= 1.02 to 4.48); and types of rich-purine foods consumed (OR = 2.12; 95% CI= 1.05 to 4.28).
A study conducted by Setyoningsih in 2009, variable of high-purine diet had a positive correlation on uric acid levels (r= 0.82; p<0.001). The result of linear regress-ion analysis showed that each increase in 1 high-purine diet score would increase 0.264 scores of uric acid (95% CI= 0.14 to 0.39; p <0.001).
6.The influence of age, sex, high purine food intake, and stress on hyperuricemia
The effect of age between men and women on hyperuricemia is different. At the pro-ductive age, men have a higher risk of hyperuricemia than women. After meno-pause, women have a higher risk of hyper-uricemia than men (Song et al., 2018). This is likely related to the loss of uricosuric estrogen after menopause (Kuo et al., 2015). In other words, the difference in the preva-lence of hyperuricemia in both sexes seems to be narrow as getting older. However, hyperuricemia is still a male-dominated disease as shown in several studies.
AUTHOR CONTRIBUTIONS
sex, stress, family history of gout, and uri-cemia level, did the data analysis, inter-preted the results of data analysis, and wrote the manuscript.
CONFLICT OF INTEREST
We declare that we do not have any conflict of interest.
FUNDING AND SPONSORSHIP
There is no external fund and sponsorship.
ACKNOWLEDGEMENT
We would like to thank to the Sukoharjo District Health Office, for giving permission to collect the data to this study.
REFERENCE
Billa G, Dargad R, Mehta A (2018). Original article prevalence of hyperuricemia in indian subjects attending hyperuri-cemia screening programs-A Retro-spective Study. 66(4): 43–46.
Bobaya P (2016). Hubungan tingkat stres dengan kejadian gout artritis di pus-kesmas Tobelo Kecamatan Tobelo Kabupaten Halmahera Utara. E-jur-nal Keperawatan, 4(1).
Chittoor G, Haack K, Mehta NR, Laston S, Cole SA, Comuzzie AG, Butte NF, Vo-ruganti VS (2017). Genetic variation underlying renal uric acid excretion in Hispanic children: The viva la familia study. BMC Medical Genetics. BMC Medical Genetics, 18(6): 1–8. doi: 10.1186/s12881-016-0366-3.
Choi HK, Curhan G (2004). Beer, liquor, and wine consumption and serum uric acid level: The Third national health. Arthritis & Rheumatism (Ar-thritis Care & Research), 51(6): 1023– 1029. doi: 10.1002/art.20821.
Choi HK, Liu S, Curhan G (2005). Intake of purine-rich foods, protein, and dairy
products and relationship to serum levels of uric acid the Third National Health and Nutrition Examination Survey. Arthritis & Rheumatism, 52(1): 283–289. doi: 10.1002/art.20-761.
Diantari E (2012). Pengaruh asupan purin dan cairan terhadap kadar asam urat pada wanita usia 50-60 Tahun di Kecamatan Gajah Mungkur, Sema-rang. Program Studi Ilmu Gizi Fakul-tas Kedokteran UniversiFakul-tas Dipone-goro. doi: 10.1016/S1387-2656(00)-05035-3.
Ichida K, Matsuo H, Takada T, Nakayama A, Murakami K, Shimizu T, Yamana-shi T, Kasuga H (2012). Decreased extrarenal urate excretion is a com-mon cause of hyperuricemia. Nature Communications. Nature Publishing Group. 3: 764–767. doi: 10.1038/n-comms1756.
Kapetanovic MC, Nilsson PM, Turesson C, Dalbeth N, Englund M, Scheepers LEJM, Jacobsson LTH (2018). Pre-dictors for clinically diagnosed gout: 30 years’ follow-up in the Malmo Pre-ventive Project cohort Sweden. Scan-dinavian Journal of Rheumatology. Arthritis Research & Therapy, 47-(129): 25–26. doi: http://dx.doi.org/-10.1080/03009742.2018.1487639. Kementrian kesehatan RI (2018). Hasil
utama riskesdas 2018.
Khoirina A (2016). Faktor-faktor yang ber-hubungan dengan kejadian terduga hiperurisemia pada pralansia di Pos Pembinaan Terpadu (Posbindu) wila-yah kerja puskesmas pamulang Tahun 2016. UIN Syarif Hidayatullah Ja-karta: Fakultas Kedokteran dan Ilmu Kesehatan. Available at: http://repo- sitory.uinjkt.ac.id/dspace/handle/12-3456789/37218 .
gout: Prevalence, incidence, and risk factors. Nature Reviews Rheumato-logy. 11: 649–662.
Kurniari PK (2011). Hubungan hiperurise-mia dan fraction uric acid clearance. Jurnal penyakit dalam, 12: 77–80. Available at: http://download.portal-garuda.org/article.php?article=13227 &val=927.
Kusumayanti GAD, Wiardani NK, Antarini AAN (2015). Pola konsumsi purin dan kegemukan sebagai faktor risiko hiperurisemia pada masyarakat Kota Denpasar. Jurnal Skala Husada, 12(1): 27–31.
Lin K, Lin H, Chou P (2000). The inter-action between uric acid level and other risk factors on the development of gout among asymptomatic hyper-uricemic men in a prospective study. The Journal of Rheumatology, 27(6): 1501–1505.
M.Goodman A, Wheelock MD, Harnett NG, Mrug S, Granger DA, Knight DC (2016). The hippocampal response to psychosocial stress varies with sali-vary uric acid level. Neuroscience, 339: 396–401.
Maruhashi T, Hisatome I, Kihara Y, Higa-shi Y (2018). Hyperuricemia and en-dothelial function: From molecular background to clinical perspectives. Atherosclerosis. Elsevier, 278: 226– 231. doi: 10.1016/j.atherosclerosis.20-18.10.007.
Murphy MO, Loria AS (2017). Sex-specific effects of stress on metabolic and cardiovascular disease: are women at higher risk?. Am J Physiol Regul In-tegr Comp Physiol 313: 1–9. doi: 10.-1152/ajpregu.00185.2016.
Picard M, McManus MJ, Gray JD, Nasca C, Moffat C, Kopinski PK, Seifert EL, McEwen BS, Wallace DC (2015). Mi-tochondrial functions modulate neu-roendocrine, metabolic, inflammato-ry, and transcriptional responses to acute psychological stress. PNAS. 112 (48) E6614-E6623. doi: 10.1073/pn-as.1515733112.
Setyoningsih R (2009). Kejadian hiperuri-semia pada pasien rawat jalan RSUP Dr. Kariadi Semarang Program Studi S1 Ilmu Gizi Fakultas Kedokteran Universitas Diponegoro.
Song P, Wang H, Xia W, Chang X, Wang M, An L (2018). Prevalence and correla-tes of hyperuricemia in the middle-aged and older adults in China. Sci-entific Reports. Springer US, 8(1): 1– 9. doi: 10.1038/s41598-018-22570-9. Wardhana AR (2018). Effect of uric acid on
blood glucose levels. Acta Med Indo-nes - IndoIndo-nes J Intern Med, 50(3): 253–256.
Zhang X, Meng Q, Feng J, Liao H, Shi R, Shi D, Renqian L, Langtai Z, Diao Y, Chen X (2018). The prevalence of hyperuricemia and its correlates in Ganzi Tibetan Autonomous Prefec-ture, Sichuan Province, China. Lipids in health and disease. 17(1): 235. doi: 10.1186/s12944-018-0882-6.