THE Ca, K and Mg RATIO IN SOIL AND VINES UNDER EFECTS OF
FERTILIZATION WITH DIFFERENT POTASSIUM FERTILIZER DOSES
Raportul Ca, K şi Mg în sol şi viţă de vie sub efecte de fertilizare cu doze diferite
de potasiu îngrăşămănt
Ličina, V. (1), Marković, N. (1), Trajković, I. (1), Atanacković, Z. (1)
(1) Belgrade University, Faculty of Agriculture, Nemanjina 6, 11080 Belgrade, Serbia, e-mail: [email protected]
The investigation was carried out in the vineyards of “Radmilovac” on the Faculty of Agriculture experimental station, with cv. Sauvignon blanc grafted to the rootstock Berlandieri x Riparia Kober 5BB. The aim of this research was to determine the effects of potassium fertilizer application on the Ca:Mg and K:Mg ratio in soil and vines organs. In this experiment the following treatments were used: control (without fertilization) and treatments with 50, 100 and 150 kg K2O/ha 50% KCl potassium fertilizer. The soil type was eutric cambisol. Treated soil was subjected to the detail agrochemical soil analysis, while the soil samples was collected from the depth of 0-30, 30-60, 60-90 and 90-120 cm. Leaves for analysis were collected in august and shoots after pruning. Potassium and magnesium analysis has been by AAS. The level of available potassium was (11,95-14,15 mg/100g of soil), magnesium (20,2-23,7 mg/100 g of soil) and calcium (354-464 mg/100 g of soil). During the first year, Ca:Mg ratio was 5,8-14,4:1, in the second year 5,4-18,5:1 and at third year 4,9-25,2:1. The K:Mg ratio ranged from 0,08-0,21:1 in the first, 0,13-0,29:1 in the second and 0,11-0,21:1 in the third year of study. The Ca:Mg and K:Mg ratio were mostly influenced by 100 and 150 kg K2O/ha potassium doses. The K:Mg ratio in the leaves and shoots did not change under influence of different potassium fertilizer doses, so that the antagonism between these two elements was not manifested.
Key words: potassium fertilizer, Ca, Mg, K
Cercetare a fost realizată în podgoriile de "Radmilovac", la Facultatea de Agricultură staţie experimentală, cu cv. Sauvignon blanc altoit la portaltoi Berlandieri x Riparia Kober 5BB. Scopul acestui studiu a fost de a determina efectele aplicării îngrăşămintelor pe potasiu Ca:Mg si K:Mg raportul în sol şi organe viţă de vie. În acest experiment tratamente au fost utilizate următoarele: de control (fără fertilizare) si tratamente cu 50, 100 şi 150 kg K2O/ha de potasiu îngrăşăminte 50% KCl. Tipul de sola fost cambisol eutric. Sol trataţi a fost supus analizei solului detaliu agrochimice, în timp ce probele de sol au fost colectate de la adâncimea de 0-30, 30-60, 60-90 şi 90-120 cm. Frunze de analiză au fost colectate în august şi lăstarii după tăiere. Analiza potasiu şi magneziu a fost facute cu AAS. Nivelul de potasiu a fost disponibil (11,95-14,15 mg/100 g de sol), magneziu (20,2-23,7 mg/100 g de sol) şi de calciu (354-464 mg/100 g de sol). Pe parcursul primului an, Ca:Mg raportul a fost 5,8-14,4:1, în al doilea an 5,4-18,5:1 şi la treilea an 4,9-25,2:1. K:Mg raportul au variat de la 0,08-0,21:1 în primul an 0,13-0,29:1, în al doilea 0,11-0,21:1 şi în al treilea an de studiu. Ca:Mg şi K:Mg raportului au fost în mare parte influenţate de 100 şi 150 kg K2O/ha doze de potasiu. K:Mg raportului în frunzele şi lăstarii nu a schimbat sub influenţa unor doze diferite de potasiu îngrăşăminte, astfel că antagonismul dintre aceste două elemente nu sa manifestat.
Cuvinte cheie: îngrăşăminte potasiu, Ca, Mg, K
Balanced nutrition and fertilization are essential components of the growing technology in vineyards in terms of achieving the required yields and quality of grapes. Potassium fertilizers are soluble in water, act now and quickly adsorbed by plants. In the vineyard practice, recommendation is to use liquid potassium fertilizers in the planting and in the regular production of grapes, especially if it is known the yield of 1000 kg present 10 kg of pure potassium (Nakalamić et al., 2009). Potassium is one of the most mobile elements in plant organs. Unlike nitrogen and phosphorus that are accumulate in reproductive organs, potassium is acumulate in vegetative, such as roots, shoots and leaves (0,2 to 2%). Intensive potassium fertilization and it is increasing adsorption may condition the distortion K:Mg ratio in plant organs. Until this phenomenon usually occurs on soils rich with Mg, where due the increased of K content in soil increases K+ competition with a lot less frequent Mg+2 in the soil solution (Ličina, 2009). The presence of Ca in the soil is important to establish a relationship between certain cations in the soil, which is expressed through mutual ratio between Ca:Mg, Mg:K and Ca:K. This quotient is used as an indicator of plant nutritional level of these elements, especially if it is known that Ca and Mg treat antagonistically in the soil (McLean et al., 1983). Ca:Mg ratio usually varies from 2:1 to 10:1 while the ideal ratio is 4:1 (Conradie, 1994). Garcia et al. (1999) found that an increased content of Ca in the soil causes an increase content of K in petioles and leaf blades, and total acid content in the wine on grapes grown on acidic soils. Ličina et al. (1997) indicate that the high content of potassium in the soil does not be a parameter for the high potassium content in the grapes leaves. This is considered a result of potassium redistribution inside the leaves and other organs (root and stem), where potassium take the other metabolic role. Despite the expressed Mg mobility, because of its deficit or impaired of K:Mg ratio comes to the appearance of necrosis of grape organs and berries (Hlušek et al., 2002). Gluhić et al. (2009) and Zatloukalova et al. (2011) by research are found that the higher Mg content in the grapes organs carry out to distortion of the ideal K:Mg ratio as well as an increase content of K in the organs and a decrease in of Ca content.
MATERIALS AND METHODS
The experiment were carried out in the vineyard of Demonstration Field “Radmilovac” at Faculty of Agriculture in Belgrade on cv. Sauvignon blanc, which was grafted to the rootstock Berlandieri x Riparia Kober 5BB. The vineyard is located on the slope of southern exposure. The lines extending in the direction east-southeast. The line spacing is 3 m and the distance between vines in the row is 1m. Training system is double asymmetric cordon (Nakalamić, 1991). The experiment was set up according to the block system with 18 vines arranged in three replications with 6 vines. Immediately before of fertilizers application it is done a detailed agrochemical soil analysis. For the analysis soil is sampled to a depth of 0-30, 30-60, 60-90 and 90-120 cm with the opening of the two profiles between the lines within each treatment. In the experiment was used 50% of KCl in the following doses: 50, 100, 150 kg K2O/ha and control (without fertilization). With
potassium also is added nitrogen (30 kg/ha) and phosphorus (50 kg P2O5/ha). Nitrogen
was added in the form of KAN, and phosphorus in the form of triple superphosphate. Leaves for analysis were sampled in August with all the vines in the treatment from the lower, middle and upper shoots. Shoots were sampled after vine cutting within treatment experiment. The data in this paper represent averages of repetitions for each treatment trial. Exchangeable potassium in the soil is determined by the Al-method according to Egner-Riehm, and in leaves and shoots of the wet method of destruction with nitric acid after which the extract was determined by flame photometry (Džamić et al., 1996). Ca and Mg determination in soil and plant material was carried out using AAS.
Before applying the appropriate fertilizer dose by treatments was done detailed agrochemical analysis of soil. For the soil analysis samples was collected from four depths (0-30, 30-60, 60-90 and 90-120 cm), as shown in table 1.
Table 1 Agrochemical properties of the test plots before fertilization with K fertilizers
Depth (cm)
pH Humus N NH4 NO3 P2O5 K2O Ca Mg
H2O nKCL % % mg/kg mg/kg
mg/100 g
mg/100 g
mg/100 g
mg/100 g
0-30 7,4 6,5 3,30 0,21 10,5 3,50 15,0 11,95 464 23,2
30-60 7,4 6,5 2,11 0,19 10,5 5,25 8,7 14,15 404 20,2
60-90 6,7 5,4 1,88 0,16 10,0 5,25 7,8 12,75 354 22,1
90-120 6,9 5,7 1,64 0,16 12,1 7,00 8,7 12,25 399 23,7
The results indicate that soil was neutral pH reaction, whose acidity slightly increases with depth. The surface layer of soil pH is 7,4 in H2O, and the mild acidity (pH
6,7-6,9 in H2O), represented in layers to a depth of 60-90 cm and 90-120 cm. Percentage
of total N ranged from 0,16% to 0,21% and slightly decreases with depth, which this land is classified as high amounts of nitrogen (0,1 to 0,2%), which fits most eutric cambisol in Serbia. Total nitrogen, however, does not correspond with the level of available forms of nitrogen (NH4+NO3) which level in the profile is quite high (210 kg N/ha at a depth of 0-120
cm), and was used small doses of nitrogen fertilizer during the research period (30 kg N/ha). The humus content is satisfactory for growing grapes. According to the available phosphorus content, soil in the deeper layers is poor, while the surface layer of high amounts of phosphorus. Potassium contents ranged from 11,95-14,15 mg K2O/100 g soil,
so that this land belongs to the medium amounts of soil potassium. Calcium was the highest in the layer of 0-30 cm (464 mg/100 g soil) and lowest in the layer from 90-120 cm (399 mg/100 g soil). Mg content has not significantly changed in the soil profile.
Table 2
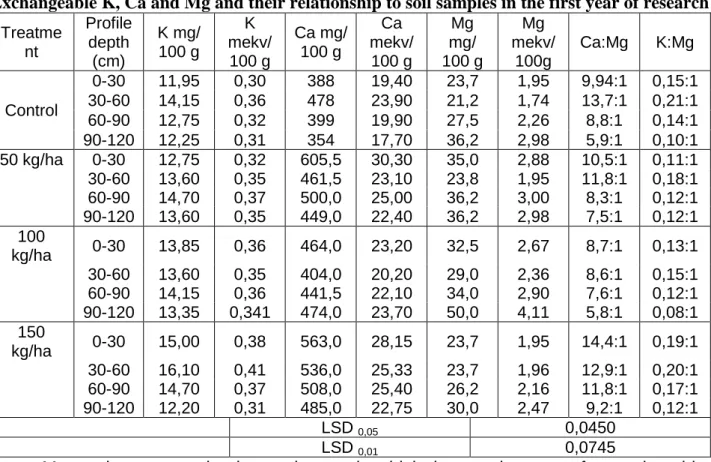
Exchangeable K, Ca and Mg and their relationship to soil samples in the first year of research
Treatme nt
Profile depth
(cm)
K mg/ 100 g
K mekv/
100 g
Ca mg/ 100 g
Ca mekv/
100 g
Mg mg/ 100 g
Mg mekv/
100g
Ca:Mg K:Mg
Control
0-30 11,95 0,30 388 19,40 23,7 1,95 9,94:1 0,15:1
30-60 14,15 0,36 478 23,90 21,2 1,74 13,7:1 0,21:1
60-90 12,75 0,32 399 19,90 27,5 2,26 8,8:1 0,14:1
90-120 12,25 0,31 354 17,70 36,2 2,98 5,9:1 0,10:1
50 kg/ha 0-30 12,75 0,32 605,5 30,30 35,0 2,88 10,5:1 0,11:1
30-60 13,60 0,35 461,5 23,10 23,8 1,95 11,8:1 0,18:1
60-90 14,70 0,37 500,0 25,00 36,2 3,00 8,3:1 0,12:1
90-120 13,60 0,35 449,0 22,40 36,2 2,98 7,5:1 0,12:1
100
kg/ha 0-30 13,85 0,36 464,0 23,20 32,5 2,67 8,7:1 0,13:1
30-60 13,60 0,35 404,0 20,20 29,0 2,36 8,6:1 0,15:1
60-90 14,15 0,36 441,5 22,10 34,0 2,90 7,6:1 0,12:1
90-120 13,35 0,341 474,0 23,70 50,0 4,11 5,8:1 0,08:1
150
kg/ha 0-30 15,00 0,38 563,0 28,15 23,7 1,95 14,4:1 0,19:1
30-60 16,10 0,41 536,0 25,33 23,7 1,96 12,9:1 0,20:1
60-90 14,70 0,37 508,0 25,40 26,2 2,16 11,8:1 0,17:1
90-120 12,20 0,31 485,0 22,75 30,0 2,47 9,2:1 0,12:1
LSD 0,05 0,0450
LSD 0,01 0,0745
on the K:Mg ratio which is ranged from 0,08-0,21:1 in first year, 0,13-0,29:1 in the second and 0,18:1in the third research year. This shows that potassium fertilization affected the relationship between these two elements in the soil which is reflected in some variants assessed as statistically significant.
In the first investigation year (table 2) in the profile depth of 30-60 cm, a fertilization treatment with 150 kg K2O/ha and control showed significant variation in the K:Mg ratio in
relation to treatments with 50 and 100 kg K2O/ha. In profile depth of 90-120 cm K:Mg ratio
was more expressed in the fertilization treatments with 150 and 50 kg K2O/ha compared
with the control and the treatment with 100 kg K2O/ha. Ca:Mg ratio had the highest values
in all profile layers in the treatment with 150 kg K2O/ha (9,2-14,4:1). Other treatments
showed less impact on the Ca:Mg ratio changing in the soil where the treatment with 100 kg K2O/ha had the lowest ratio values.
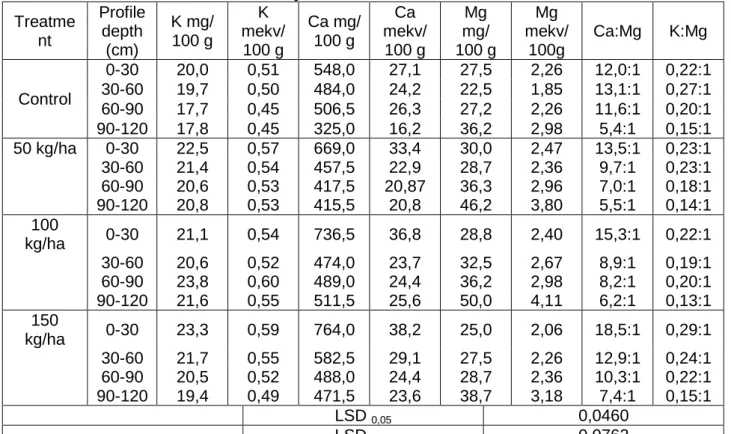
Table 3 Exchangeable K, Ca and Mg and their relationship to soil samples in the second
year of research
Treatme nt
Profile depth
(cm)
K mg/ 100 g
K mekv/
100 g
Ca mg/ 100 g
Ca mekv/
100 g
Mg mg/ 100 g
Mg mekv/
100g
Ca:Mg K:Mg
Control
0-30 20,0 0,51 548,0 27,1 27,5 2,26 12,0:1 0,22:1
30-60 19,7 0,50 484,0 24,2 22,5 1,85 13,1:1 0,27:1
60-90 17,7 0,45 506,5 26,3 27,2 2,26 11,6:1 0,20:1
90-120 17,8 0,45 325,0 16,2 36,2 2,98 5,4:1 0,15:1
50 kg/ha 0-30 22,5 0,57 669,0 33,4 30,0 2,47 13,5:1 0,23:1
30-60 21,4 0,54 457,5 22,9 28,7 2,36 9,7:1 0,23:1
60-90 20,6 0,53 417,5 20,87 36,3 2,96 7,0:1 0,18:1
90-120 20,8 0,53 415,5 20,8 46,2 3,80 5,5:1 0,14:1
100
kg/ha 0-30 21,1 0,54 736,5 36,8 28,8 2,40 15,3:1 0,22:1
30-60 20,6 0,52 474,0 23,7 32,5 2,67 8,9:1 0,19:1
60-90 23,8 0,60 489,0 24,4 36,2 2,98 8,2:1 0,20:1
90-120 21,6 0,55 511,5 25,6 50,0 4,11 6,2:1 0,13:1
150
kg/ha 0-30 23,3 0,59 764,0 38,2 25,0 2,06 18,5:1 0,29:1
30-60 21,7 0,55 582,5 29,1 27,5 2,26 12,9:1 0,24:1
60-90 20,5 0,52 488,0 24,4 28,7 2,36 10,3:1 0,22:1
90-120 19,4 0,49 471,5 23,6 38,7 3,18 7,4:1 0,15:1
LSD 0,05 0,0460
LSD 0,01 0,0763
In the second year of studies in the profile layer of 0-30 cm fertilization treatment with 150 kg K2O/ha has significantly higher K:Mg ratio compared to the control and
treatment with 100 kg K2O/ha. Observe with the profile depth values of K:Mg ratio slightly
decreasing, and have lower values than the surface layer. That, the profile depth from the 690 and 9120 cm have similar value of K:Mg ratio (0,13-0,22:1) while in the layer of 0-30 cm and 0-30-60 have higher values approach the values 0,27-0,29:1.Observed all tertmane by the profile depth reflected the value of Ca:Mg ratio with increasing depth decreased. The highest values of Ca:Mg ratio (18,5:1) were recorded during treatment with 150 kg K2O/ha in a profile layer of 0-30 cm (table 3).
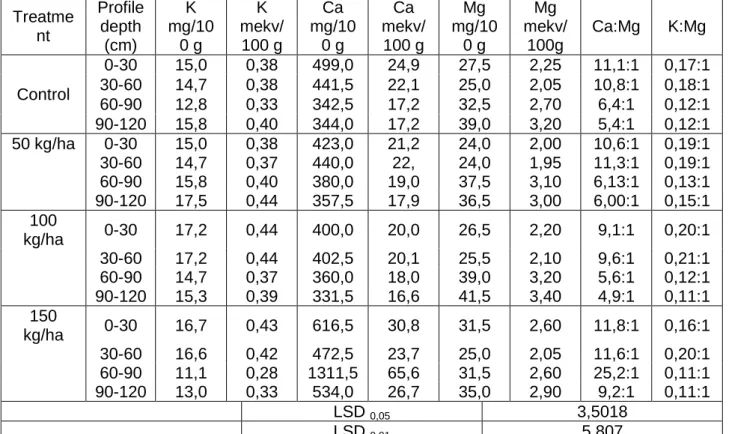
Exchangeable K, Ca and Mg and their relationship to soil samples in the third year of research
Treatme nt
Profile depth
(cm)
K mg/10
0 g
K mekv/
100 g
Ca mg/10
0 g
Ca mekv/
100 g
Mg mg/10
0 g
Mg mekv/
100g
Ca:Mg K:Mg
Control
0-30 15,0 0,38 499,0 24,9 27,5 2,25 11,1:1 0,17:1
30-60 14,7 0,38 441,5 22,1 25,0 2,05 10,8:1 0,18:1
60-90 12,8 0,33 342,5 17,2 32,5 2,70 6,4:1 0,12:1
90-120 15,8 0,40 344,0 17,2 39,0 3,20 5,4:1 0,12:1
50 kg/ha 0-30 15,0 0,38 423,0 21,2 24,0 2,00 10,6:1 0,19:1
30-60 14,7 0,37 440,0 22, 24,0 1,95 11,3:1 0,19:1
60-90 15,8 0,40 380,0 19,0 37,5 3,10 6,13:1 0,13:1
90-120 17,5 0,44 357,5 17,9 36,5 3,00 6,00:1 0,15:1
100
kg/ha 0-30 17,2 0,44 400,0 20,0 26,5 2,20 9,1:1 0,20:1
30-60 17,2 0,44 402,5 20,1 25,5 2,10 9,6:1 0,21:1
60-90 14,7 0,37 360,0 18,0 39,0 3,20 5,6:1 0,12:1
90-120 15,3 0,39 331,5 16,6 41,5 3,40 4,9:1 0,11:1
150
kg/ha 0-30 16,7 0,43 616,5 30,8 31,5 2,60 11,8:1 0,16:1
30-60 16,6 0,42 472,5 23,7 25,0 2,05 11,6:1 0,20:1
60-90 11,1 0,28 1311,5 65,6 31,5 2,60 25,2:1 0,11:1
90-120 13,0 0,33 534,0 26,7 35,0 2,90 9,2:1 0,11:1
LSD 0,05 3,5018
LSD 0,01 5,807
In the third year of study (table 4) statistical significance was achieved only in the difference in Ca:Mg ratio in the profile layer of 90-120 cm. Among increase in the value of Ca:Mg ratio in the soil was mostly influenced by treatment with 150 kg K2O/ha fertilizer
where values were the highest compared to other treatments. K:Mg ratio in the third year of investigation was not significantly changed by treatments above than the treatment with 100 kg K2O/ha where is recorded slightly higher ratio value (0,21:1) in the profile layer of
the 0-30 and 30-60 cm.
Table 5 Relations K:Mg in the leaves and shoots during the test period
Treatment I year II year III year
Leaf Shoot Leaf Shoot Leaf Shoot
Control 6,43:1 11,1:1 5,26:1 6,22:1 4,20:1 4,80:1
50 kg/ha 5,73:1 9,45:1 6,72:1 6,20:1 4,70:1 4,90:1
100 kg/ha 6,26:1 10,0:1 6,65:1 6,20:1 4,17:1 6,44:1
150 kg/ha 6,18:1 8,66:1 6,78:1 8,12:1 4,56:1 6,88:1
The K:Mg ratio in leaves should vary between 3 and 7. Smaller or larger values indicate a deficiency of one nutritional elements (Levy et al., 1964). Among experimental cultivar there was no potassium deficiency in the control and in the treatments with fertilizers, ie. ratio was higher than 3. Also not obvious magnesium deficiency because this quotient was higher than 7. The ratio is not varied under fertilization influence so that with these doses of potassium fertilizers (50-150 kg K2O/ha) potassium antagonism is not
manifested. The analysis of shoots shoved that the values of K:Mg ratio were the lowest in the first experiment year in treatment with 150 kg K2O/ha (8,66:1). In the second and third
experimental year there was increasing effect of fertilization with 150 kg K2O/ha and
second year of investigation) and 4,80-6,66:1 (in the third year of study). The results are shown in table 5.
CONCLUSIONS
Based upon the research can be performed following conclusions:
• Agrochemical analysis showed that soil conditions are favorable for growing grapes and development. With humus content of 3.3% of this soil is considered to be well assured, but the humus content increasing with depth. The level of total nitrogen ranged from 0.16 to 0.21% and is match high. In content of phosphorus in the soil surface layer is characterized as medium provided, while the deeper soil layers is poor in phosphorus; • The potassium level in soil varied from 11.95 to 14.15 mg K2O/100 g of soil and that
categorize this soil in middle category provided with potassium; • Soil provide with Ca and Mg were within the optimum;
• Available amounts of Ca (400-600 mg/100 g) and Mg (20-35 g/100 g) provide a normal grape nutrition so Ca:Mg ratio in the soil during the experiment was favorable.
• K:Mg ratio takes, in the first year of experiment values as from 0,08-0,21:1, the second year 0,13-0,29:1 and third year 0,18:1. That indicating that the fertilization with different doses of potassium fertilizer affected the ratio between these two elements in the soil, as in the variants with 100 and 150 kg K2O/ha assessed as statistically significant;
• With increasing fertilizers doses K:Mg ratio in the shoots and leaves was more favorable.
Acknowledgement
This paper was realized as a part of the project (TR 31063) Application of new genotypes and technological innovation in fruit and grape production financed by the Ministry of Education and Science of the Republic of Serbia within the framework of the technological projectresearch for the period 2011-2014.
BIBLIOGRAPHY
1. Conradie, W.J. (1994): Vineyard fertilization, Handbook of a workshop on vineyard
fertilization, Nietvoorbij Stellenbosch, South Africa, 41pp.
2. Garcia, M., Daverede, C., Gallego, P., Toumi, M.(1999): Effect of various
potassium-calcium ratios on cation nutrition of grape grown hydroponically, Journal of Plant Nutrition, Vol. 22(3), pp. 417-425.
3. Gluhić, D., Herak Čustić, M., Petek, M., Čoga, L., Slunjski, S., Sinčić, M. (2009): The content of Mg, K and Ca ions in vine leaf under foliar application of magnesium on calcareous soils, Agriculturae Conspectus Scientificus 2:81-84.
4. Hlušek, J., Richter, R., Ryan, P. (2002): Vyživa a hnojeni zahradnich plodin, I ed. Praha, Zemedelec, pp, 81.
5. Ličina V.(2009). Agrohemija. Zavod za udžbenike i nastavna sredstva. Beograd.
6. Ličina, V., Jakovljević, M. (1997): The K/Mg ratio in grapevine organs growt on diferent soil types. Zemljište i biljka. Beograd. Vol. 46(2). pp. 178-182.
7. McLean, E. O., Hartwig, R. C., Eckert, D. J., Triplett, G. B. (1983): Basic cations saturation ratios as a basis for fertilizing and liming agronomic crops: II. Field studies. Agron. J. 75, pp. 635-639.
8. Nakalamić A. (1991). Modifikovana dvokraka asimetrična kordunica. Jugoslovensko
vinogradarstvo i vinarstvo. Beograd. Br. 4, pp. 7-10.
9. Nakalamić A., Marković N. (2009). Opšte vinogradarstvo. Poljoprivredni fakultet.
Beograd.
10. Džamić R., Stevanović D., Jakovljević M. (1996). Praktikum iz agrohemije. Naučna
knjiga. Beograd.