Essay
TECNOSCIENZA
Italian Journal of Science & Technology Studies 8 (2) pp. 61-80 – ISSN 2038-3460
www.tecnoscienza.net 2017
The Urban Stack
A Topology for Urban Data Infrastructures
Aaron Shapiro
University of Pennsylvania (USA)Abstract: In this article, I develop the concept of the “urban stack” to eluci-date how urban data infrastructures gain legitimacy and produce value in cap-italist cities. Using two case studies, I study how the stack can incorporate both digital and non-digital components into its hierarchical topology. Heter-ogeneous components are strung together not only through technological means, as might be inferred from the emphasis on digitality in smart city liter-ature, but also through the ‘soft infrastructures’ of legal designations, franchise agreements, privacy policies, and info-graphics. A topological comparison be-tween the case studies yields three novel insights: first, urban data infrastruc-tures exploit extant infrastructural conditions; second, technical and proto-cological operations at the control layer can be used to legitimate ontological claims; and third, technology producers employ a selective and asymmetrical display of information at the level of the interface in order to manage mobile urban populations in real-time. From these insights, it is possible to reach a more abstract conclusion: value production for urban data infrastructures hinges on their producers’ ability to enroll heterogeneous elements into their stacked configuration and to then use this configuration to control the flow of information.
Keywords: interface; infrastructure; on-demand economy; stack; urban data.
Submitted: October, 5 2016 – Accepted: May 30, 2017
Corresponding author: Aaron Shapiro, Annenberg School for Communication, University of Pennsylvania, 3620 Walnut St., 200 Philadelphia, PA 19104, United States. Email: [email protected]
1. Introduction: Beyond the Urban Interface
‘actionable’ information” (Mattern 2014). More often than not, however, the information on offer is pre-processed and presented to users as colour-ful info-visualizations that boast of the efficiency of city services but offer “little understanding of how and where the mediation of urban systems takes place within the city itself” (ibid). As Shannon Mattern argues in her critique of the smart city, if we truly want to learn about the politics of urban data and actually existing smart cities (Shelton et al. 2015), we need first to see these interfaces as the mere surface of vast, digital-material in-frastructures that work by rendering the city as data.
Getting at these infrastructures means studying the composition of the operating systems and material supports that lay hidden, beneath and be-hind the interface: the vertical formation of interdependent layers of hard-ware and softhard-ware that are stacked together, materially and protocologi-cally, to produce the digital-material assemblage of the city (McFarlane 2011; Galloway 2004). This is what Mattern terms the “urban stack”. Its hardware includes switches, wires, and cables; pipes, telephone poles, and gas lines; the transmitters and receivers of mass communication broadcasts, as well as wi-fi internet connections and 4G cell networks; the dirt, con-crete, plastics, rubber, metal, and flesh that are the city’s core materials. Its software involves elements of the digital interface − “all those zoomable maps and apps that translate urban data into something useful” (Mattern
2014) − but also other kinds of interfaces that need be neither public nor
digital: the paperwork of the police officer, the ticket punch of the train conductor, the analogue clock atop city hall, the route of the post-man/woman; the inscription devices that enable or constrain mobility (Pe-ters 2013; Rose-Redwood 2006; Valverde 2011). Taken together, these as-semblages of humans and their social practices, objects and their materials, infrastructured technologies and their interfaces, are what make the city an urban space, “not simply a context for the support or appropriation of spe-cific lives,” but “the provisionally stitched together, jigged up intersections of bodies and materials upon which things are both moved and caught” (Simone 2011, 356).
2. The Urban Stack
The concept of “the stack” is borrowed from software production, where it refers to a specific, hierarchical assemblage of hardware, network protocol, and software (Solomon 2013). Theorists of software and power have applied the stack as topology for mapping how digital media relate to and affect the material, cultural, legal, and political worlds in which they are embedded (Bratton 2016; 2014; Solomon 2013; Straube 2016). The stack itself, however, is a somewhat ambiguous analytic object. As Solomon (2013) writes, the stack topology conflates the “operative structure that ex-ists materially within the program code of software systems” with the “class of diagrams used to explain both these operative structures and software systems more generally”. Without being able to fully disentangle these two dimensions, the slippage between material structuring and diagrammatics is nonetheless productive; it reflects both the ways in which practitioners conceptualize the integration of software and hardware as well as the top-ological relationships within their integration. These analyses suggest that, while the stack is a specific type of assemblage, its specificity is revealing for data infrastructures that bridge material-digital divides − exactly what is at stake in the urban stack.
well as a combination of automated and manual collection processes1.
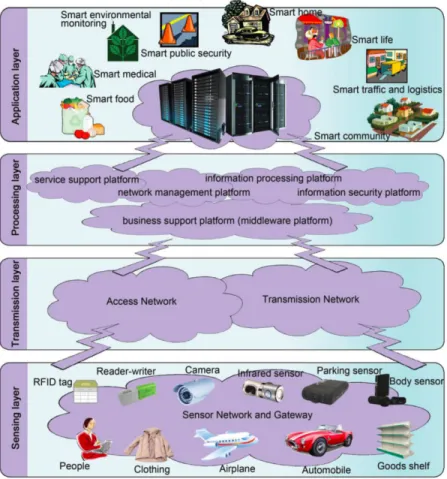
Figure 1 – The urban stack. Source: Liu and Peng 2014.
We can imagine this base layer as a distributed infrastructure, tethered together into a coherent program through its stacking. Urban data infra-structures rely on already-existing infrastructural conditions. Data collec-tion and aggregacollec-tion is highly opportunistic in this sense (Thatcher 2014).
Infrastructures erected for one purpose are coopted for another. The same goes for networks and protocols, digital and otherwise. A company doesn't have to reinvent GPS, traffic systems, census tracts, or government bureau-cracies in order to implement a new urban technology. But of course, such opportunistic cooptation of existing infrastructures is hardly acknowl-edged by smart city boosters.
In the middle is the control layer2. This is the level at which analogue
and native-digital data are aggregated together, processed, standardized, and analyzed. It is also at this layer that most proprietary software systems take hold (Kanngieser 2013; Rossiter 2014). Regardless of whether the source is public or private, data at the control level becomes privatized through its analysis. Machine learning techniques employ data to train al-gorithms for improved accuracy, or to discover non-obvious relationships between disparate phenomena. As the cloud icons at both the Transmis-sion and Processing layers in Figure 1 suggest, control is opaque to non-experts and outsiders. It involves code and interfaces that are not oriented toward end users, making them difficult to represent iconically (Chun 2011; Galloway 2012). Cloud icons stand in for the proprietary analytics that are so central to how value is imagined to be produced in capitalist systems (e.g., Mayer-Schonberger and Kukier 2012) − to how citizens are dispossessed of their data (Thatcher et al. 2016).
At the interface, processed data are presented to end-users through platforms that are both informational and informatic3. Interfaces are
dou-bly communicative in this sense: they both gather and display information (Halpern et al. 2013). Notable is the highly selective and asymmetrical way that information is presented to different types of users, and the effects that such asymmetries can have. As Galloway (2012, vii) writes, “Interfaces are not simply objects or boundary points” but “autonomous zones of activity […] processes that effect a result of whatever kind”. The selectivity by which information is communicated to different users is derived from a set of decisions made by technology producers to achieve desired effects from users’ interactions. Such decisions are thus an important source of control in urban space and a key objective amongst urban technology producers who utilize urban data. The uneven distribution of information, which hails different user-types as subjectivities (see Dalton et al. 2016) and augments patterns in urban mobility, is similarly an oft-neglected component of dig-ital urbanism.
2 The term “control layer” is borrowed from early descriptions of how GPS technologies work (Kaplan, cited in Kanngieser 2013, 604).
3. The City of the Future: Two Case Studies
The hierarchical topology of the urban stack helps to elucidate how value is produced and control exercised through urban data infrastruc-tures. How technology producers construct new stacks, or take advantage of stacked assemblages already in use, affords control over the flow of data and the production of new data ontologies (Kitchin and Lauriault 2014). Through a consideration of two case studies of urban data infrastructures, I illustrate how value is produced and legitimacy ensured by controlling the flow of information. These case studies share a number of similarities in how heterogeneous elements are assembled together to effect a stacked topology: each relies on the affordances of externalized infrastructures; each utilizes technical and protocological operations at the control layer, not only to extract value but also as a form of technological legitimation; and each employs a selective display of information on the urban interface as a way to manage mobile urban populations in real-time (Kanngieser 2013; Levy 2015; Rossiter 2014).
3.1 The Future of Public Spaces
In 2014, New York City Mayor Bill De Blasio announced that a con-sortium of private companies had won a Request for Proposal (RFP) to implement a vision of what the future of public spaces would look like (NYC.gov 2014b). This vision came in the form of an infrastructure for free public wi-fi called LinkNYC, slated to become the world’s fastest mu-nicipal wi-fi infrastructure and largest outdoor advertising network (ScreenMedia 2014). Intersection, the for-profit conglomeration of two
ex-isting companies − Titan and Control Group, an out-of-home advertising
firm and technology design company, respectively, along with consulting
by technology giants Qualcomm and Comark (NYC.gov 2014a) − was now
licensed to implement, operate, and maintain the LinkNYC infrastructure. The potential advertising revenue generated by LinkNYC, to be split with the City of New York, makes the infrastructure an attractive model for other cities. Much larger players, including Google’s Sidewalk Labs, quickly garnered interest in the project (Ingraham 2015), and there is al-ready talk of replicating LinkNYC in other cities (Kinney 2016; Tadena 2016).
poten-tial to be extensive in certain areas (I Quant NY 2014). One estimate sug-gests that LinkNYC’s overall coverage will include more than a third of
New York City’s land area4. Construction of the Links began in late
De-cember, 2015 in a rush to meet the stipulations of the service agreement (Brandom 2015). Several hundred Links now dot Manhattan, the Bronx, and Queens, with between 7.500 and 10.000 planned for implementation across the five boroughs. Each Link comes equipped with two 55-inch dig-ital, LCD signage displays dedicated to advertising (ScreenMedia 2014). The expected windfall of advertising revenue is slated to pay for the infra-structural overhaul and to yield an approximate $500 million for both the public and private entities involved over the next decade (Department of Information Technology and Telecommunications [DoITT] 2014).
LinkNYC’s potential for generating urban data has been celebrated as invaluable for urban planning purposes (Fung 2016; Hotz 2015; NYC.gov 2014b). Despite repeated concerns about privacy infractions on the net-work (e.g. NYCLU 2016), the promise that LinkNYC will provide
real-time data about mobile urban populations to institutional actors −
includ-ing real estate developers, city planners, app developers, advertisers,
met-ropolitan police, transit authorities, etc. − is an important mechanism for
establishing the infrastructure’s legitimacy (cfr. Gustin 2016). In the words of Intersection’s Chief Strategist Dave Etherington:
When you think about LinkNYC and the 7.500 or so fairly evenly distributed nodes across the five boroughs, then that does represent a really interesting opportunity to learn about the city, the behaviours of the city, that could lead directly to health benefits, more efficient use of traffic – being able to sense, are trucks idling near these things illegally? Is there congestion? Is there a traffic jam? Is there noise pol-lution, air pollution? All of these things, by microlocation, could really empower some really interesting insights about the city that will make it a kind of more en-joyable place to live (Behind the Numbers 2016).
To quell lingering privacy concerns, Intersection developed a concise (if still vague) privacy code (NYC.gov 2016) outlining the technical protec-tions in place. Data shared over the networked will be encrypted and au-tomatically anonymized by unique, randomized keys for each MAC ad-dress that logs onto the wi-fi network. LinkNYC also promises not to track web browsing histories on devices connected through the wi-fi. However, even if these technological solutions and protections for privacy prove ef-fective, data generation will continue apace. This is because LinkNYC’s most valuable data-infrastructural affordance is its ability to simply count people: “We do not collect information about your precise location. How-ever, we know where we provide Wi-fi services, so when you use the Ser-vices we can determine your general location” (NYC.gov 2016). By virtue
of logging into the LinkNYC wi-fi, users will be counted, in place, in real-time. The system may “combine Technical Information or non-Personally Identifiable Information about your use of the Services with similar infor-mation about other users in an aggregate or anonymous manner” in order to “measure or understand the effectiveness of advertising we serve to you and other customers like you, and to deliver relevant advertising to you” (ibid). There is also the potential for LinkNYC to count people who are not logged onto its wi-fi (cf. Musa and Eriksson 2012). Evidence of this can be gleaned in documentation of the LinkNYC technical capabilities as well as by considering how companies in the Intersection consortium have be-haved historically. In 2014, Titan, Intersection’s advertising arm, installed Bluetooth low energy (BLE) beacons on New York’s payphones, which are capable of counting all devices with wi-fi and Bluetooth connection capa-bilities within its range. When it was made public that Titan had installed these devices without notifying citizens, the New York City Department of Information Technology and Telecommunications (DoITT) required Ti-tan to remove the beacons (Bernstein and Ryley 2014). This same technol-ogy is built into the Link system (Intersection 2016), although representa-tives from Intersection claim that they have not yet been turned on (Gustin 2016).
The technological capacity to silently count readable devices is not new,
nor is it limited to LinkNYC5. What is new about the LinkNYC’s potential
data collection is the granularity and penetration that it achieves. With smart phone penetration reaching 80% of New Yorkers in 2015 and still growing (NYC Dept. of Consumer Affairs 2015), LinkNYC is poised to generate real-time locational and mobility data on a majority of New York’s population. The uses towards which this data might be put are, at present, limited to the twinned domains of advertising and urban planning. Where the urban planning uses of data legitimates LinkNYC’s silent locational data collection, the advertising revenue generated for the City likewise le-gitimates the public-private partnership between Google-backed Intersec-tion and the City of New York. The normalized dwindling of public service provision in neoliberal or entrepreneurial cities (Harvey 1989) opens a market-space for private companies to capitalize on infrastructure and to label it “innovation”. In Intersection’s Chief Strategist Etherington’s words:
The advertising concessions related to this infrastructure are seen as vehicles for innovation and that's really where we’re at in our focus from the media side – that,
with these advertising contracts, we’re able to introduce not just increased adver-tising revenue for cities, but we can bring in new technologies and new innovation (Behind the Numbers 2016).
The desired outcome of LinkNYC is to transform public spaces into sites of real-time data generation that can be capitalized on through adver-tising sales. The release of this data to urban planning agencies legitimates not only the City’s involvement, but also the private company’s right to silently collect and analyse urban data without even tacit consent.
3.2 The Future of Work
Recent discussions about the future of work have emphasized the role that app-based platforms will play in making labour economies more flex-ible (e.g., Hanrahan 2015). This debate is especially important for cities, given the growth and concentration of the service sector as a major local economic industry in urban areas in the U.S. and elsewhere (Lopez-Cermeño 2015), as well as the impact that work platforms have already had on cities (Zumbrun 2016). Prominent examples include informal taxi ser-vices Uber and Lyft, and courier serser-vices like Caviar and Postmates. These companies profit from the algorithmic management of fleets of independ-ent contractors who, through worker-facing apps loaded onto their mobile smartphones, connect with customers seeking delivery or taxi services. Fleet management apps work as semi-automated systems for labour assign-ment and oversight (Rosenblat and Stark 2016, 2). They use closely-guarded algorithmic calculations to set prices for both customers and pay-outs for workers. If described at all, explanations of these algorithmic cal-culations are cloaked with vague terminology about the distance of a deliv-ery or a taxi fare, or even shifting levels of demand. Neither the customer nor the worker has access to the full information (Kirchner and Mattu 2015). The term “on-demand economy” describes the experiences of both customers and workers for these platforms. What these companies deliver is quasi-luxury, hyperlocal mobility – the movement of goods (as in the food courier platforms Caviar and PostMates) or people (as in the taxi and black car services Uber and Lyft): door-to-door service, ordered with the push of a button, just-in-time and on-demand (Ruckelshaus 2016). Work-ers for these companies, designated as independent contractors rather than employees (Scheiber 2015), are enticed with the promise of flexibility −
given job (Rosenblat and Stark 2016)6.
Despite the promise of flexibility, in practice, on-demand platforms employ numerous disciplining techniques (such as ratings systems and ac-countability indices) to cajole workers into adhering to some sort of
sched-uling system or acceptance rate − the same rigid components from which
flexible working was meant to depart (cfr. Graboyes 2016). For instance, Caviar, an upscale food delivery service available in fifteen of the country’s largest metro areas, sends an automated weekly email to its workers with a
breakdown of completed orders and payments7. The company recently
in-troduced a new component to this email, an index of workers’ scheduling reliability, which calculates the ratio of time spent logged into the app dur-ing a scheduled shift. Workers are contractually not obliged to commit to scheduled shifts, but for management, having a schedule helps plan for predicted ebbs and flows in demand. The index impresses upon the worker his or her standing as reliable, despite its contractual irrelevance. Several indicators are excluded from this index that could just as easily reflect a worker’s reliability. For example, when understaffed, the company sends out a notice to encourage couriers to sign on; the scheduling reliability in-dex does not account for how often a courier responds to these emergency
requests8. Nor is there a calculation of what percentage of time a worker
sat idle during his or her scheduled shift − logged on, but not receiving orders and thus not getting paid.
What is most striking is the opacity around whether or not this ratio affects one’s rankings in the algorithmically-defined queue of couriers used for dispatching orders. As one Caviar courier explained during an inter-view:
When I first started working for Caviar, I was told that we weren’t obligated to accept orders. It’s completely at our discretion when we want to work and what orders we want to accept. That was a big selling point for them looking for couriers […]. Now, they're doing this [scheduling] reliability system […]. It feels like Caviar is trying to guilt trip us for not showing up for our shifts, which are not obligatory, and whether or not we’re being penalized for showing up for our shifts is kind of unclear. But whether or not they’re penalizing us, it seems like they're asking us to penalize ourselves9.
Another example is Uber’s policies for deactivating drivers. Prior to the
6 Contrary to this model, some have argued that since Uber and other compa-nies do profit off of drivers even when they are not delivering a passenger, workers should be paid for their time.
7 My methods for this research include working as a Caviar courier for 12 months; I received these emails while working for Caviar.
8 A typical notice, which is called “the bat signal” by management, reads “Lunch is busy NOW and we are understaffed! Go online NOW to take full ad-vantage of this lunch bizness, Philly!” (received 5/3/2016).
settlement of a class action lawsuit (Isaac and Scheiber 2016), Uber was opaque about its deactivation policy. Rationales ranged from inactivity (not working for 90 days) to low acceptance rates (the ratio of how many rides a driver accepts to how many requests he or she receives) (Dough 2016). These disciplinary techniques are automated and incorporated into the technological fabric of workers’ day-to-day labor practices.
In addition to mechanisms that belie the flexibility of on-demand work, on-demand platforms are also characterized by their highly selective and asymmetrical display of information within the worker interfaces (see also Rosenblat and Stark 2016). Lyft drivers see maps that show them areas where surge pricing (or Prime Time) is in effect. In these areas, passengers are subjected to higher rates due to local distributions of demand (or algo-rithmically-predicted distributions of demand) at a given time interval (Chen and Sheldon 2015; Kirchner and Mattu 2015; Rosenblat and Stark 2016). Workers argue that dynamic pricing is a fleet management tech-nique used to incentivize drivers to go to busier areas. But since the algo-rithmic calculations that determine surge pricing are opaque to drivers, as are the number and whereabouts of other drivers on the road at the same time, there is no guarantee that going to a surge zone will mean getting a well-paying job. In another example, the courier apps often obscure the address of a delivery drop-off when the worker is prompted to accept or reject an order. High rise apartments or office buildings can be unattractive to couriers, since payment is calculated based on the ground-distance be-tween the restaurant and the delivery address and not on how much time is spent getting to an apartment or office. Knowing that a drop-off location is on the 25th floor might thus be a disincentive for a courier to accept the job; the company’s interest is thus to omit this information until a courier has already accepted the order. Such informational asymmetries give work-ers just enough information to complete a task, but obscure enough infor-mation that the company’s interests appear to be in the workers’ as well.
4. Topologizing Urban Data Infrastructures
The case studies presented here differ in interesting ways. LinkNYC is a large infrastructural overhaul managed by private firms and marketed as a public good in the form of free wi-fi; apps in the on-demand economy are much more distributed and explicitly focused on extracting value from workers. Despite their differences, the two cases share much in common, and their similarities can be fruitfully highlighted by employing the topol-ogy of the urban stack. Using the stack as a heuristic, these cases can be
bent and stretched to facilitate comparison (Secor 2013), which, in turn,
4.1 Distributed Infrastructures
Both case studies rely on a distributed infrastructural base upon which other elements are stacked to create small monopolies of data collection, storage, and analysis. This distributed base externalizes costs and mitigates risk by taking advantage of extant infrastructural conditions. With LinkNYC, there are two ways that extant infrastructure is enrolled into the network. First, LinkNYC exploits the sunk cost telecommunications infra-structure already in place in New York City, constructing its hardwired connections between the Links within the conduits built beneath the sur-faces of New York’s most densely packed pockets (PlaNYC 2013). Fiber optic connections can be strung through conduits, which can be accessed simply by opening a manhole cover. LinkNYC is being built without hav-ing to break ground. Second, LinkNYC relies on the growhav-ing penetration of smartphones amongst New Yorkers. Smartphones and other readable devices, such as tablets or laptops, even if not actively connected to the LinkNYC wi-fi networks, serve as de facto sensors for LinkNYC’s produc-tion of real-time data about urban populaproduc-tions. This data collecproduc-tion is in-tegral to its legitimacy.
In the on-demand economy, the most profound way that companies take advantage of distributed infrastructures hinges on the legal designa-tion of workers as independent contractors rather than workers. The ques-tionability of this designation was recently deferred by the settlement of a class action suit involving Uber workers in Massachusetts and California (Isaac and Scheiber 2016). For on-demand services like Uber, Lyft, or Cav-iar, this deferment is a boon: not only do the companies remain free from being required to cover employee expenses such as Social Security and workers’ compensation, they can continue requiring workers to provide their own means of communication and transportation – typically a smartphone and a bicycle or car. Employees are left to cover the costs of data bills and fuel, as well as for any upkeep and repair to vehicles due to wear and tear incurred while working on the road. Further, companies are legally prohibited from providing tax education to workers, as this would breach the legal distinction between independent contractor and employer (Mishel 2016). On-demand economy companies have proved successful at enrolling workers who are willing to supply their own means of
transpor-tation and communication − costs that employees typically do not cover.
The infrastructural conditions that facilitate that rapid, on-demand move-ment of people and things in this sector is thus outsourced to the workers themselves, both in terms of their own bodies and labor (including risk of injury, healthcare coverage, fatigue, etc.) and in terms of their privately owned consumer technologies, which serve as networked infrastructural components10.
4.2 Control
Control is exercised in both the LinkNYC and on-demand economy examples through the effects of black-boxed regimes of calculation. In the case of LinkNYC, two functions at the control layer will be key to its suc-cess. The first is the hidden protocological activity that randomizes or anonymizes user identification in order to ensure privacy. These protocols transform aggregated user data into a format that can become information-ally meaningful while simultaneously providing a technological solution to concerns over privacy. The second function at the control layer involves the dynamic, algorithmic calculation of pricing for advertising that will be based on this information (Behind the Numbers 2016). Once a real-time count of devices is in place, algorithms will not only “allow advertisers to deliver highly targeted content to passers-by, [which] works similarly to ad-targeting algorithms users encounter while surfing the Web” (Campbell 2016), but also to create a dynamic pricing model such that ad space costs more when more people are around to view them (Shpanya 2014). As one online advertising trade magazine explains, the Links’ “strategically placed, networked digital signage displays” are situated within “a larger mul-tiscreen ecosystem that effectively amplifies brand messages to create a deeper level of engagement with active consumers […] with highly targeted messages” (ScreenMedia 2014). LinkNYC’s real-time data on the ebbs and flows of urban populations will be able to make already-valuable out-of-home advertising space even more profitable by charging advertisers more during periods of high traffic.
With on-demand economy smartphone apps, the control layer is largely hidden from workers, effecting an informational asymmetry that can be leveraged to manage large fleets of workers in real-time (Rosenblat and Stark 2016). Control is manifest in the proprietary algorithms that deter-mine which couriers or drivers should be matched with which deliveries or riders, where, when, and at what price (Chen and Sheldon 2015). The pro-prietary nature of these algorithms is central to the profitability of compa-nies in the on-demand economy. But it is also important in legitimizing claims that on-demand companies are not service providers, but rather technological platforms that serve merely to connect supply and demand. Such claims are important, since they legitimate the designation of workers as independent contractors, who supply their own modes of transport, communication, health insurance, etc. As one Uber engineer wrote in a widely read forum about Uber on Quora:
A taxi company contracts drivers, deals with vehicles, pre book rides [sic], etc. Uber deals with building data centres, running real time software services,
ing payment and conducting research into the economics of real time transporta-tion automatransporta-tion, among solving all sorts of other interesting technological problems
− all things that are not done by a taxi service. It’s a totally different operation from what a taxi company or a transportation service does […] Uber is not a taxi com-pany, but a technology company that provides solutions for people's transportation needs [just like] eBay is not a shopping mall, but a technological platform that en-able [sic] private sellers to find buyers for what they have to offer (Tal 2015).
Activity at the control layer allows for dynamic pricing models that ex-ploit surges in demand, allocates orders to the lowest-costing courier or driver based on the distance to the customer, and, ultimately, serves as a justification for the companies’ designation as technology producers rather than urban transportation or logistics services, which would be regulated more stringently.
4.3 Interface
Finally, the selective display of information at the interface level is key to the functioning of both LinkNYC and on-demand economy companies. On the one hand, the omission of information can be used tactically to realize certain effects. This is clear in the on-demand economy’s worker-facing apps. For example, the Caviar Courier app has a sequence through which couriers must step through when accepting, picking up, and deliv-ering an order. Throughout this sequence, certain bits of information are given while others remain omitted. The need-to-know basis of information here is productive: it gives workers just enough information to complete the task at hand, but not enough for them to gain a full understanding of how the system works and thus optimize their output in the form of pay-ments. The same could be said of LinkNYC’s interfaces and the “larger multiscreen ecosystem” (ScreenMedia 2014) into which they fit. This eco-system is both informational and informatic: usage generates data. But these data are systematically excluded and consciously hidden from inter-face displays (Chun 2011). The doubly-communicative interinter-faces are de-signed such that individual users can never access the full scope of infor-mation relevant to the landscape in which they’re operating, but are ex-pected nonetheless to use the information that they do have to maximize private gain. This reflects Mattern’s (2014) point about the trade-offs im-plicit in the smart city interface; they “suggest that we’ve traded in our en-vironmental wisdom, political agency and social responsibility for corpo-rately-managed situational information, instrumental rationality and
per-sonal consumption and convenience. We seem ready to translate our messy
city into my efficient city” (original emphasis).
Indices and info-graphics about the worker’s performance are described by workers as “mind games” or “guilt trips”. These techniques are com-mon to the integration of digital surveillance mechanisms within the work-place (Kanngieser 2013; Levy 2015; Rossiter 2015). With LinkNYC, the potential for advertising displays to direct the attention of passers-by to local consumer points of interest is a subtler form of managing mobility. Hyperlocal, modular ad displays can be designed to steer potential custom-ers to local restaurants, cafes, shopping centres, department stores, with the promise of discounts or coupons: “You can expect the [LinkNYC] ki-osks to start telling you there’s a table for two open at the French bistro down the street, for instance. Or that the subway station nearest you is of-fering limited service due to repairs” (Fung 2016). This kind of hyperlocal notification allows those with access to the network’s counting capabilities to produce market value through the targeted modulation and steering of mobile urban populations.
5. Conclusion
The urban stack is a productive heuristic with which we might better understand how urban data can be made a valuable commodity. Using the two case studies of LinkNYC as a data-generative municipal wi-fi infra-structure and the worker-facing apps of the on-demand economy, I showed how the stack can incorporate both digital and non-digital components into its hierarchical topology, including telecommunications conduits lo-cated beneath the streets in Manhattan and other parts of New York City, as well as mobile fleets of drivers and bikers, as infrastructures for facilitat-ing or steerfacilitat-ing the movement of goods and people. I have also illustrated that heterogeneous components are strung together not only through tech-nological means, as might be inferred from the emphasis on digitality in smart city literature, but also through the “soft infrastructures” of legal designations, franchise agreements, privacy policies, and info-graphics, as well as the dispersed infrastructure of transportation and communications maintenance.
urban interface to manage and capitalize on the movements of urban pop-ulations in real-time. From these insights, it is possible to reach a more ab-stract conclusion: value production for urban data infrastructures hinges on their producers’ ability to enrol heterogeneous elements into their stacked configuration, and then use this configuration to control the flow of data and information.
References
Behind the Numbers (2016) Listen In: Blending Tech with Media to Make Cities Smarter. eMarketer, https://www.emarketer.com/Article/Listen-In-Blen-ding-Tech-with-Media-Make-Cities-Smarter/1014312 (retrieved September 1, 2016).
Bernstein, J. and Ryley, S. (2014) Exclusive: Hundreds Of Devices Hidden Inside New York City Phone Booths, http://www.buzzfeed.com/joseph-bernstein/ex-clusive-hundreds-of-devices-hidden-inside-new-york-city-ph (retrieved May 1, 2016).
Brandom, R. (2015) New York is finally installing its promised public gigabit Wi-Fi, http://www.theverge.com/2015/12/28/10674634/linknyc-new-york-pub-lic-wifi-installation-photos-gigabit (retrieved May 1, 2016).
Bratton, B. (2016) The Stack: On Software and Sovereignty, Cambridge, Mass, MIT Press.
Bratton, B. (2014) The Black Stack, http://www.e-flux.com/journal/the-black-stack/ (retrieved April 30, 2016).
Campbell, C. (2016) LinkNYC Kiosks Provide Free Internet, But for a Price, http://www.govtech.com/dc/articles/LinkNYC-Kiosks-Provide-Free-Interne-t-But-for-a-Price.html (retrieved April 30, 2016).
Chen, M.K. and Sheldon, M. (2015) Dynamic Pricing in a Labor Market: Surge Pricing and Flexible Work on the Uber Platform, http://www.anderson.uc-la.edu/faculty/keith.chen/papers/SurgeAndFlexibleWork_WorkingPaper.pdf (retrieved October 3, 2016).
Chun, W.H.K. (2011) Programmed Visions: Software and Memory, Cambridge, Mass, MIT Press.
Dalton, C.M., Taylor, L. and Thatcher, J. (2016) Critical Data Studies: A Dialog on Data and Space, in “Big Data & Society”, 3 (1), pp. 1-16.
DoITT (2014) LinkNYC. DoITT, http://www1.nyc.gov/site/doitt/initia-tives/li-nknyc.page (retrieved May 1, 2016).
Downey, G. (2003) Telegraph Messenger Boys: Crossing the Borders Between His-tory of Technology and Human Geography, in “The Professional Geogra-pher”, 55 (2), pp. 134-145.
Fung, B. (2016) The Tremendous Ambitions Behind New York City’s Free WiFi, https://www.washingtonpost.com/news/the-switch/wp/2016/04/08/the-trem-endous-ambitions-behind-new-york-citys-free-wifi/ (retrieved April 30, 2016).
Galloway, A.R. (2004) Protocol: How Control Exists after Decentralization, Cam-bridge, Mass, MIT Press.
Galloway, A.R. (2012) The Interface Effect, Cambridge, Polity Press.
Graboyes, R. (2016) Gigs, Jobs, and Smart Machines, http://mercatus.org/ex-pert_commentary/gigs-jobs-and-smart-machines (retrieved May 1, 2016).
Graham, S. and Marvin, S. (2001) Splintering Urbanism: Networked Infrastruc-tures, Technological Mobilities and the Urban Condition, New York, Routledge.
Gustin, S. (2016) LinkNYC’s New Free Network Is Blazing Fast. But at What Cost to Privacy?, http://motherboard.vice.com/read/linknycs-new-free-network-is-blazing-fast-but-at-what-cost-to-privacy (retrieved May 4, 2016).
Halpern, O., LeCavalier, J., Calvillo, N. and Pietsch, W. (2013) Test-Bed Urban-ism, in “Public Culture”, 25 (2), pp. 272-306.
Hanrahan, O. (2015) We Must Protect the On-Demand Economy to Protect the Future of Work, http://www.wired.com/2015/11/we-must-protect-the-on-de-mand-economy-to-protect-the-future-of-work/ (retrieved May 1, 2016).
Harvey, D. (1989). From Managerialism to Entrepreneurialism: The Transfor-mation in Urban Governance in Late Capitalism, in “Geografiska Annaler: Se-ries B, Human Geography”, pp. 3-17.
Hotz, R.L. (2015) As World Crowds In, Cities Become Digital Laboratories, http://www.wsj.com/articles/as-world-crowds-in-cities-become-digital-labora-tories-1449850244 (retrieved May 1, 2016).
Ingraham, N. (2015) Google’s Sidewalk Labs is taking over the plan to blanket NYC with free Wi-Fi, http://www.theverge.com/2015/6/23/8834863/goo-gle-sidewalk-labs-linknyc-free-wifi (retrieved May 1, 2016).
Intersection (2016) LinkNYC Fact Sheet, https://www.link.nyc/assets/down-loads/LinkNYC-Fact-Sheet.pdf (retrieved May 1, 2016).
I Quant NY (2014) The Hot Spots of New York: A Coverage Map of NYC’s Free WiFi Payphones, http://iquantny.tumblr.com/post/103186044179/the-hot-spots-of-new-york-a-coverage-map-of (retrieved April 30, 2016).
http://www.nytimes.com/2016/04/22/technology/uber-settles-cases-with-concessions-but-drivers-stay-freelancers.html (retrieved May 1, 2016).
Kanngieser, A. (2013) Tracking and Tracing: Geographies of Logistical Govern-ance and Labouring Bodies. in “Environment & Planning D: Society and Space”, 31 (4), pp. 594-610.
Kinney, S. (2016) Washington D.C. Considering Public Wi-Fi Network, http://www.rcrwireless.com/20160502/network-infrastructure/wi-fi/washing-ton-d-c-considering-public-wi-fi-network-tag17 (retrieved May 2, 2016).
Kirchner, L. and Mattu, S. (2015) Uber’s Surge Pricing May Not Lead to a Surge in Drivers, https://www.propublica.org/article/uber-surge-pricing-may-not-lead-to-a-surge-in-drivers (retrieved April 30, 2016).
Kitchin, R. and Lauriault, T.P. (2014) Towards Critical Data Studies: Charting and Unpacking Data Assemblages and Their Work, The Programmable City Work-ing Paper, National University of Ireland Maynooth.
Law, J. and Mol, A. (2001) Situating Technoscience: An Inquiry into Spatialities, in “Environment and Planning D: Society and Space”, 19 (5), pp. 609-621.
Levy, K.E.C. (2015) The Contexts of Control: Information, Power, and Truck-Driving Work, in “The Information Society”, 31, pp. 160-174.
Liu, P. and Peng, Z. (2014) China’s Smart City Pilots: A Progress Report, in “Com-puter”, 47 (10), pp. 72-81.
Lopez-Cermeño, A. (2015) Service Labour Market: The Engine of Growth and In-equality, http://voxeu.org/article/service-labour-market-engine-growth-and-inequality (retrieved July 30, 2016).
Mattern, S. (2014) Interfacing Urban Intelligence, https://placesjournal.org/ar-ti-cle/interfacing-urban-intelligence/ (retrieved April 30, 2016).
Mayer-Schönberger, V. and Cukier, K. (2012) Big Data, Boston, Mass, Houghton Mifflin.
McFarlane, C. (2011) The City as Assemblage: Dwelling and Urban Space, in “En-vironment and Planning D: Society and Space”, 29 (4), pp. 649-671.
Mishel, L. (2016) The Role of On-demand Platforms. Panel, MIT Initiative on the Digital Economy: On-Demand Economy Conference. March 15, 2016. Cam-bridge, Mass.
Musa, A.B.M. and Eriksson, J. (2012) Tracking Unmodified Smartphones Using Wi-Fi Monitors, in Proceedings of the 10th ACM Conference on Embedded Network Sensor Systems, Toronto, ON, Canada, ACM, pp. 281-294.
NYC Department of Consumer Affairs (2015) New York City Mobile Services
Study,
https://www1.nyc.gov/assets/dca/MobileServicesStudy/Research-Brief.pdf (retrieved May 1, 2016).
NYC DOT (2016) Bicycle Counts,
NYC.gov (2014a) De Blasio Administration Announces Winner of Competition to Replace Payphones, http://www1.nyc.gov/office-of-the-mayor/news/923- 14/de-blasio-administration-winner-competition-replace-payphones-five-bor-ough (retrieved April 30, 2016).
NYC.gov (2014b) Support Pours in For LinkNYC. Office of the Mayor, in www1.nyc.gov/office-of-the-mayor/news/944-14/support-pours-for-linknyc (retrieved April 30, 2016).
NYC.gov (2016) Public Communications Structure Franchise Agreement, Exhibit 2 – CityBridge Privacy Policy, http://www1.nyc.gov/assets/doitt/down-loads/pdf/Proposed-PCS-Franchise-Exhibit-2-CityBridge-Privacy-Policy.pdf (retrieved May 4, 2016).
NYCLU (2016) City’s Public Wi-Fi Raises Privacy Concerns, http://www.nyc-lu.org/news/citys-public-wi-fi-raises-privacy-concerns (retrieved May 1, 2016).
Peters, J.D. (2013) Calendar, Clock, Tower, in J. Stolow (ed.), Deus in Machina: Religion and Technology in Historical Perspective, New York, Fordham Uni-versity Press, pp. 25-42.
PlaNYC (2013) Telecommunications. A Stronger, More Resilient New York: Spe-cial Initiative for Rebuilding and Resiliency, http://www.nyc.gov/ht-ml/sirr/html/report/report.shtml (retrieved May 1, 2016).
Rosenblat, A. and Stark, L. (2016) Algorithmic Labor and Information Asymme-tries: A Case Study of Uber’s Drivers, in “International Journal of Communi-cation”, 10, pp. 3758-3784.
Rose-Redwood, R.S. (2006) Governmentality, Geography, and the Geo-coded World, in “Progress in Human Geography”, 30 (4), pp. 469-486.
Rossiter, N. (2014) Locative Media as Logistical Media: Situating Infrastructure and the Governance of Labor in Supply-Chain Capitalism. In R. Wilken and G. Goggin (eds.), Locative Media, New York, Routledge.
Rossiter, N. (2015) Coded Vanilla: Logistical Media and the Determination of Ac-tion, in “South Atlantic Quarterly” 114, pp. 135-152.
Ruckelshaus, C. (2016) Ending the ‘Independent Contractor’ Charade in On-De-mand and Just-In-Time Work, http://www.huffingtonpost.com/catherine-ruckelshaus/ending-the-independent-co_b_9093632.html (retrieved May 3, 2016).
Scheiber, N. (2015) A Middle Ground Between Contract Worker and Employee, http://www.nytimes.com/2015/12/11/business/a-middle-ground-between-contract-worker-and-employee.html (retrieved May 1, 2016).
ScreenMedia (2014) CityBridge to Launch LinkNYC, Largest Urban Digital Ad Network, http://screenmediadaily.com/citybridge-to-launch-linknyc-lar-gest-urban-digital-ad-network/ (retrieved April 30, 2016).
“Urban Geography”, 34 (4), pp. 430-444.
Shelton, T., Zook, M. and Wiig, A. (2015) The ‘Actually Existing Smart City’, in “Cambridge Journal of Regions, Economy and Society”, 8, pp. 13-25.
Shepard, M. (2011) Sentient City: Ubiquitous Computing, Architecture, and the Future of Urban Space, New York, Architectural League of New York.
Shpanya, A. (2014) Why Dynamic Pricing is a Must for Ecommerce Retailers, https://econsultancy.com/blog/65327-why-dynamic-pricing-is-a-must-for- ecommerce-retailers/?utm_campaign=bloglikesandutm_medium=social-net-work-andutm_source=facebook (retrieved April 30, 2016).
Simone, A. (2004) People as Infrastructure: Intersecting Fragments in Johannes-burg, in “Public Culture”, 16 (3), pp. 407-429.
Simone, A. (2011) The Surfacing of Urban Life, in “City”, 15 (3-4), pp. 355-364.
Söderström, O., Paasche, T. and Klauser, F. (2014) Smart Cities as Corporate Sto-rytelling, in “City”, 18 (3), pp. 307-320.
Solomon, R. (2013) Last In, First Out: Network Archaeology of/as the Stack, http://amodern.net/article/last-in-first-out/.
Straube, T. (2016) Stacked Spaces: Mapping Digital Infrastructures, in “Big Data and Society”, 3 (2), pp. 1-12.
Tadena, N. (2016) Intersection Names New CEO Amid Push to Bring Free Wi-Fi to New York City, http://www.wsj.com/articles/intersection-names-new-ceo-amid-push-to-bring-free-wi-fi-to-new-york-city-1455717601 (retrieved April 30, 2016).
Tal, R. (2015) Is Uber Really not a Taxi Service?, https://www.quora.com/Is-Uber-really-not-a-taxi-service (retrieved April 30, 2016).
Thatcher, J. (2014) Living on Fumes: Digital Footprints, Data Fumes, and the Lim-itations of Spatial Big Data, in “International Journal of Communication”, 8, pp. 1765-1783.
Thatcher, J., O’Sullivan, D. and Mahmoudi, D. (2016) Data Colonialism through Accumulation by Dispossession: New Metaphors for Daily Data, in “Environ-ment & Planning D: Space and Society”,34 (6), pp. 990-1006.
Valverde, M. (2011) Seeing Like a City: The Dialectic of Modern and Premodern Ways of Seeing in Urban Governance, in “Law and Society Review”, 45 (2), pp. 277-312.