195
TENDENCIES OF CLIMATIC INDICES IN THE ROMANIAN
IRRIGATION SYSTEMS
OLGA VIZITIU, IRINA CALCIU
Keywords: drought, water deficit, climate changes, irrigation system
ABSTRACT
The aim of this investigation was to evaluate the tendencies of climate aridity of areas where irrigation systems are present, based on meteorological parameters such as precipitations, potential evapotranspiration and water deficit as expressed by the average value of the ratio between precipitation and potential evapotranspiration (P/ETP). The impact of climate changes was done by comparing the time periods of 1961–2000 with 2001–2016, at NUTS5 level where there is potential for crop irrigation. The results showed that for the time period of 2001–2016, the mean values of precipitations decreased down to 399 mm, and the potential evapotranspiration increased up to 716 mm. Therefore, the water deficit expressed as average value of the ratio P/ETP decreases from 0.594 to 0.557. There is a higher water deficit in most areas where the irrigation systems are present, and, therefore, the near future trend is to increase the water deficit over time.
INTRODUCTION
Although droughts are a
meteorological phenomenon, from a water management point of view, they are usually defined in the literature as the magnitude of the reduction in water supply, the normal variation in water supply, the impacts of the reductions, especially on human activities [1]. Prediction scenarios on climate changes for Romania exhibit a dramatic evolution
of the mean temperatures and
precipitations. It is expected that
precipitations will decrease and
temperatures will increase during summer season, which lead to potential conditions to increase the intensity and frequency of droughts [3].
During the last decades, the drought phenomenon has expanded as a result of
deforestation, destruction of forest
protection belts etc., which took place on most part of the land (agricultural and forestry). The potentially affected areas by desertification in Romania are mainly
located in Dobrogea, Muntenia and southern Moldavia regions. In these areas the main viable irrigation systems are also located.
Water resources and their quality are constantly decreasing with increasing aridity as a result of climate warming. According to some climate scenarios, the droughts will persist in areas with critical climate from Europe, and these regions will suffer from pronounced drought, heat waves, water shortage and reduced agricultural production [4].
The objective of this paper was to evaluate the trends of climate aridity of areas where irrigation systems are
present, based on meteorological
parameters such as precipitations,
196
The water deficit for agricultural crops was evaluated by calculating the ratio between elements that determine the water balance, namely the annual
precipitation (P) and potential
evapotranspiration (ETP) values for the time periods of 1961-2000 and 2001– 2016, and for the communes where there is potential for crop irrigation. The
potential evapotranspiration was
evaluated by using the Penman-Monteith method [2].
The average daily climate data for climatic parameters for the time periods of 1961–2000 and of 2001–2016 were
spatially distributed across each
administrative territorial unit (UAT), using the MARS methodology to provide
deviations from averages across a 10' x
10' longitude x latitude grid. The
evaluations of the trend of precipitations, potential evapotranspiration and water
deficit were done at commune level –
NUTS 5 fitted within the viable irrigation systems from Romania. The Arc GIS software was used for aggregation of data.
RESULTS AND DISCUSSIONS
Water deficit in agriculture can cause the farmer’s vulnerability to future climate changes, and is emphasized by problems encountered in irrigation field. Arable crops (including cereals and oil crops) are the most vulnerable to climate changes and the yields had declined
significantly in years with drought
conditions. Easily access to water resources is important in irrigation, but excessive fragmentation of half of the utilized agricultural area, together with
difficulties of creating functional
associations of water users, are real obstacles.
The actual irrigated area greatly varies from year to year depending on rainfall. It is estimated that about 11% of the agricultural area is covered by
regional differences, especially as a result of variable rainfall distribution and implicitly of irrigation requirements. North-west, west and center of the country require less irrigation water, while the southern and south-east parts of the country, water-affected areas, have a higher coverage with irrigation systems.
The obtained results for counties
where are irrigation systems are
presented in Table 1. It is noted that for the time period of 2001–2016, the rainfall presented as mean values for all counties decreased down to 399 mm, and the potential evapotranspiration increased up to 716 mm. Therefore, the water deficit expressed as an average value of the ratio between precipitation and potential evapotranspiration (P/ETP) decreases from 0.594 to 0.557. It can also be observed that the values of the variation interval of the precipitations decreased during the time period of 2001–2016 (290–758 mm) as compared to the time period of 1961–2000 (305–761 mm), whereas the values of the variation interval of the potential evapotranspiration increased during the time period of 2001– 2016 (692–748 mm) as compared to the time period of 1961–2000 (663–716 mm).
In the literature, the ratio between
precipitation and potential
197
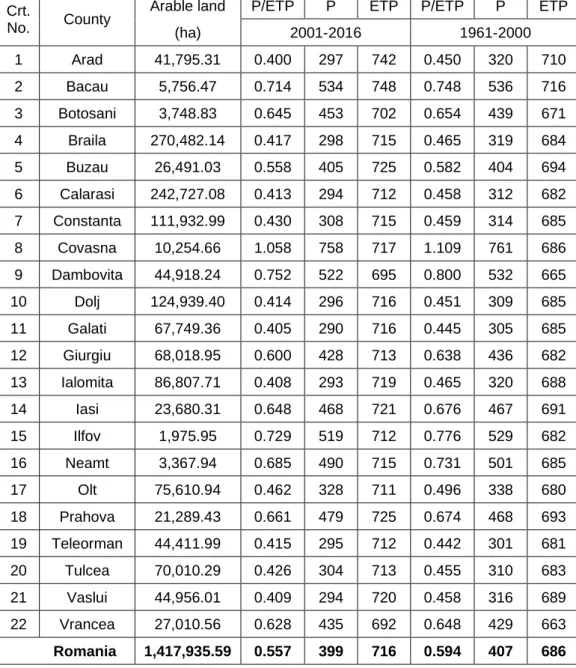
Table 1
Values of the annual precipitation (P, mm), annual potential evapotranspiration (ETP, mm) and of water deficit ratio (P/ETP) for
the time periods of 1961-2000 and of 2001-2016, for counties where there is actual potential for crop irrigation
Crt.
No. County
Arable land P/ETP P ETP P/ETP P ETP
(ha) 2001-2016 1961-2000
1 Arad 41,795.31 0.400 297 742 0.450 320 710
2 Bacau 5,756.47 0.714 534 748 0.748 536 716
3 Botosani 3,748.83 0.645 453 702 0.654 439 671
4 Braila 270,482.14 0.417 298 715 0.465 319 684
5 Buzau 26,491.03 0.558 405 725 0.582 404 694
6 Calarasi 242,727.08 0.413 294 712 0.458 312 682
7 Constanta 111,932.99 0.430 308 715 0.459 314 685
8 Covasna 10,254.66 1.058 758 717 1.109 761 686
9 Dambovita 44,918.24 0.752 522 695 0.800 532 665
10 Dolj 124,939.40 0.414 296 716 0.451 309 685
11 Galati 67,749.36 0.405 290 716 0.445 305 685
12 Giurgiu 68,018.95 0.600 428 713 0.638 436 682
13 Ialomita 86,807.71 0.408 293 719 0.465 320 688
14 Iasi 23,680.31 0.648 468 721 0.676 467 691
15 Ilfov 1,975.95 0.729 519 712 0.776 529 682
16 Neamt 3,367.94 0.685 490 715 0.731 501 685
17 Olt 75,610.94 0.462 328 711 0.496 338 680
18 Prahova 21,289.43 0.661 479 725 0.674 468 693
19 Teleorman 44,411.99 0.415 295 712 0.442 301 681
20 Tulcea 70,010.29 0.426 304 713 0.455 310 683
21 Vaslui 44,956.01 0.409 294 720 0.458 316 689
22 Vrancea 27,010.56 0.628 435 692 0.648 429 663
198
2001–2016, a number of 11 counties falls into the semi-arid zone, 5 counties falls into the dry sub-humid zone, and 6 counties falls into the humid zone. When compared with the time period of 1961– 2000, it can be seen that the number of counties in semi-arid and dry sub-humid areas has increased.
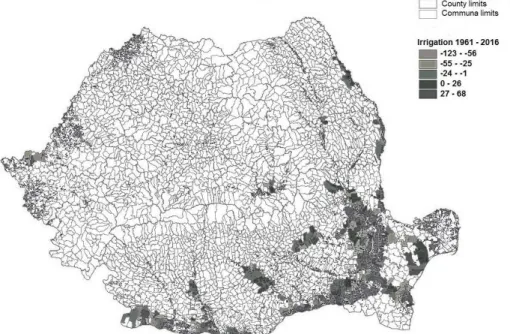
Figure 1 illustrates the evolution of annual precipitations (P) for the time period of 2001–2016 as compared to the time period of 1961-2000 at the territorial administrative unit (UAT) level (NUTS 5). It was observed that in many areas where there is potential for crop irrigation the annual precipitation (P) has decreased by 123 mm.
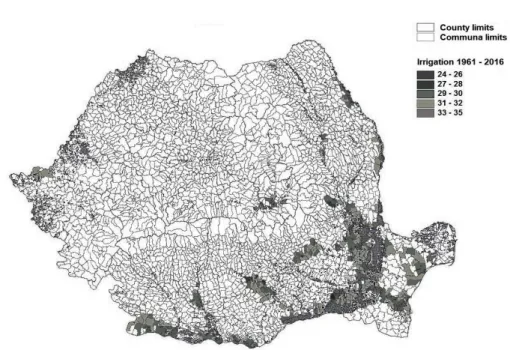
Figure 2 illustrates the evolution of the annual potential evapotranspiration (ETP) accumulated over the time period of 2001–2016 as compared to the time period of 1961–2000 at the territorial administrative unit (UAT) level (NUTS 5). It was observed that the annual potential evapotranspiration (ETP) has increased within the range of 24–35 mm in areas where there is a potential for crops irrigation.
of 2001–2016 as compared to the time period of 1961–2000 at the territorial administrative unit (UAT) level (NUTS 5). It was observed that the water deficit (P/ETP) has increased in most areas where there is a potential for crop irrigation in the range of 0.755–1.197 mm. There is a higher water deficit in the most areas of the viable irrigation
systems which require irrigation
application, and the trend in the near future is to increase the water deficit over time. Droughts can last from a few days to a few months, affecting the results of the entire year of agricultural production.
In a future time horizon, for example until the year of 2030, Romania will be affected in most of the agricultural areas by a severe water deficit. Through the efficient use of the water resource until the year of 2050, the agricultural areas of our country will be affected by an average water stress, and with a water exploitation index of 20–40 %.
199
Figure 2. Evolution of annual potential evapotranspiration (ETP) within the time period of 2001–2016 in comparison with the time period of 1961–2000, at communes
level (NUTS 5)
200 CONCLUSIONS
Evaluation of the trends of climate aridity of areas where irrigation systems are present, based on meteorological parameters (e.g. precipitations, potential evapotranspiration and water deficit as expressed by the average value of the ratio between precipitation and potential evapotranspiration) led to the following conclusions:
1. Irrigations are applied in areas that are located mostly within the main
irrigation systems from Muntenia,
southern Moldavia and Dobrogea
regions. Within these areas there is also a higher water deficit and the drought phenomenon has increased over time.
2. For the time period of 2001–2016, the rainfall presented as mean values for all counties decreased down to 399 mm, and the potential evapotranspiration increased up to 716 mm. Therefore, the water deficit expressed as an average value of the ratio between precipitation and potential evapotranspiration (P/ETP) decreases from 0.594 to 0.557.
3. In many areas where there is potential for crop irrigation the annual precipitation (P) has decreased by 123
mm, the annual potential
evapotranspiration (ETP) has increased within the range of 24–35 mm and the water deficit (P/ETP) has increased in most areas in the range of 0.755–1.197 mm.
BIBLIOGRAPHY
1. Maliva R.G., Missimer Th.M., 2012 -
Arid Lands Water Evaluation and
Management. Chapter 2: Aridity and Drought; Environmental Science and Engineering, Springer Verlag, Berlin
Heidelberg, ISBN: 978-3-642-29103-6,
pp. 21-39.
2. Monteith J.L., 1965 - Evaporation and
the environment. In: The state and
movement of water in living organisms,
XIXth Symposium of the Society for
Experimental Biology, Swansea,
Cambridge University Press, pp. 205-234. 3. Pravalie R., 2013 - Climate issues on aridity trends of southern Oltenia in the
last five decades. Geographia Technica,
no. 1, pp. 70-79.
4. Schwartz P., Randall D., 2003 - An Abrupt Climate Change Scenario and its Implications for United States National
Security, 22 p.; www.environmental
defense.org/documents/3566_AbruptClim ateChange.pdf.
5. United Nations Educational, Scientific and Cultural Organization (UNESCO), 1979 - Map of the world distribution of arid regions: Map at scale 1:25,000,000 with explanatory note. MAB Technical Notes 7, UNESCO, Paris. 6. Vizitiu O., Calciu I., Simota C., Mihalache M., 2014 - Soil water
conservation – a measure against
desertification. 14th International
Multidisciplinary Scientific
GeoConference SGEM 2014,
www.sgem.org, SGEM2014 Conference