THE QUALITY OF WHEAT FLOUR UNDER THE INFLUENCE OF
NITROGEN AND PHOSPHORUS DOSES
DODOCIOIU ANA MARIA1, MATEI GHEORGHE2, CAPRUCIU RAMONA1
1University of Craiova, Faculty of Horticulture,2University of Craiova Faculty of Agronomy
Keywords quality, wheat flour, nitrogen, phosphorus, doses.
ABSTRACT
Analysis of flour quality indicators, ie wet gluten, falling number, Zeleny sedimentation test, gluten deformation index, the glutenic index, farinograph test and alveograph test, are currently used in the baking industry in the EU and highlights the favorable effect of different fertilization systems on them.
Following the application of nitrogen fertilizers together with the phosphorus it is obtain a good quality flour.
INTRODUCTION
The quality of raw material in the milling industry presents particular attention because of its implications in the quality of the finished product. Owing to the uneven harvests wheat in recent years both in terms of quality and in terms of quantity, a particularly important aspect for this food sector is the correct analysis of quality of raw materials in order to orient it towards bakery and pastry products and for determining appropriate corrective methods for improving the quality of wheat flour obtained by grinding in order to obtain constant quality finished products.
It is well known that wheat quality can not be determined only from gluten content and its deformation index, requiring a more thorough qualitative assessment designed to provide information about the flour quality obtained by grinding.
Following the percentage distribution of flour quality, it is estimated that 75% is attributed to wheat quality parameters and 25% to milling process (Vizitiu 2012).
By administration of fertilizers, it can be managed the metabolism to the desired direction and can promote the accumulation of proteins, starch, sugar, fats, and other substances in plants (Babeanu 2008).
Wheat responds well to nitrogen fertilizers by increasing the protein content (Boldoni 1988).
In terms of quality, should not be omitted in the case of wheat, the baking qualities. Nitrogen fertilizers in doses up to 200 kg/ha increase gluten content, which has positive effect of increasing loaf volume (Moule 1991).
Doses of nitrogen fertilizers may be accompanied by harmful effects for plants and may be removed if a fraction of the dose of nitrogen was applied in the late stage of plant development, while vegetative growth is terminated, and nitrogen is used in the formation of the reproductive organs, and for synthesis of protein in the grain as reserve substance thus improving quality traits of flour (Mocanu 2013, Dodocioiu 2013).
MATERIAL AND METHOD
The experience was placed in 2014 on cambic chernozem, baticalcaric and the cultivated variety was Crina. In the framework of experience was followed the influence of nitrogen - phosphate interaction on the quality indicators of flour.
To better highlight how chemical fertilizers affect wheat quality, especially the flour obtained, there were made the following determinations:
- sedimentation test (Zeleny: ml); - gluten deformation index (mm); - glutenic index (mm);
-farinograph test: development time (min.), stability (min.);
-alveograph test: w-energy absorbed by stretching dough (Joules), P/L raport indicates the extent to which the dough is more extensible and more resistant.
RESULTS AND DISCUSSIONS
The interaction between nitrogen and phosphorus has had a more accentuated effect than unilateral applying of nitrogen or phosphorus fertilizers (Mocanu et al, 2012).
Interaction of nitrogen-phosphorus has a good influence on the falling time and respectively on the quality of wheat flour. Thus for P0N50…N100falling time is between
127-152, the flour falling in satisfactory bakery category.
Applying nitrogen fertilizer on P40, P80 or P120 background has the effect of
increasing sedimentation time and the quality of flour. So, for P40N200dose is 211 seconds
and for P80N100…N200 is 224-244 seconds, P120N50…N200 is 184-251 seconds, being for
these variants between 180-260 seconds and the flour is suitable for bakery products. Hence, from this point of view, moderate doses of nitrogen and phosphorus P80N100,
N150 give the same sedimentation time, 234-244 seconds, quality of the flour obtained
being conveniently, as in accordance with Table 1.
Nitrogen-phosphorus interaction influences best the wet gluten content. Thus while due to the use of phosphorus fertilizer in P40-P120 doses give a wet gluten content from
21.5 to 22.8% range, and from the use of different doses of nitrogen fertilizers is achieved a wet gluten content from 21.7 to 23.4%, from the use of fertilizers with phosphorus together with the nitrogen, wet gluten content values reach 22.3 to 25.8%, and the wheat flour passes from satisfactory quality to good quality.
Good quality wheat flour (22-24% wet gluten), is obtained due to the use of subsequent doses of fertilizer: P40N150…N200 - 24,3%; P80N100…N200 24,8 - 25,6%;
P120N100…N200- 25,1 - 25,8%.
And from this point of view, of wet gluten content, stands out those moderate doses of phosphorus P80 with moderate and large doses of nitrate N100, N150, leads to a high
content of wet gluten and good wheat flour in terms of quality.
At values between 20-60 ml flour is middle satisfactory, at values above 60 ml flour is good for bakery.
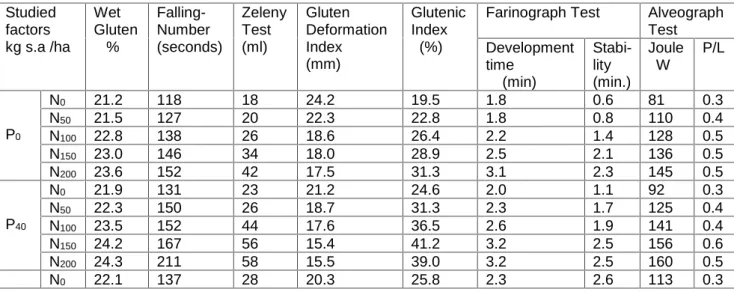
Table 1 The influence of nitrogen-phosphorus interaction on few quality indicators of flour
Studied factors kg s.a /ha
Wet Gluten % Falling-Number (seconds) Zeleny Test (ml) Gluten Deformation Index (mm) Glutenic Index (%)
Farinograph Test Alveograph Test Development time (min) Stabi-lity (min.) Joule W P/L P0
N0 21.2 118 18 24.2 19.5 1.8 0.6 81 0.3
N50 21.5 127 20 22.3 22.8 1.8 0.8 110 0.4
N100 22.8 138 26 18.6 26.4 2.2 1.4 128 0.5
N150 23.0 146 34 18.0 28.9 2.5 2.1 136 0.5
N200 23.6 152 42 17.5 31.3 3.1 2.3 145 0.5
P40
N0 21.9 131 23 21.2 24.6 2.0 1.1 92 0.3
N50 22.3 150 26 18.7 31.3 2.3 1.7 125 0.4
N100 23.5 152 44 17.6 36.5 2.6 1.9 141 0.4
N150 24.2 167 56 15.4 41.2 3.2 2.5 156 0.6
P80
N50 23.6 176 42 15.8 34.2 2.5 3.0 134 0.4
N100 24.8 224 61 15.0 42.8 3.5 3.2 155 0.4
N150 25.3 238 63 14.4 48.6 4.6 4.4 180 0.5
N200 25.6 244 60 14.1 46.3 4.8 4.5 182 0.5
P120
N0 22.9 149 29 19.4 36.1 3.0 3.0 121 0.2
N50 24.0 184 48 15.8 38.5 4.0 3.6 146 0,5
N100 25.1 229 59 14.0 51.3 5.4 4.5 174 0.5
N150 25.3 242 64 13.6 54.8 5.2 4.5 184 0.6
N200 25.4 251 66 14.2 56.7 5.8 4.3 181 0,6
Fig.1.The influence of nitrogen-phosphorus interaction on wet gluten content (%).
Sedimentation test (Zeleny).
Both Zeleny sedimentation index and glutenic index properly express bread quality of wheat. These indices associated with farinograph note and bread volume constitutes the basic element in assessing wheat for bakery products.
Analysis of this indicator from data contained in the table 1 revealed that it was influenced by the fertilizer dosages used.
Interaction of nitrogen-phosphorus contributes largely on the basis of this indicator at increasing the quality of wheat flour.
At the unfertilized N0P0, as we have seen Zeleny sedimentation index has values
below 20, flour being of low quality.
Applying nitrogen fertilizer on background P40, caused an increase in sedimentation
index at values 23-58, flour going into middleweight or satisfactory category.
Applying nitrogen fertilizer on background P80, resulted in a dramatic increase of the
sedimentation index value, in particular where were applied P80N100-61 ml, P80N150-63 ml
doses wheat flour moving in a better bakery category.
Close values for this indicator 64 - 66 ml are obtained using P120N50…P120N200
doses, but we believe that it is not necessary to use such large and non-economical doses which are leading to the same results of good quality flour, as when P80N100…N150.
moderate doses were used.
N0 N50
N100
N150 N200 P0
P40 P80
P120
0 5 10 15 20 25 30
P0
P40
P80
Fig.2 The influence of nitrogen-phosphorus interaction on Zeleny test (ml).
Gluten deformation index.
Gluten deformation is high if it is greater than 15 mm and this happens more often as bedbug attacks cereals introducing exogenous proteolytic enzymes in the grain.
If the deformation of the gluten index is less than 5 mm, the proteolytic activity is very low, gluten is very elastic and flour requires improvement with proteolytic enzymes or reducing agents. Instead of chemical reducing agents can be used yeast derivatives, which have endogenous proteases glutathione type, capable of causing a softening of gluten.
Deformation index of gluten was influenced by factors A, B, used in the experience presented.
Application of the different doses of nitrogen on P40 background has the effect of
lowering gluten deformation index to the values of: 17.6; 15.4; 15.5 mm, the lowest value 15.4 mm is obtained for P0N150 dose, flour passing in this situation at the satisfactory
category.
If nitrogen rates apply on P80 background, it is reached to a very low deformation
index 14.4-14.1 mm (P80N150; P80N200), flour passing into the good bakery products
category, which happens in case of using P120N100,N150, N200.
However, given the very close values of deformation index of gluten between P80N150 and P120N150 doses, it is recommended moderate doses P80N150 for a good quality
of the flour.
Glutenic index.
Interaction of nitrogen-phosphorus had a rather favorable effect in increasing the quality of wheat flour, so the P0 background only at N150 dose, flour has a satisfactory
quality with glutenic index 31.3% (Babeanu, 2010).
Application of the different doses of nitrogen on P40 background has led to
increased glutenic index at values between 31.3 to 41.2%. At doses P40N50…N200 flour
quality is satisfactory, while for P40N150flour is of good quality.
At N100, N150, N200 nitrogen application doses on P80 background, there was
obtained a good quality flour, with glutenic index over 30% (34.2 to 48.6%).
In case of application of nitrogen doses on P120 background, at the same nitrogen
doses abovementioned, is obtained a flour of good quality with glutenic index from 51.3 to 56.7%.
It follows from analysis of this indicator that using moderate doses of fertilizers
N0 N50
N100
N150 N200 P0
P40 P80
P120
0 10 20 30 40 50 60 70
P0
P40
P80
Farinograph test.
Nitrogen-phosphorus interaction had a favorable effect on the growth and quality of wheat flour. Thus on all backgrounds P40, P80, P120, even at small doses of nitrogen N50,
N100is obtained average quality flour.
In the case of P40N150, P80N150, or P120N150 doses are obtained high development
times and dough stability, so an average quality flour, being placed in the move towards strong quality flour.
Alveograph test.
Fertilizing with nitrogen and phosphorus further enhances flour quality indicators W and P/L, gaining values of 180-182 Joules at P80N150-N200 and P/L raport reaches 0.5-0.6
flour being classified under potentially bakery category. Likewise at higher doses P120N100
-N200.
CONCLUSIONS
Analysis of flour quality indicators, are wet gluten, falling number, Zeleny sedimentation test, gluten deformation index, the glutenic index, farinograph test and alveograph test, are currently used in the baking industry in the EU and highlights the favorable effect of different fertilization systems on them.
Wet gluten content has been changed favorably by moderate doses of nitrogen N100
- N150, applied on a background of moderate doses of phosphorus, P80, when it is obtained
24.8 to 25.3% wet gluten, flour being of good quality.
Falling number has values of a suitable quality flour (234-244 seconds) when
moderate doses of nitrogen and phosphorus are used, N100-N150 on P80 or P120
background.
Zeleny sedimentation test recorded, as a result of the interaction of nitrogen -phosphorus, N100-N150 on P80-P120 background, values of 61 - 63 and 59 - 64 ml (good
quality flour).
Deformation index of gluten, as a result of the application of nitrogen fertilizer together with the phosphor, reaches values of 15.4 to 18.6 at N50P40 and N150P40 and
therefore satisfactory flour, decreased to values below 15 (flour good for bakery products) when the following doses are used: N150- N200, P80, N100, N150, N200- P80.
The use of moderate doses of nitrogen and phosphorus, N100, N150 on P80
background contributed to obtaining good quality flour (glutenic index over 40%).
Farinograph test appreciated by two indicators of his: development time and stability, emphasized that without fertilizers, flour is of poor quality, at the use of fertilizers with phosphorus and nitrogen flour switches to medium quality, by the use of potassium and nitrogen fertilizers flour remains of poor quality and when using doses of P40N150,
P80N150or P120N150, flour is approaching a strong quality.
Alveograph test, by two indicators of its: value W (power dough) and the ratio between the power and extensibility (P/L) is positively influenced by phosphorus fertilizer (flour passing to quality flour good for biscuits) especially for the interaction with nitrogen and nitrogen - phosphorus, factors which make flour go from poor quality (at unfertilized or fertilized only with potassium) to a potential bakery flour.
BIBLIOGRAPHY Boldoni R., 1998 - L’ Italia Agricola nr. 7.
Babeanu C., Paunescu V. C., Paunescu G. - 2010 Characterization of high molecular weight glutenin subunits pattern in eight varieties of wheat by SDS-PAGE studies, Annals of the University of Craiova The Chemistry Series, vol XXXIX, No1, 57-59.
Dodocioiu Ana Maria, Nicolae Andreea, Balanescu Dumitru, Buzatu Gilda- 2013, Agrochemical characterization of soils from Olt county. Annals of the University of Craiova - Agriculture, Montanology, Cadastre Series, vol XLIII:145-150.
Moule C. - 1991, Phitotechnie Speciale II La Maison Rustique Paris.
Mocanu Romulus, Dodocioiu Ana Maria, Dobre Marian, 2013 - Managementul nutrientilor. Editura Sitech, Craiova, ISBN 978-606-11-3496-0.
Mocanu Romulus, Dodocioiu Ana Maria, Dobre Marian, 2012 - The effect of several fertilizer types on wheat yield and its quality, (Annals of the University of Craiova – Agriculture, Montanology, Cadastre Series) Vol. XLII,pp 372