109 All Rights Reserved © 2012 IJARCSEE
Abstract— Congestion avoidance techniques monitor network traffic load in an effort to anticipate and avoid congestion at common network bottlenecks. Congestion avoidance is achieved through packet dropping. Among the more commonly used congestion avoidance mechanisms is Random Early Detection (RED), which is optimum for high-speed transit networks. Random early detection (RED) is an active queue management algorithm. It not only detects but also avoids congestion by randomly dropping packets to notify congestion. The main objective of this paper is to comprehend the working of RED algorithm and to learn the effects of variation of RED parameters. To improve the performance of a network in terms of drop count, efficiency, throughput and delay we can optimize our choice of these RED parameters.
Index Term - Congestion, Delay, Drop count, RED, RED parameters, Throughput,
I. INTRODUCTION
Congestion occurs when the resource demands exceed the network capacity. At some point of time network buffers go full and packets are dropped. During congestion, the network throughput drops whereas end to end delay increases. In order to overcome this situation a congestion avoidance scheme must be employed. One such method is Random Early Detection (RED).
Random early detection (RED) is an active queue management algorithm. It is also a congestion avoidance algorithm. In the conventional tail drop algorithm, a router or other network component buffers as many packets as it can, and simply drops the ones it cannot buffer. If buffers are constantly full, the network is congested. Tail drop distributes buffer space unfairly among traffic flows. Tail drop can also lead to TCP global synchronization as all TCP connections "hold back" simultaneously, and then "step forward" simultaneously. Networks become under-utilized and flooded by turns. RED addresses these issues.
RED monitors the average queue size and marks packets. If the buffer is almost empty, all incoming packets are accepted. As the queue grows, the probability for dropping an incoming packet grows too. When the buffer is full, the probability has reached 1 and all incoming packets are dropped. Thus RED buffer mechanism with constant bit rate traffic can be used at an initial stage to understand the effect of change of network parameters over system performance.
RED aims to control the average queue size by indicating to the end hosts when they should temporarily slow down transmission of packets. RED takes advantage of the congestion control mechanism of TCP by randomly dropping packets prior to periods of high congestion, RED tells the packet source to decrease its transmission rate. Assuming the packet source is using TCP, it will decrease its transmission rate until all the packets reach their destination, indicating that the congestion is cleared.
The network designing and simulation here is
accomplished using NS2 (network simulator version 2). NS2 is an event-driven network simulator embedded into the Tool Command Language (Tcl).
An extensible simulation engine which is
implemented in C++ and is configured and controlled via a Tcl interface. A network topology is defined, traffic sources and sinks are configured, statistics are collected, and then simulation is invoked using the 'ns' command.
In general, C++ is used for implementing protocols and extending the ns-2 library. OTcl is used to create and control the simulation environment and also for selection of output data. Simulation is run at the packet level, allowing visualization of detailed results.
The network can be designed to implement bottleneck and packet drop scenario. Using the available tools of NS2 we can implement the network congestion avoidance algorithm Random Early Detection (RED), then by varying the RED parameters discussed in section II we can observe the effect on network performance.
Performance analysis of networks using RED
for congestion control
110 All Rights Reserved © 2012 IJARCSEE
II. DESIGNING THE NETWORK
There are four basic steps to design and simulate any network. First step is to develop a model (implementation of a protocol); second step is to create a simulation scenario (designing a network topology and traffic scenario); third step is to choose and collect statistics through simulation, and finally fourth step is to visualize simulation and analyze simulation results using awk scripting language.
As shown in Fig.1, a network with four nodes (Node0, Node1, Node2, Node3) has been designed. Node 0 and Node1 are sources with FTP aggents attached over TCP. Node 3 is the sink for both the source nodes. A link with appropriate link type, link capcity, buffer mechanism is to be defined between these nodes. In this network, a bottleneck between node2 and node3 is defined with RED as the buffer mangement scheme so that we can simulate packet loss and measure overall network perfomance, while link between node0 and node2 and between node1 and node2 would have be droptail mechnaism. The simulation time is kept large enough to demonstrate congestion behaviour.
Fig1. Network simulation window in NS2
In order to perfectly understand the RED algorithm we must be introduced to the basic RED parameters
The minimum queue threshold minth below which no
packets are dropped, maximum queue threshold
maxth above which all incoming packets are dropped,,
wq the queue weight factor which is used in
computing the average queue size. maxp the
maximum dropping probability.
The RED parameters set in our simulation were minimum threshold to5 maximum threshold to 15 maxp to 0.02 wq to 0.001 and queue size of 35.
III. RANDOM EARLY DETECTION ALGORITHM
The most distinct factor of RED is that it does not operate on instantaneous queue size its functioning is based on average queue size. When a packet arrives at the RED gateway it calculates the average queue size, using a low-pass filter with an exponential weighted moving average which is given by:
avg = avg + wq(q-avg)
The average queue size is compared to two thresholds, a minimum threshold and a maximum threshold. When the average queue size is less than the minimum threshold, no packets are marked they are enqued into the buffer. When the average queue size is greater than the maximum threshold, every arriving packet is marked and discarded. If marked packets are in fact dropped, or if all source nodes are cooperative, this ensures that ensures that the average queue size does not significantly exceed the maximum threshold.
When the average queue size is between minimum threshold and maximum threshold, each arriving packet is marked with the probability which is a function of average queue size avg. The initial
packet-marking probability pb is given as:
pb = C1avg - C2
C1 = maxp
maxth-minth
C1 = maxp* minth
maxth-minth
The parameters like minth and maxth are user
defined in the tcl file. While maxp and wq are
111 All Rights Reserved © 2012 IJARCSEE
bandwidth through the gateway. In order to do analysis awk files for delay and efficiency have been designed to calculate the same and verify the drop count to measure the performance of the network.
IV. REDPARAMETERANALYSIS
Signficance of maxp and wq
Packet marking probability is a linear function of the
average queue size. RED gateways perform best when
the packet marking probability changes fairly slowly
as the average queue size changes.If maxp is set to
1/50 then when average queue size is halfway
between minth and maxth the gateway drops on an
average one out of fifty arriving packets.
The weight wq determines the time constant of low
pass filter The calculation of the average queue size
can be implemented particularly efficiently when wq
is a negative power of two.
Analysis by varying Minimum Threshold
In the network link between the nodes 2 and 3 is designed with bottleneck and the queuing mechanism is RED and when minimum threshold of this buffer is changed from 1 to 14 keeping other parameters mentioned in section II constant we observe that efficiency goes on reducing as the number of dropped packets goes on increasing.
Fig 2 Minimum threshold v/s Efficiecny
A low minimum threshold achieves high efficiency. But a very low minimum threshold would result in under utilization of link and buffer so one must
appropriately choose minth
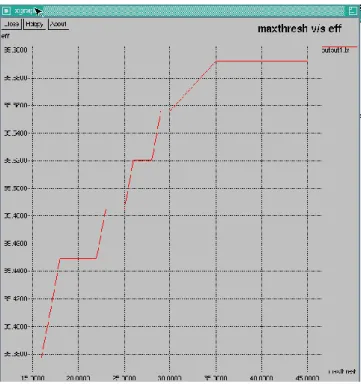
Analysis by varying Maximum Threshold
If we vary the maximum threshold of the bottleneck link buffer from 16 to 30 we see that the efficiency increases in steps, while doing so the other parameters of RED are kept constant.
Fig 3 Maximum threshold v/s Efficiecny
Thus we observe from the graph above that higher the maximum threshold better is the efficiency so we must choose a very high maximum threshold. But while doing so if we choose a value that approaches instantaneous queue size RED gets much shorter period to notify congestion to sources and congestion can still occur.
112 All Rights Reserved © 2012 IJARCSEE
level. The optimal value for maxth depends on the maximum average delay that can be accepted by the network. Maximum threshold should be at least twice the minimum threshold. For a queue size of upto 50 min and max threshold values opted are 5 and 15.
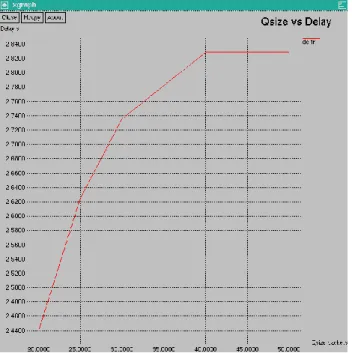
Queue Size Variation
For this set of analysis all the RED parameters were kept constant and queue size was varied. When the queue size grows it was observed as shown in Fig. 4 that the efficiency too grows but at the same time it was observed as shown in Fig. 5 that the end to end delay also increases. This increase in average delay is an undesired phenomena thus there should be a tradeoff between maximizing throughput and minimizing delay.
Fig 4 Queue Size v/s Efficiecny
RED gateways can control the average queue size while accommodating transient congestion, RED gateways are well suited to provide high throughput and low average delay in high speed networks with TCP connection that have large window sizes.
Fig 5 Queue Size v/s Delay
V. CONCLUSION
The greatest advantage of RED is instead of using instantaneous queue length RED gateway uses average queue size short term increase in the queue size that result from bursty traffic or from transient congestion do not result in a significant increase in the average queue size. The only maybe drawback of RED would be it completely relies upon a TCP based networks since it expects co-operation from the sources to reduce their transmission rate when congestion occurs which would be possible only through TCP's window mechanism.
For RED to function efficiently it is very essential to choose optimum values for maximum threshold and minimum threshold although these depend on average queue size and the accepted level of delay.
The gateway marks the packets at fairly evenly spaced intervals, in order to avoid biases and avoid global synchronization, and to mark packets sufficiently frequently to control the average queue size.
VI. REFERNCES
[1] Introduction to Network Simulator NS2,
Springer Science + Business Media, LLC, 2009
[2] The ns Manual (formerly ns Notes and
113 All Rights Reserved © 2012 IJARCSEE
[3] NS Simulators for beginners, Lecture notes
2003-2004, Etian Altaman.
[4] Floyd, S., and Jacobson, V., Random Early
Detection gateways for Congestion
Avoidance V.1 N.4, August 1993.
[5] A study of TCP RED congestion control
using RED, Arjit Ganguly, Pasi Lassila, July 2001.
[6] Throughput
http://en.wikipedia.org/wiki/Throughput
[7] Packet and network delay
http://en.wikipedia.org/wiki/Network_delay
[8] AWK