Houston Home Energy Efficiency Study
December 16, 2009
Advanced Energy
909 Capability Drive, Suite 2100 Raleigh, NC 27606-3870
Authors
Shaun Hassel, Advanced Energy
Michael Blasnik, M. Blasnik & Associates (Data Analysis) Benjamin Hannas, Advanced Energy
Sponsoring Organizations
U.S. Environmental Protection Agency CenterPoint® Energy
Advanced Energy
Contributors of Data and Reviewers Colby Swanson, BASF Corporation
Zak Shadid, U.S. Environmental Protection Agency Melissa Malkin-Weber, Advanced Energy
Jennifer Carter, Masco Contractor Services, Environments for Living Cindy Revelle, Masco Contractor Services, Environments for Living Brad Townsend, Masco Contractor Services, Environments for Living Cheryl Bowman, CenterPoint Energy
Sam Rashkin, U.S. Environmental Protection Agency ENERGY STAR Homes Program John Tooley, Advanced Energy
Mark Curry, Energy Sense Brannon King, DPIS Engineering Don Tippet, Energy Smart Camden Watts, Advanced Energy David Drew, Louisiana Pacific Kelly Parker, Guaranteed Watt Savers Frank Aranza, DOW Building Solutions Maci McDaniels, Fox Energy Specialists
Table of Contents
Executive Summary ... 1
Introduction ... 6
Background ... 6
Houston Building Market Overview ... 9
Study Objectives ... 11 Study Design ... 12 Study Limitations ... 12 Data Collection ... 13 Data Sets ... 13 Sources of Information ... 15
Identifying “Baseline” Homes ... 17
Self-Selection Bias, Free Riders and Spillover ... 19
Energy Usage Data: Weather Normalization ... 21
Data Merging and Sample Attrition ... 23
Adjusting for House Size ... 25
Construction Characteristics by Group ... 28
Data Analysis and Discussion ... 29
Electric Usage: Findings ... 29
Electric Usage: Construction Year Effects ... 30
Electric Usage Differences, Reference Homes and Spillover Effects ... 34
Electric Usage: Baseload ... 36
Electric Usage: Builder Effects ... 37
Electric Usage: Further Analysis - Regression Modeling ... 38
Electric Usage: Accuracy of REM/Rate Predictions ... 40
Gas Usage: Findings ... 44
Gas Usage: Further Analysis ... 46
Gas Usage: Builder Effects ... 47
Conclusions ... 48
All New Homes in Houston Are More Efficient Than in the Past ... 48
Usage Differences between ENERGY STAR and Baseline homes are small ... 49
REM/Rate Accurately Predicts Heating and Cooling Loads, on Average ... 50
Recommendations ... 51
Works Cited ... 53
Website Resources ... 55
Appendix ... 56
List of Figures
Figure 1: Average summer/cooling energy intensity by floor and envelope area ... 26
Figure 2: Average annual electric energy intensity by floor and envelope area ... 27
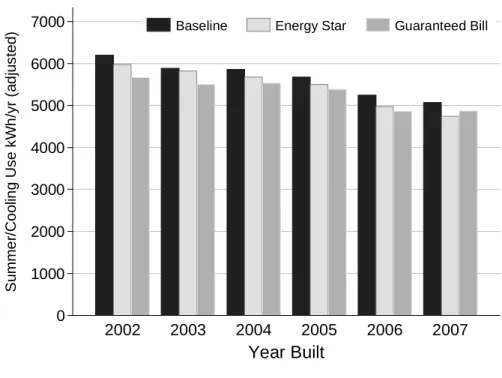
Figure 3: Trends in 2008 summer/cooling loads by construction year ... 32
Figure 4: Summer/cooling loads by year of usage and year of construction ... 33
Figure 5: Baseload usage by year of usage and year of construction ... 34
Figure 6: Summer/cooling usage trends by builder and year of construction ... 38
Figure 7: REM/Rate projected cooling loads versus actual cooling loads ... 41
Figure 8: Modified box plot of REM/Rate projected cooling loads ... 42
List of Tables
Table 1: Home design characteristics ... 14
Table 2: Summary of data sources ... 16
Table 3: Disposition of homes in final data set ... 24
Table 4: Characteristics for RESNET reference, baseline and ENERGY STAR homes ... 28
Table 5: Electric usage analysis – sample characteristics and usage summaries ... 29
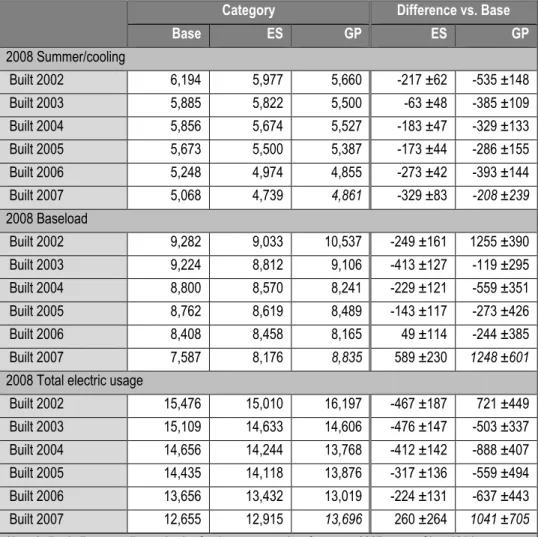
Table 6: Difference in energy use from baseline homes (adjusted for size but not vintage) ... 30
Table 7: Electric usage by year of construction (2008 kWh/yr, envelope area adjusted) ... 31
Table 8: Statistical comparison of the REM/Rate projects and billing analysis results ... 43
Table 9: Gas usage analysis – sample characteristics and basic usage summaries ... 44
Executive Summary
The objective of the Houston Energy Efficiency Study was to assess the actual energy use of groups of homes built to different energy efficiency specifications in Metropolitan Houston – typical non-program (baseline) homes, ENERGY STAR® homes and guaranteed performance homes. More than 226,000 homes built from 2002 through 2007 by dozens of different production builders were included in this study. The large dataset also provided the opportunity to analyze how certain construction characteristics are related to actual energy usage.
Key findings from this study include:
► All homes in Houston have become more energy efficient over time ► Usage differences between the three groups of homes were small
► Modeling predictions of the energy usage of ENERGY STAR homes are reasonably accurate
► Regression modeling provided some more detailed results on construction practices
Background
Data collected for this project included billing data for all new homes built in the CenterPoint utility service territory from 2002 through 2007, information from property assessor databases of four counties, detailed building characteristics for tens of thousands of ENERGY STAR homes from CenterPoint’s ENERGY STAR Homes tracking database, and detailed data files from energy raters including REM/Rate input files and building shell and duct leakage test data. The study did not involve any direct data collection in the field but instead relied upon existing data sources. This approach allowed the scope of the study to be much larger in terms of the number of homes analyzed but left some gaps in our understanding of some details, especially of baseline homes. The overall dataset includes hundreds of variables for 226,873 homes, including 114,035 potential baseline homes, 106,197 ENERGY STAR homes and 6,641 guaranteed performance homes. All of the guaranteed performance homes analyzed in the Houston market were also ENERGY STAR certified. The study team applied a set of criteria to define a “Good” home for the analysis based on having sufficient data to make comparisons. Further criteria were used to define analysis groups with sufficient electric and gas usage data for analysis.
All homes in Houston have become more energy efficient over time
Energy use for new homes in Houston dropped dramatically across all three groups built from 2002 through 2007. The total energy use decreased on average across all groups by 16 percent from
homes built in 2002 to homes built in 2007, which included a drop in both baseload usage and summer/cooling usage. These drops in usage appear to be explained by three factors:
► Establishment of a statewide residential energy code in 2001
> Required low solar gain windows and better insulated and tighter ducts
> Compliance with the new code undoubtedly improved during the first couple of years for baseline homes, which could account for a continuing decrease over a few years
► Change in federal air conditioner efficiency standards from SEER 10 to SEER 13 in 2006 ► Influential “spillover” effects of high-performance home programs and initiatives adopted
throughout the Houston market, including but not limited to: > Programs and incentives
> Training and technical support > Home energy rater infrastructure
These changes across all houses over time both complicate and help illuminate some of the differences between ENERGY STAR and baseline home performance. The differences also shed light on the effectiveness of changing building codes to save energy.
Usage differences between the three groups of homes were small
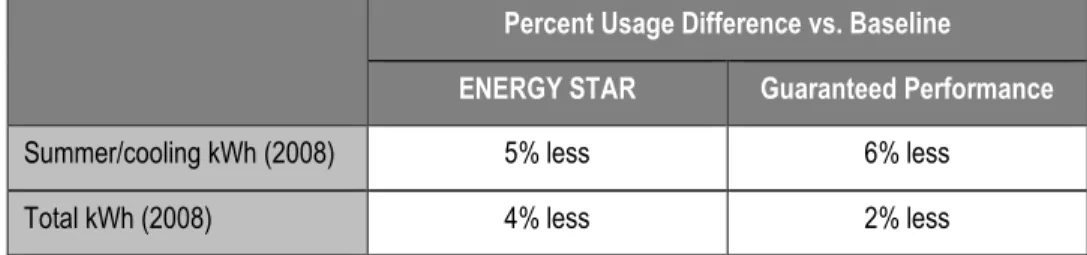
The data reveal all groups of homes in Houston experienced a decline in electricity consumption across construction year, and that differences in overall usage and summer/cooling usage across different groups of homes were small – only about a 5 percent difference in summer/cooling use for ENERGY STAR homes compared to baseline homes, and a 6 percent difference for guaranteed performance homes. Two primary reasons were identified that explain why the difference in usage is small:
► Typical construction practices in baseline homes were considerably better than the code-minimum HERS reference home, especially with respect to air conditioner efficiency ► ENERGY STAR home program testing of duct systems, and perhaps building envelope
leakage, may have affected standard trade practices, creating “spillover” savings in the baseline homes
Modeling predictions of the energy usage of ENERGY STAR homes are reasonably accurate Although consumption differences across groups of homes are smaller than advertised, ENERGY STAR homes perform very close to the predictions of the models on average, while baseline homes perform better than the reference homes defined by the HERS standard.
Utilizing REM/Rate cooling load projections from 10,258 homes with electric usage results, the study team found that the REM/Rate projected average cooling load of 5,506 kWh/yr was 3 percent higher than the billing analysis average cooling load of 5,677 kWh/yr. REM/Rate also estimated the average heating usage of program homes fairly well – only 4 percent lower than the measured loads.
Although the analysis found no systematic bias in the REM/Rate cooling projections, there was a large amount of variability in the data. It was found that the vintage and square footage of the home were as good of predictors of energy usage as the REM/Rate projections. However, the median absolute discrepancy between the REM/Rate cooling projection and the billing analysis result was just 17.5 percent and nearly two-thirds of the homes were within 25 percent. Overall, there is a fairly strong and consistent relationship between actual and projected performance using REM/Rate for both heating and cooling in new homes in Houston.
Regression modeling provided some more detailed results on construction practices Regression modeling of homes with REM/Rate files was used to explore patterns in energy usage across homes and also to assess some technical performance issues. The regression analysis found:
► Savings from higher SEER air conditioners are generally consistent with simple projections based on the SEER ratings, although perhaps declining a little for SEER 15 units
► About two-thirds of the reduction in summer/cooling loads for ENERGY STAR homes from 2005 to 2007 can be accounted for by changes in SEER ratings, implying that one-third of the decline is due to other changes
► Building envelope leakage appears to be responsible for about 14 percent of summer/cooling loads while duct leakage only appears to account for about 3 percent of summer/cooling loads
► Radiant Barrier roof sheathing appears to reduce summer/cooling loads by about 3 percent of summer/cooling loads
► Cooling loads appear to increase by 0.13 kWh per annual kWh of electric baseload (waste heat from plug loads, etc.)
► Electric baseload usage is strongly related to the size of the home and also to its assessed value
Conclusions
The combination of increased standards coupled with considerable cooperation in the marketplace toward a common goal of reducing energy use across all homes has resulted in a significant increase in the energy efficiency of new homes built in the Houston market. The relevant standards included a new statewide energy code, increased federal SEER standards and the ENERGY STAR new homes program. The cooperation included proactive programs by the electric utility (CenterPoint) to support ENERGY STAR, an active private guarantee program (Masco’s Environments for Living) that requires its homes to meet ENERGY STAR standards and an aggressive and well-trained network of home energy raters. This result should provide a blueprint for future development of high performance homes programs.
This is the second study that has reached a similar conclusion. The Phoenix Home Energy Efficiency Study (Advanced Energy, 2005) followed a broadly similar approach of evaluating groups of homes built to different efficiency standards. A total of 7,141 houses with usage data were analyzed in Phoenix. One of the key findings was that many baseline homes were built essentially to ENERGY STAR specifications without receiving the ENERGY STAR label – the homes had many of the same components (e.g., windows and air conditioners). This has the effect of reducing the energy usage differences between the groups. The Phoenix market was similar to Houston in that there was significant cooperation in the marketplace among ENERGY STAR, the major electric utility, private guarantee programs and the local energy rater infrastructure.
A key component of the definition of “energy savings” is the base case that is used to calculate the savings. ENERGY STAR uses a base case reference home defined as minimum local code specifications combined with the least efficient cooling, heating and hot water systems available, a leaky building envelope and a poor duct system. Using this yardstick to measure the performance of the ENERGY STAR houses in the study, they did quite well – showing a strong and fairly consistent relationship between actual and projected performance for both heating and cooling. Therefore the apparent lack of savings is attributable not to underperformance by the ENERGY STAR homes but to the fact that the baseline houses in Houston perform considerably better than the ENERGY STAR reference house.
ENERGY STAR has played an important role in influencing standard construction practices in residential buildings. For example, the ENERGY STAR program brought duct leakage testing and building envelope leakage testing into widespread use in the new construction market in Houston. This testing is likely to have contributed toward the common use of better duct installation and building framing practices so ENERGY STAR homes would pass the test requirements. Contractors then applied these same approaches to all new homes. This phenomenon is referred
The usage data indicated that new homes in Houston have become considerably more efficient in terms of cooling loads throughout the period 2002 through 2007, and ENERGY STAR has been crucial to this improvement. The small difference in usage between ENERGY STAR and baseline homes in Houston may not be an indicator of small program impacts but could instead be an indicator of widespread program spillover. Although we are unable to measure the exact impact of this spillover, it is clear that market transformation has taken place in Houston, positively impacting the new construction industry and delivering benefits to consumers.
Introduction
This report documents the methodology and findings of the Houston Home Energy Efficiency Study, performed by Advanced Energy and sponsored by the U.S. Environmental Protection Agency and CenterPoint Energy. The purpose of this study is to assess and compare energy consumption patterns of homes built to three different energy-efficiency standards – baseline homes, ENERGY STAR homes and guaranteed performance homes.
Background
The United States, with 4.6 percent of the world population, accounts for 21.7 percent of the primary energy consumption of the world. Housing alone accounts for 21 percent of the primary energy consumption of the United States and 37 percent of the electrical demands of the nation. Furthermore, electrical consumption in houses is expected to grow 39 percent between 2010 and 2020 (U.S. Department of Energy, 2004). This increased demand for electricity results in a host of different challenges: increased utility costs, electricity reliability and distribution issues, and growing environmental concerns associated with building additional electricity generation capacity.
During the past several decades, rising energy prices in particular have driven a demand for more energy-efficient homes. Builders initially responded with simple energy-saving remedies: increased insulation, double-paned glass, tighter door seals and higher efficiency HVAC equipment. Recent advancements in building science, building practices and materials technology have provided more sophisticated and effective methods of providing energy savings. These methods include improved duct sealing, infiltration barriers, low emissivity glass and compact fluorescent lighting. Each of these measures, in theory, should help reduce overall home energy usage. However, factors such as homeowners’ lifestyles (with respect to energy use), effective installation of building materials and HVAC systems, increasing average home sizes and other factors make it difficult to assess the actual impact these energy conservation methods have on lowering home energy bills nationwide.
In an effort to promote energy-efficient new homes and reduce the emissions associated with home energy use, the EPA launched the ENERGY STAR qualified new homes program. The program established guidelines for building energy-efficient buildings and developed partnerships with homebuilders to construct energy-efficient homes. It was reasoned that ENERGY STAR qualified homes would offer consumers a recognizable brand that delivered dependable savings on their monthly energy bills while reducing overall energy consumption and the impact of residential sector energy use.
To qualify as an ENERGY STAR home, construction plans and building components must meet specific criteria for energy performance. Two methods can be used to assess predicted energy consumption: computer energy simulation modeling or prescriptive construction standards approved by the EPA. In Houston nearly 100 percent of the ENERGY STAR homes built are modeled with software to demonstrate they will meet the EPA ENERGY STAR guidelines.
This computer modeling produces a HERS (Home Energy Rating System) score that indicates the predicted energy performance of the home as compared to a reference home built to the local energy code. The HERS score is expressed on a scale of 0 to 100, with 100 being the assumed score of the code-built reference home. Every one-point reduction in the HERS score below 100 indicates a 1 percent decrease in predicted energy consumption. Therefore, a lower score presumes a more energy-efficient building. Since the ENERGY STAR home must be 15 percent more energy efficient than the reference home, it must achieve a HERS score of 85 or less to receive the ENERGY STAR label. The first version of the ENERGY STAR program employed a similar modeling methodology but presented the HERS score with a different scoring system. Homes built under this first version of ENERGY STAR were projected to use 30 percent less energy than the reference home. The second version of ENERGY STAR was implemented in July of 2006.
Once the building plans meet the necessary construction criteria, the presence of specific components and the effectiveness of their installation must be certified by an independent third-party professional, most commonly a HERS Rater. The typical ENERGY STAR home must pass a minimum of two field tests – duct and house envelope leakage testing – to ensure that actual construction performance matches the computer modeling in terms of house envelope leakage and duct leakage. To date there are approximately one million ENERGY STAR labeled homes nationwide.
More recently, several organizations – Masco Corporation with their Environments for Living program (Masco Corporation, 2008), General Electric with their homes inspired by ecomagination program (General Electric, 2009), Tucson Electric Power with their Guarantee Home program (Tucson Electric Power, 2008) and Advanced Energy with their SystemVision program (Advanced Energy, 2009) – have been promoting the construction of guaranteed performance homes. These homes are designed to go a step beyond the ENERGY STAR program, using advanced building science materials and techniques to lower home energy use even further. For guaranteed performance homes, the standards and testing protocol are even more stringent than ENERGY STAR in order to ensure increased energy performance.
To offset the slightly higher cost of these guaranteed performance homes and enhance their marketability, the builders or program administrators guarantee the annual energy usage for heating and cooling the home will not exceed a certain average level or the excess costs will be refunded to the homeowners. The programs also include a comfort guarantee that compliments the heating and cooling usage guarantee. To date, more than 130,000 houses have been built and certified to the guaranteed performance standards nationwide (Masco, SystemVision and Tucson Electric Power).
Historically, billing data for these homes (baseline, ENERGY STAR, guaranteed performance) have not been collected and analyzed to determine how the homes have performed while occupied under real-world conditions. A handful of studies have analyzed actual energy bills in an effort to evaluate the performance of various new home energy standards. In 2000, an Arizona State University (ASU) thesis study (Bashford, May 2000) conducted in Phoenix, Ariz., examined the energy consumption of 291 homes, comparing ENERGY STAR homes to non-ENERGY STAR (baseline) homes, both with and without pools. The report concluded that ENERGY STAR homes in the study used only 2.3 percent less energy per square foot than the baseline homes, a much smaller savings than anticipated. However, the sample size of the ASU study was too small to be indicative of the market at large. It also was not a random distribution of all ENERGY STAR or baseline homes.
The first statistically significant research effort evaluating end-use data in ENERGY STAR homes was completed in 2002 by the Energy Center of Wisconsin (Pigg, 2002). Utilizing billing histories and homeowner surveys, the report compared energy use between a group of approximately 100 Wisconsin ENERGY STAR homes built in 1999 and 2000 to a similar group of 170 randomly recruited non-program homes built during the same time period. The results indicated that on average, Wisconsin ENERGY STAR homes program participants used 9 (±6) percent less natural gas compared to a typical new Wisconsin home. While statistically significant, the savings were lower than prior expectations.
The primary reason for the smaller savings was the presence of high-efficient furnaces in the non-program homes. The models used to predict energy consumption differences between ENERGY STAR and non-program homes assumed that any non-program home would be built with a low-efficiency furnace. However, survey data and furnace distributor tracking data indicate that high-efficiency furnaces are installed in 83 percent of all non-program homes in Wisconsin, resulting in less natural gas usage in non-program homes than predicted by the models. This study was the first to show that the assumptions about the components and construction practices used when
building non-program homes, often referred to as baseline homes, can be inaccurate when compared to what is actually being constructed in any given market.
In 2003, the EPA determined it was necessary to complete their own study comparing the energy use of ENERGY STAR homes to non-participating homes. The Phoenix, Arizona, market was selected because it had an extensive stock of new homes, cooperative builders and home energy raters, as well as supportive local utility companies. In addition to being an early adopter of the ENERGY STAR program, Phoenix also provided a large number of guaranteed performance homes, thus allowing for an additional discrete group of homes to analyze and compare to baseline and ENERGY STAR homes.
The Phoenix Home Energy Efficiency Study (Advanced Energy, 2005) included a much larger and more diversesample sizethan previous studies. A total of 7,141 houses, including 3,336 baseline homes, 2,979ENERGY STAR homes and 826 guaranteed performance homes were analyzed. In addition to energy use profiles, information on square footage, number of stories, vintage, orientation, existence of a pool and other general characteristics were collected.
The effects of variables were limited by creating similar subsets of homes. The mostcomparable subset suggested that the ENERGY STAR homes on average used 3.50 kWh/ft2,compared to 4.16 kWh/ft2 for typical baseline homes. This represents a savings of 16 percent for summer/cooling intensity. The same subset of guaranteed performance homes consumed 2.80 kWh/ft2on average, which is 33 percent lower summer/cooling intensity than thetypical baseline homes and 20 percent below ENERGY STAR homes.
While the results of the study were statistically valid and showed a clear difference in usage across all three categories of homes, the definition of the groups of homes was intentionally biased. A number of homes that were not participating in any program but were shown to essentially meet the ENERGY STAR standard were treated as a separate baseline group. This was done because none of the groups of homes were randomly selected. So while the Phoenix Study showed that energy savings were being achieved across distinct programs with different standards, there is still a need to conduct studies utilizing real-world data that meet the following criteria: develop a data set representative of all of the homes built to different standards in a given market and randomly select an unbiased and statistically significant number of homes from each group.
Houston Building Market Overview
Metropolitan Houston has become one of the largest markets in the country for new housing construction, with more than 350,000 new home starts since 2000. This level of activity is
comparable to the largest single-family construction markets in the nation. Construction by production builders makes up about 50 percent of the new construction market in Houston, with many national residential homebuilders working in the area. And Houston, like Phoenix, also has a well established network of home energy raters, as well as a large proportion of high-performance homes, including ENERGY STAR.
The Houston market was an early adopter of the ENERGY STAR label and currently has one of the highest market shares in the nation with more than 50 percent of new homes in 2008 certified as ENERGY STAR. Three important factors have driven builder support for ENERGY STAR in Houston: a supportive local utility company, an established network of HERS raters and the establishment of state energy codes in Texas for residential building in June of 2001. The utility has supported the ENERGY STAR label since 2001 through substantial marketing efforts and by partially subsidizing the cost to builders for participating in ENERGY STAR, furthering the acceptance of energy-efficient homes.
Another factor that may have contributed to the high market share of ENERGY STAR homes in Houston was the establishment of statewide energy codes for residential buildings that paralleled the development of the CenterPoint ENERGY STAR for New Homes program. Until 2001, Texas had no energy code for new residential buildings. However, in June 2001 the Texas legislature successfully passed Senate Bill 5 (SB 5), which established energy codes for residential and commercial buildings statewide. Also known as the Texas Emissions Reduction Act, this rule was passed to create fundamental improvements in energy use in an effort to help the state comply with Clean Air Act standards.
For the residential sector, this new energy code meant home builders were required to adopt the energy-efficiency requirements set forth in the 2000/2001 International Energy Conservation Code (IECC) and the International Residential Code (IRC) Chapter 11. In response to this, the Texas Energy Partnership was established. The partnership is a concerted effort by state and federal organizations, local jurisdictions and others to help cities and counties adapt to energy codes. These cities and counties in turn helped builders and developers meet the new residential energy code by allocating resources effectively and developing new building plans.
Utilities and home performance companies also helped builders meet the code with a variety of services, such as the ENERGY STAR qualified homes program. ENERGY STAR provided a route to meet the new code while also providing motivation to go beyond the code in the form of cash incentives and market differentiation. As a result, it is possible that the establishment of new
residential energy codes persuaded a number of builders to voluntarily adopt the ENERGY STAR program.
As the market share of ENERGY STARhomes grew in Houston some builders began to look for new ways of differentiating their homes. The guaranteed performance labels from various organizations provided them with the opportunity to take a step beyond ENERGY STAR in terms of energy performance without having to sacrifice many of the benefits they received from their participation in the ENERGY STARprogram – independent third-party testing and certification as well as the day-to-day support of a building performance professional. In fact, many of the HERS raters in Houston certify both the ENERGY STARand guaranteed performance homes as part of their services to builders.
These programmatic adoptions allowed Houston to be one of the first areas in the country to realize significant market penetration of energy-efficient home construction with large populations of baseline, ENERGY STAR and guaranteed performance homes. Given that these programs have been operating in Houston for more than five years now, Houston offers an excellent opportunity to verify energy consumption data on the three home types under real-world conditions. Also, Houston would serve as the first chance to use billing analysis to assess the performance of the ENERGY STAR program in a hot-humid climate.
In terms of the strategies employed to maximize energy savings in this geographic area and climate at a reasonable cost, most builders in the area focus on energy-efficiency improvements related to the following items:
► Higher performance windows
► Higher performance HVAC equipment (SEER rating) ► Properly installed insulation
► Reduced duct leakage Study Objectives
This study was structured to compare the actual energy usage of baseline homes, ENERGY STAR qualified homes and guaranteed performance program homes. The study looks at real data and real energy performance of thousands of occupied houses, not computer models. The results of the study could then be used to answer several fundamental questions about the effectiveness of these efficiency programs:
► How much energy did the baseline, ENERGY STAR and guaranteed performance homes actually consume?
► How much energy savings are realized by ENERGY STAR and guaranteed performance homes, compared to similar baseline homes?
► Has the implementation of energy efficiency programs in new home construction resulted in a reduction of total energy consumption?
Study Design
More than 226,000 homes built from 2003-2007 by dozens of different production building companies were included in this study: 114,000 baseline homes, 106,000 ENERGY STAR homes and 6,600 guaranteed performance homes. Energy use histories for the homes were provided by CenterPoint Energy over the periods of 2002 through 2008. County appraisal records were used to identify those homes with swimming pools and to collect additional information about building size and other characteristics. The local energy raters and CenterPoint Energy provided additional data about the construction details of ENERGY STAR homes.
Study Limitations
The study did not involve collecting any original field data about the homes. This limitation was not significant for the ENERGY STAR and guaranteed performance homes since the utility and raters were able to provide many details for these homes. But the lack of data collection limited our understanding of the baseline homes, where we primarily had to rely on basic house information contained in property assessor databases, construction requirements of the local energy code, as well as anecdotal information from builders, raters and product manufacturers. We had no measured data on air conditioner SEER or building shell or duct leakage for any of the baseline homes.
One additional factor not addressed by this study is the impact of the energy consumption habits (lifestyle) of the home occupants on overall energy use. Lifestyle choices can result in wide variances in the total energy use of a home. To account for this variability, the authors used a statistically large sample of homes to diffuse the impact of the lifestyle variable on the results of the study. It is assumed that the range of homeowner behavior is equally represented across all three categories of homes.
Data Collection
Data Sets
From the many sources of information included in this study, data were compiled and analyzed based on the following three categories:
► Baseline homes
Baseline homes were not built as part of any high-performance home program, but their construction specifications could be similar to those of program homes. It is important to note that a baseline home should not be referred to as a “code” home. A true “code” home rarely gets built. Most builders may voluntarily or inadvertently choose above-code components such as air conditioners, windows or water heaters based on availability of the components. The baseline homes, instead of being viewed as a “code” home or reference home, should be viewed as any home not built to a specific energy efficiency program for purposes of the study.
► ENERGY STAR homes
ENERGY STAR homes meet or exceed the energy-efficiency standards set by the EPA ENERGY STAR program. By definition, ENERGY STAR qualified homes built from July 2006 to present are independently verified to be at least 15 percent more energy efficient than a reference home built to 2004 International Residential Code (IRC) or the applicable state energy code, whichever is more rigorous. ENERGY STAR homes built before July 2006 were projected to be 30 percent more efficient than the reference home. These savings are based on heating, cooling and hot water energy use.
► Guaranteed performance homes
Guaranteed performance homes not only qualify for ENERGY STAR status but also generally include additional energy-efficiency improvements. The energy performance of these homes is guaranteed by the builders or program managers not to exceed a certain annual space conditioning fuel usage based on energy modeling. The guaranteed performance programs guarantee the energy used to heat and cool the home will not exceed the guaranteed usage listed on the front of the homeowner’s guarantee. In order to successfully deliver these guarantees, a minimum of 15 percent of these homes undergo a detailed quality verification process including a framing inspection, air barrier inspection, insulation inspection, duct leakage testing, house envelope leakage testing and room pressure testing. Homes in this category are ENERGY STAR qualified, but for
purposes of this report they were separated into their own distinct category (no duplication across groups).
For each home used in the study, the study team attempted to obtain information on the design characteristics outlined in Table 1 below. Information was collected from dozens of research reports from the Texas ENERGY STAR lab and the NAHB, and we conducted phone interviews with manufacturers, trade members, raters, builders, etc.
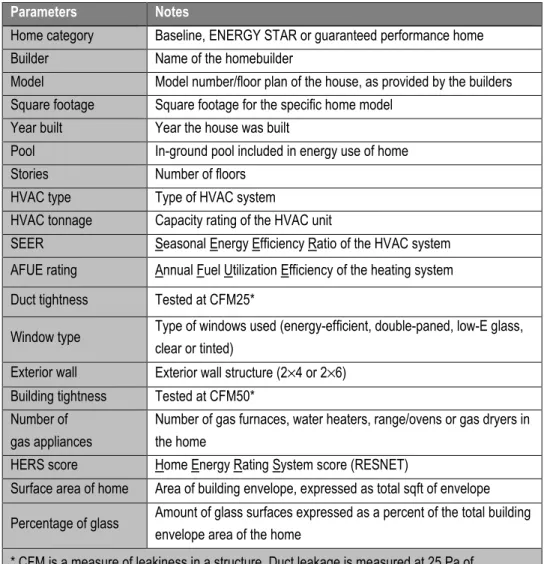
Table 1: Home design characteristics Parameters Notes
Home category Baseline, ENERGY STAR or guaranteed performance home
Builder Name of the homebuilder
Model Model number/floor plan of the house, as provided by the builders Square footage Square footage for the specific home model
Year built Year the house was built
Pool In-ground pool included in energy use of home
Stories Number of floors
HVAC type Type of HVAC system
HVAC tonnage Capacity rating of the HVAC unit
SEER Seasonal Energy Efficiency Ratio of the HVAC system AFUE rating Annual Fuel Utilization Efficiency of the heating system Duct tightness Tested at CFM25*
Window type Type of windows used (energy-efficient, double-paned, low-E glass, clear or tinted)
Exterior wall Exterior wall structure (2×4 or 2×6) Building tightness Tested at CFM50*
Number of gas appliances
Number of gas furnaces, water heaters, range/ovens or gas dryers in the home
HERS score Home Energy Rating System score (RESNET)
Surface area of home Area of building envelope, expressed as total sqft of envelope Percentage of glass Amount of glass surfaces expressed as a percent of the total building
envelope area of the home
* CFM is a measure of leakiness in a structure. Duct leakage is measured at 25 Pa of depressurization (CFM25) and the building envelope leakage is measured at 50 Pa of depressurization (CFM50). These are nationally recognized units of measurement (Proctor, et al., 1993) (Keefe, 1994).
Sources of Information
Given the vast number of new and energy efficient homes constructed in Houston during the last five years, this Houston Energy Home Energy Efficiency Study was able to include an unprecedented number of homes in its final statistical analysis. Information on specific construction details, as well as home performance testing results, was collected from a number of different sources. A summary of the sources is given in Table 2 below.
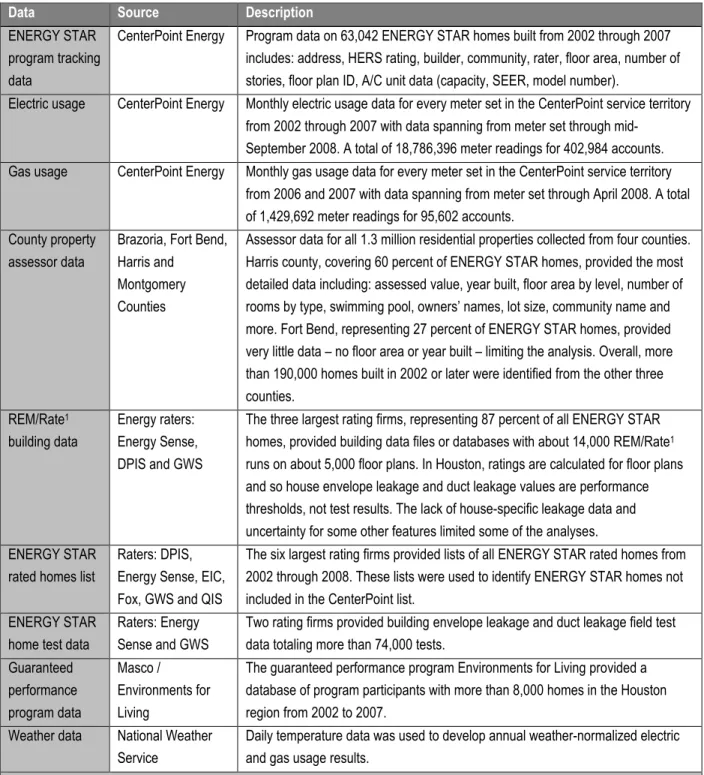
Table 2: Summary of data sources
Data Source Description
ENERGY STAR program tracking data
CenterPoint Energy Program data on 63,042 ENERGY STAR homes built from 2002 through 2007 includes: address, HERS rating, builder, community, rater, floor area, number of stories, floor plan ID, A/C unit data (capacity, SEER, model number).
Electric usage CenterPoint Energy Monthly electric usage data for every meter set in the CenterPoint service territory from 2002 through 2007 with data spanning from meter set through
mid-September 2008. A total of 18,786,396 meter readings for 402,984 accounts. Gas usage CenterPoint Energy Monthly gas usage data for every meter set in the CenterPoint service territory
from 2006 and 2007 with data spanning from meter set through April 2008. A total of 1,429,692 meter readings for 95,602 accounts.
County property assessor data
Brazoria, Fort Bend, Harris and
Montgomery Counties
Assessor data for all 1.3 million residential properties collected from four counties. Harris county, covering 60 percent of ENERGY STAR homes, provided the most detailed data including: assessed value, year built, floor area by level, number of rooms by type, swimming pool, owners’ names, lot size, community name and more. Fort Bend, representing 27 percent of ENERGY STAR homes, provided very little data – no floor area or year built – limiting the analysis. Overall, more than 190,000 homes built in 2002 or later were identified from the other three counties. REM/Rate1 building data Energy raters: Energy Sense, DPIS and GWS
The three largest rating firms, representing 87 percent of all ENERGY STAR homes, provided building data files or databases with about 14,000 REM/Rate1 runs on about 5,000 floor plans. In Houston, ratings are calculated for floor plans and so house envelope leakage and duct leakage values are performance thresholds, not test results. The lack of house-specific leakage data and uncertainty for some other features limited some of the analyses. ENERGY STAR
rated homes list
Raters: DPIS, Energy Sense, EIC, Fox, GWS and QIS
The six largest rating firms provided lists of all ENERGY STAR rated homes from 2002 through 2008. These lists were used to identify ENERGY STAR homes not included in the CenterPoint list.
ENERGY STAR home test data
Raters: Energy Sense and GWS
Two rating firms provided building envelope leakage and duct leakage field test data totaling more than 74,000 tests.
Guaranteed performance program data Masco / Environments for Living
The guaranteed performance program Environments for Living provided a database of program participants with more than 8,000 homes in the Houston region from 2002 to 2007.
Weather data National Weather Service
Daily temperature data was used to develop annual weather-normalized electric and gas usage results.
1REM/Rate is a software package used by most HERS raters to complete plan reviews for ENERGY STAR and guaranteed performance builders in order to predict the energy use of a home (Architectural Energy Corporation).
Data collection and preparation required intensive and often tedious work to obtain, clean and combine the many different datasets. Matching homes by address from different sources was a significant challenge due to frequent spelling and formatting variations and naming variations for
names, floor plan identifiers and community names were included when available to enhance the matching process and confirm the accuracy of matches. Manual checks were performed for thousands of potential or unclear matches (including on-line address lookups as needed).
In addition to the data listed in Table 2, a small sample of baseline home construction data were collected from a local HERS rater in the form of REScheck files. REScheck is a web-based software tool developed by the U.S. Department of Energy (DOE) that builders in Houston can use to demonstrate compliance with the local energy code (U.S. DOE, 2009). It includes many of the construction inputs raters use to generate the HERS score for ENERGY STAR and guaranteed performance houses. Unfortunately, because such a small number of REScheck files were obtained, the exact specifications of building components for baseline homes cannot be known or predicted with any accuracy. Instead, a number of product manufacturers and distributors, installers, code officials and others familiar with the Houston residential market were interviewed in an effort to characterize the market for energy-efficient products and standard practices in Houston baseline homes.
In regards to the integrity of information for sources listed in Table 2, quality checks were performed on the data to exclude obvious errors. These algorithms are discussed in the Data Merging and Sample Attrition section below (beginning on page 23). However, the following should also be noted:
► Data provided by supporting organizations, raters and county appraisal databases were not field verified by the study team.
► The energy consumption habits of the occupants (lifestyle) were not directly evaluated in this study. The study team realizes lifestyle can be an important variable affecting the energy consumption of a home. Therefore, a large statistical sample size is used to minimize the significance of the variations across and within groups.
Once all of the database information, monthly energy use histories and building inputs were collected for ENERGY STAR, guaranteed performance and baseline homes in Houston, a data set was developed using the procedures outlined in the following sections.
Identifying “Baseline” Homes
The electric and gas usage data files were generated by CenterPoint Energy based on utility customers who had a “meter set” event in the specific time frame. This criterion was employed to obtain data on baseline homes – new homes that did not participate in the ENERGY STAR or guaranteed performance program.
One complication from using meter set dates is that meters may be set in existing homes due to routine meter replacements and other circumstances. In order to be sure that the baseline homes are actually new homes, the county property assessor data files are used, which included the year built for three of the four counties analyzed (Fort Bend being the exception). About one-third of the homes listed as completed by ENERGY STAR in any given year are listed as built the prior year by the property assessor data – apparently the assessor figure may be based on issuance of permits, not completion. For consistency, the property assessors’ year is used when comparing ENERGY STAR and baseline homes.
Overall, 216,860 homes are matched between the assessor data and the utility data – 102,825 ENERGY STAR homes and 114,035 other homes. For the three counties that provided data on year of construction, 87 percent of homes built from 2002 through the present are successfully matched with energy usage data. For Harris County, where CenterPoint service territory covers essentially the entire county, the matching rate is 97 percent. For Fort Bend County, where year of construction is not known, 30 percent of all homes are matched, but many of these may not be new.
The property assessor files also included the floor area of the home for all counties except Fort Bend. This information is critical for properly comparing the energy use of baseline and ENERGY STAR homes so that observed differences are not just due to differences in house size. The assessor data also allows the analysis to identify homes in both groups that should be excluded for certain analyses. The assessor information is used to:
► Identify homes that may not have been sold yet based on the owner name being a company or partnership
► Identify townhouses or other attached or multifamily units that are considered outside the focus of this analysis
► Identify baseline homes that are not comparable to any ENERGY STAR homes – specifically homes where the floor area or property assessment value are outside the range of values found among ENERGY STAR homes
► Identify homes with swimming pools so they can be excluded from most analyses since swimming pools represent a large and variable load that obscures total usage and especially cooling load estimates
Since Fort Bend County assessor files do not include the year of construction, the study team could not be sure which homes were actually built in the target timeframe. One method for trying to identify new construction is to flag homes that are located in communities that also had ENERGY STAR homes. This approach should mostly identify developments that were still actively building in
the baseline homes, all homes from Fort Bend County are excluded for most analyses – including 23,195 ENERGY STAR homes, representing 23 percent of all ENERGY STAR homes built throughout the study period in metro Houston.
One additional complication in identifying appropriate baseline homes is the heating and water heating fuels are not provided in the property assessor data. The CenterPoint ENERGY STAR homes database reports just seven electrically-heated homes out of more than 63,000 homes listed. Homes with electric heat can readily be identified based on the size of the winter load from the usage analysis, but water heating is more complicated to identify.
The REM/Rate files indicated electric water heating in 427 of the 33,325 homes with REM data (1.3 percent). There is no clear method for identifying electric water heating from electric usage data. Electric water heating is reportedly quite rare in the Houston market. Still, a difference in electric water heating rates between the baseline and ENERGY STAR homes could skew results, especially when assessing baseload or total usage. For the homes listed as having electric water heating, the annual baseload electric usage averaged 1,838 kWh (21 percent) greater than those with gas water heating, while the summer/cooling load averaged just 104 kWh (1.8 percent) greater. It appears that potential differences in electric water heating penetration between baseline and ENERGY STAR homes are unlikely to have a significant impact on estimated summer/cooling loads, but could have an effect on baseload and total usage. Since the frequency of electric water heating among the baseline homes is uncertain (although it is expected to be quite low) the most reliable comparisons between groups will likely be for the summer/cooling loads.
Self-Selection Bias, Free Riders and Spillover
Although substantial effort was taken to develop a well-matched group of baseline homes, self-selection bias is still an issue that needs to be considered in any comparisons between the ENERGY STAR and baseline homes. Self selection is the term used to describe the potential bias that can arise because builders choose to participate in the program (or not) and this choice may reflect differences between the participant and baseline groups that are hard to measure or adjust for.
Free riders refers to the phenomenon of ENERGY STAR builders who were already planning to build more efficient homes, making it easy for them to comply with ENERGY STAR standards and participate in the program1. For ENERGY STAR homes, there are unlikely to be many pure free riders as few builders would actually pay to have duct leakage and building envelope leakage
1 The study of ENERGY STAR homes in Phoenix found that many of the builders who joined the program were already building many homes with similar energy features.
tested on each home. However, there may be many partial free riders as builders planned to install the same higher efficiency equipment, windows and insulation levels as called for by ENERGY STAR. From the perspective of the broader ENERGY STAR homes program, free riders may not be considered a problem but simply a well deserved reward for builders who are already building more efficient homes. But from the perspective of a local utility trying to achieve specific net load reductions, free riders reduce the net program impacts.
The opposite type of bias can also occur – spillover (a.k.a., free drivers). Spillover refers to energy impacts produced by the program in homes that do not actually participate in the program. This effect is thought to be occurring in the Houston ENERGY STAR homes program with respect to duct leakage and perhaps building envelope leakage. As noted previously, duct systems in Houston are installed by a few major contractors. The large market share of ENERGY STAR and the duct leakage testing requirements of the program have made these contractors develop consistent methods for installing tight duct systems. These same installation methods are then used on all homes, leading to tighter duct systems in non-ENERGY STAR homes. A similar effect may have occurred with framing and insulation contractors related to building envelope leakage requirements of ENERGY STAR. The net impact of spillover is that baseline homes become more efficient due to the program and therefore the difference in energy usage between baseline and ENERGY STAR homes narrows, making the program appear less effective, when in reality it is more effective.
An example of how large an impact spillover can have may be instructive. Assume that ENERGY STAR home cooling loads average 4,000 kWh and baseline homes loads would have averaged 5,000 kWh (without spillover) for a 1,000 kWh (20 percent) difference in loads. Then assume spillover causes the baseline duct system to be built tighter, resulting in a modest 5 percent reduction in their cooling loads. Now we actually observe baseline cooling loads of 4,750 kWh (5000 times 95 percent), implying program savings of just 750 kWh. But the effect on net program impacts is even larger because the program has produced savings in the non-program homes. If ENERGY STAR has a 50 percent market share, then the true net savings of the ENERGY STAR program is 1,250 kWh per participant (1,000 kWh of participant load reduction plus 250 kWh of non-participant load reduction), yet we only observe 750 kWh savings. This example illustrates how a modest spillover effect can create a large downward bias in apparent program impacts. If the total spillover in this example led to a 7 percent change in the baseline home loads, then observed program impacts would have been just half the actual impacts.
There are also other types of spillover effects that may occur, such as some builders building ENERGY STAR compliant homes but not bothering to participate in the formal program. The
Phoenix Home Energy Study showed some home builders constructing homes to the ENERGY STAR standards, but not paying for the ENERGY STAR label for the home.
Energy Usage Data: Weather Normalization
The raw monthly energy usage data for each customer was first analyzed using weather-normalization procedures to adjust for variations in weather between the period covered by the meter readings and average weather patterns. The results from the weather normalization include estimates of the annual total energy usage as well as a break out of this usage into weather sensitive and baseload components. Weather normalization is not perfect, but provides a much better basis for comparing energy usage between homes and over time than simply summing or averaging the raw monthly energy bills.
The gas usage data are analyzed using a variable-base heating degree day regression analysis similar to the widely-used PRISM software (Fels, 1986). The usage data were first screened to flag potential periods of vacancy as indicated by unreasonably low usage and off-cycle meter readings. Given the relatively limited timeframe covered, all usage data were pooled together for each customer. Weather normalization results were classified as unreliable if:
► The usage data included fewer than nine meter readings or 240 days or included less than half the heating degree days of a typical winter or the heating degree days per day ranged by less than the annual average HDD/day
► The model fit from the regression was poor: R² < 0.6 or the estimated standard error of the annualized usage was greater than 20 percent
► The heating load was less than 50 therms or the baseload was less than 40 therms, indicating likely vacancy
► After passing all prior screens, homes with extreme usage were identified as those where the total usage per square foot of floor area was in the highest or lowest two percent of homes in each housing group – these homes most likely represent either homes that were not fully occupied in the period or homes with very unusual occupancy patterns For electric usage data, weather normalization was performed using a heating and cooling degree day adjustment procedure (HDD is heating degree day and CDD is cooling degree day). This approach classified each meter reading period into one of three seasons – summer, winter or baseload – based on heating and cooling degree days. The usage and degree days were then summed for each season and the resulting data was used to create three equations that can be solved to estimate baseload usage per day, summer/cooling usage per CDD and winter/heating usage per HDD, assuming linear relationships. This method allows for heating or cooling to occur in any season and tends to provide fairly robust (i.e., reliable) results that can work better than regression models when usage patterns are unusual or seasonal loads are small.
For this analysis, the CDD was calculated with a balance point temperature of 69°F and HDD with a balance point temperature of 62°F. The cooling balance point was selected by fitting a variable-base cooling degree day regression model for all homes classified as having no apparent winter seasonal load and then using the median of the estimated balance point temperatures. A similar analysis approach was taken for the study of ENERGY STAR homes in Phoenix (Advanced Energy, 2005) and the median balance point temperature there was found to be considerably higher at 74°F. The difference in estimated balance point temperatures is most likely related to a large difference in summer humidity levels.
Electric usage data were first screened to remove periods of likely vacancy and other anomalous or questionable data and then cases with insufficient data, defined as fewer than 11 usable meter readings in the year, were removed prior to the weather normalization. The weather normalization results were then screened to identify unreliable cases, defined as:
► Total raw electric usage of less than 3,000 kWh for the year, or no summer/cooling load or annual baseload less than 2,400 kWh
► Annualized winter/heating load estimated at 0.75 kWh per square foot of floor area or more – to remove potential electric heating customers, which were uncommon in ENERGY STAR homes
► After passing the prior screens, homes with extreme usage were identified as those where the annual summer/cooling load per square foot of floor area was in the highest or lowest two percent of homes in each housing group – these homes most likely represent homes that were not fully occupied in the period or homes with unusual occupancy patterns
The electric usage analysis was run separately for each home during each calendar year except that the final year was defined as September 2007 through September 2008. Given the growing number of homes built and occupied each year, the 2008 results were the primary results analyzed.
The outputs from the electric usage analysis are referred to as the summer/cooling load, the winter/heating load and the baseload. These terms are used to reinforce the fact that many electric loads are seasonal and will appear as part of the winter or summer seasonal usage component, even though they are not space conditioning. Summer-peaking end uses include pool pumps, fans, dehumidifiers and refrigerators, while winter-peaking end uses include the furnace fan and lighting. For a climate like Houston, the vast majority of the estimated summer/cooling load will tend to be actual air conditioning usage if no pool is present, while the entire winter/heating load will tend to
Data Merging and Sample Attrition
The biggest task for the project was to create a single dataset with information on all homes derived from all available data sources (see Table 2 for a list of these sources).
The detailed building data from the REM/Rate files required significant processing. First, 14,017 individual REM *.blg files provided by raters needed to be processed through REM/Rate to create a relational database of building data. Next, 45 different data tables of outputs in the REM export database were processed to summarize key building characteristics into a single data record for each home or floor plan that included more than 150 pieces of information. Data elements extracted included the areas and rated performance values (e.g., R-values, U-values, SHGC, SEER, AFUE, EF) of all major building components and systems as well as load projections from the REM software.
The weather-normalized electric usage dataset was matched with the ENERGY STAR homes database to create a master file of all homes of interest. Each other data set was then matched and merged into this master file, including the gas usage analysis results, the energy rater field test data and additional rated homes lists, the county property assessor data and finally the REM data.
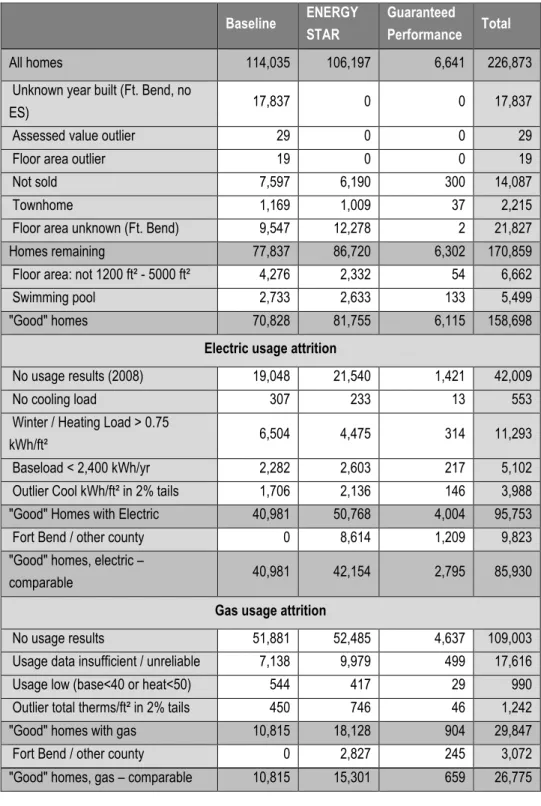
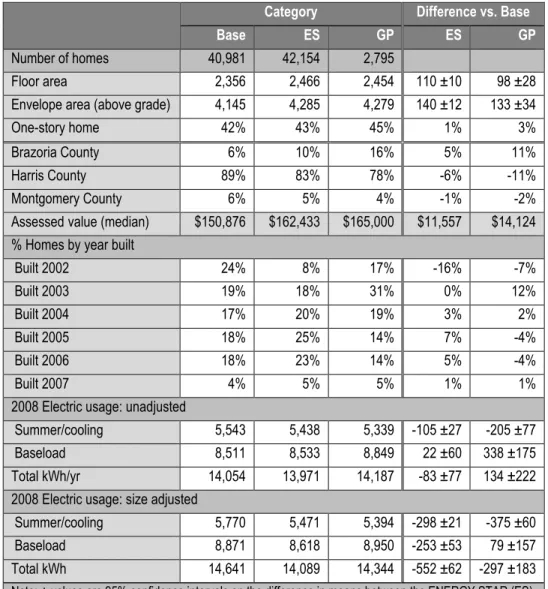
The combined master dataset includes more than 500 data fields for each home and contains information on 226,873 homes including 114,035 potential baseline homes, 106,197 ENERGY STAR homes and 6,641 guaranteed performance homes. The CenterPoint ENERGY STAR tracking system included data on 63,042 homes, while an additional 49,796 ENERGY STAR homes were identified from energy rater lists. The homes in the combined dataset include many homes where some key information is not available or where the home may not be appropriate for the analysis for other reasons. A set of screening criteria is applied to define a “Good” home for analysis and then the usage analysis screens are applied to define “Good” homes for the electric usage analysis and for the gas usage analysis. The following table summarizes the disposition of homes in the dataset.
Table 3: Disposition of homes in final data set Baseline ENERGY STAR Guaranteed Performance Total All homes 114,035 106,197 6,641 226,873
Unknown year built (Ft. Bend, no
ES) 17,837 0 0 17,837
Assessed value outlier 29 0 0 29
Floor area outlier 19 0 0 19
Not sold 7,597 6,190 300 14,087
Townhome 1,169 1,009 37 2,215
Floor area unknown (Ft. Bend) 9,547 12,278 2 21,827
Homes remaining 77,837 86,720 6,302 170,859
Floor area: not 1200 ft² - 5000 ft² 4,276 2,332 54 6,662
Swimming pool 2,733 2,633 133 5,499
"Good" homes 70,828 81,755 6,115 158,698
Electric usage attrition
No usage results (2008) 19,048 21,540 1,421 42,009
No cooling load 307 233 13 553
Winter / Heating Load > 0.75
kWh/ft² 6,504 4,475 314 11,293
Baseload < 2,400 kWh/yr 2,282 2,603 217 5,102
Outlier Cool kWh/ft² in 2% tails 1,706 2,136 146 3,988
"Good" Homes with Electric 40,981 50,768 4,004 95,753
Fort Bend / other county 0 8,614 1,209 9,823
"Good" homes, electric –
comparable 40,981 42,154 2,795 85,930
Gas usage attrition
No usage results 51,881 52,485 4,637 109,003
Usage data insufficient / unreliable 7,138 9,979 499 17,616
Usage low (base<40 or heat<50) 544 417 29 990
Outlier total therms/ft² in 2% tails 450 746 46 1,242
"Good" homes with gas 10,815 18,128 904 29,847
Fort Bend / other county 0 2,827 245 3,072
"Good" homes, gas – comparable 10,815 15,301 659 26,775 The top portion of table shows the causes for excluding homes from the analysis and the lower portions show usage analysis attrition. The largest sources of attrition were related to Fort Bend county not providing data on year of construction or floor area. Attrition causes, in order of screening, included:
► “Unknown year built” includes homes where the year of construction is unknown from either county or ENERGY STAR program records and there are no ENERGY STAR homes built in the same community during the target timeframe – the study team has no knowledge of how recent these homes were built and so cannot use the data in the analysis
► “Assessed value” and “Floor area” outliers include baseline homes where the assessed value is greater than the assessed value of any ENERGY STAR home or the floor area is smaller than or larger than any ENERGY STAR home
► “Not sold” refers to homes where the most recent owner of record is a company of some type, implying the home may not have been sold by the builder – baseline homes are more likely to be unsold than ENERGY STAR homes, 7.9 percent vs. 5.8 percent ► Townhomes are excluded from the analysis because of their relatively small number and
the difficulty in properly accounting for house size in comparisons
► “Floor area unknown” is self-explanatory and mostly includes homes in Fort Bend County – either baseline homes or ENERGY STAR homes not listed in the CenterPoint tracking system – this category also includes some cases with errors in the data (e.g., a 90 ft² home)
► A subtotal of “Good” homes is provided next to show how many homes appear to be viable for the analysis, however, two further screens are used for most comparisons ► “Floor area not 1200 ft² - 5000 ft²” eliminated homes that are very small or very large
compared to the vast majority of ENERGY STAR homes
► “Swimming pool” homes have pools and are removed from most analyses due to their large impact on consumption, which also confounds cooling load estimates
A total of 158,698 homes passed all of the house screening criteria. The remaining sections of the table show the sample attrition from the various usage analysis screens applied to these “Good” homes. Many of the homes with “No Usage” were built in 2007 and not enough time had elapsed since occupancy to assess annual usage.
One further screen applied to the electric and gas analysis groups is to identify all remaining homes from Fort Bend County or from counties other than Harris, Montgomery and Brazoria, where we have no baseline homes. These homes could be included in any direct comparisons between ENERGY STAR and guaranteed performance homes but should be excluded from comparisons to baseline homes to avoid potential bias from differing construction practices or demographics between counties.
Adjusting for House Size
House size is typically accounted for when comparing energy usage between homes. The most common metric has been energy usage per square foot of floor area, which has intuitive appeal and is based on readily available data. A problem with this approach is that building heat gain and loss should scale more directly with the area of the building envelope, which grows at a different
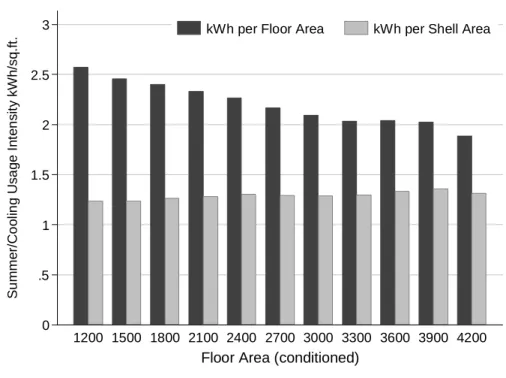
rate than floor area. An effective size adjustment approach should show no relationship between usage intensity and house size for homes of similar efficiency. This assumption was examined by looking at data from 11,828 ENERGY STAR homes built in 2005. The following figures show the average usage intensity calculated by floor area and by envelope area for the summer/cooling loads and the total electric loads.
Figure 1: Average summer/cooling energy intensity by floor and envelope area
The summer/cooling usage per floor area drops as the size of the home grows while the usage per envelope area increases slightly. Over the common size range of 1500 – 3000 ft², the usage per floor area drops 15 percent while the usage per envelope area increases just four percent.
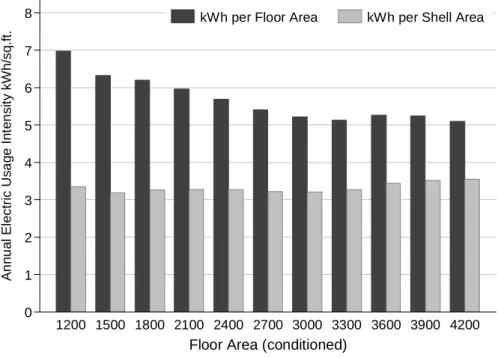
The advantage of normalizing for envelope area is even greater for comparing total usage, as can be seen in Figure 2. The total kWh per floor area drops by 18 percent from 1500 to 3000 square feet while the kWh per envelope area increases by just 1 percent.
0 .5 1 1.5 2 2.5 3 S u m m e r/ C o o lin g U s a g e I n te n s it y k W h /s q .f t. 1200 1500 1800 2100 2400 2700 3000 3300 3600 3900 4200 Floor Area (conditioned)
Figure 2: Average annual electric energy intensity by floor and envelope area
Based on these patterns, building envelope area was used as the primary method for adjusting for house size. Because building envelope areas are not well known or intuitive, rather than provide results in “kWh/ft² envelope”, the usage per envelope area was multiplied by the average envelope area of 4,329 ft², calculated from the 87,870 ENERGY STAR and guaranteed performance “Good Homes”. The result of this calculation is an annual usage value based on adjusting the house size to the average ENERGY STAR home size.
The property assessor and ENERGY STAR homes databases did not have envelope areas, but this information was available for homes with REM data. The study team developed an equation to estimate the above-grade envelope area based on floor area and number of stories and applied the equation to all homes:
Above grade envelope area = Footprint + 39.6 * Stories * Footprint
where Footprint=
floor area, if 1 story floor area
1.8 , if 2 story
The estimates from this equation have a correlation of 0.9 with the REM-derived above-grade area and are within 20 percent of the REM number for 94 percent of all homes.
0 1 2 3 4 5 6 7 8 A n n u a l E le c tr ic U s a g e I n te n s it y k W h /s q .f t. 1200 1500 1800 2100 2400 2700 3000 3300 3600 3900 4200 Floor Area (conditioned)
Construction Characteristics by Group
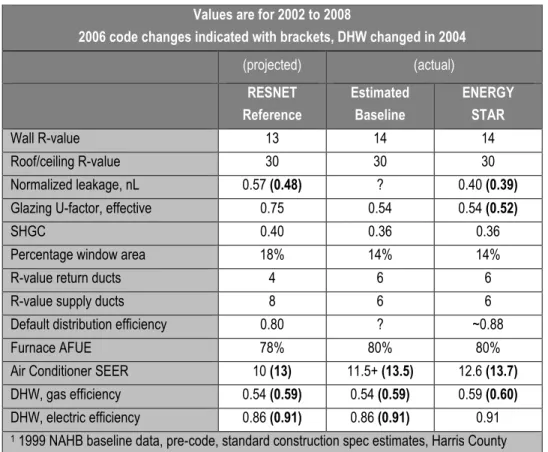
Table 4 summarizes the construction characteristics of the RESNET reference home, estimated baseline home and ENERGY STAR home. The RESNET reference home is used in REM/Rate to calculate the HERS score and ENERGY STAR eligibility of a home, but available data indicates that the standard baseline home built in the Houston market differs in some key ways from the assumed reference home. As of the 2006 code change, a baseline home is nearly identical to an ENERGY STAR home for each of the specs given in Table 4, whereas the RESNET reference home differs in many ways. The largest discrepancy between the reference home and the typical baseline home is air conditioner SEER. Much of the projected savings from ENERGY STAR are due to the assumption that the reference home installs the least efficient equipment available. In Houston, the code changes led to very little difference between ENERGY STAR and baseline construction practices, making the projected difference in SEER even more critical for achieving savings.
Table 4: Characteristics for RESNET reference, baseline and ENERGY STAR homes Values are for 2002 to 2008
2006 code changes indicated with brackets, DHW changed in 2004
(projected) (actual) RESNET Reference Estimated Baseline ENERGY STAR Wall R-value 13 14 14 Roof/ceiling R-value 30 30 30 Normalized leakage, nL 0.57 (0.48) ? 0.40 (0.39)
Glazing U-factor, effective 0.75 0.54 0.54 (0.52)
SHGC 0.40 0.36 0.36
Percentage window area 18% 14% 14%
R-value return ducts 4 6 6
R-value supply ducts 8 6 6
Default distribution efficiency 0.80 ? ~0.88
Furnace AFUE 78% 80% 80%
Air Conditioner SEER 10 (13) 11.5+ (13.5) 12.6 (13.7)
DHW, gas efficiency 0.54 (0.59) 0.54 (0.59) 0.59 (0.60)
DHW, electric efficiency 0.86 (0.91) 0.86 (0.91) 0.91
1 1999 NAHB baseline data, pre-code, standard construction spec estimates, Harris County 2 2000/2001 IECC, post-code home, standard construction spec estimates