PlanetData
Network of Excellence
FP7 – 257641
Linked Map Platform Beta version
User Manual
PlanetData Linked Map Platform Beta version - User Manual
User Manual
This document describes the implemented version of the Linked Map Platform, which is available at
http://linkedmap.unizar.es/crowdsourcing-platform/.
It is a web portal that allows access to Linked Map processed data through a map in an interactive way. Figure 1 shows the start-up screen of the portal. It contains a map as the main element and shows several geometries for each feature contained in the visualized geographical area. Only features belonging to a same source are drawn together. By default the viewer shows the features of the BCN25/BTN25 dataset, but the user can switch the source between BCN25/BTN25 and OSM using the options provided in the lateral panel. BCN25/BTN25 is drawing in red and OSM is drawing in green (Figure 2). However, each feature is coloured lighter or darker depending on its number of links with features from other sources. The lateral panel includes a legend with the meaning of each colour.
The options offered in the header of the page are the following:
• Visit Linked Map. Navigate to the Linked Map website1 after a click in the Linked Map icon.
• Zoom to an area. Users can move the shown map to an area of interest using a geocoder. Users can type the name of a place, and then select one of the matching places to show in the map a surrounding area.
• Login. Users must login in the Linked Map platform to enable edition features. They can create an account providing a name, a password and a valid email account (Figure 3).
Figure 1 – Linked Map Platform start-up screen
1
http://linkedmap.unizar.es/
Page 2 of (8)
Figure 2 – OSM features
Figure 3 – Register page
PlanetData Linked Map Platform Beta version - User Manual
The following controls affect the display or behaviour of the map:
• Initial map: This control returns to the initial map.
• Zoom in: This control moves the focal point closer around the centre of the map.
• Zoom out: This control moves the focal point away from the centre of the map.
• Zoom back: This control goes back to the previous zoom visualized by the user and memorizes the current zoom.
• Zoom forward: If zoom back control has been clicked before, this control will restore the memorized zoom.
• Pan: This control allows moving the map
• Get Information: This control gives more information about the use of the platform.
• Layer Switch IGN-BASE: This control enables or disables the IGN-Base WMTS as base layer map. The IGN-Base map is the official web service built with the data of the BCN25/BTN25 dataset.
• Layer Switch PNOA: This control enables or disables the PNOA WMTS as base layer map. The PNOA WMTS is an official web service that returns a map created with aerial photographs (orthoimages).
• Overview map: This control shows the overview map.
Table 1 shows for each control its associated icon. The blue colour indicates the control is currently selected.
Table 1 – Map control icons Control Icon Initial map Zoom in Zoom out Zoom back Zoom forward Pan Get information Layer switchers Overview map
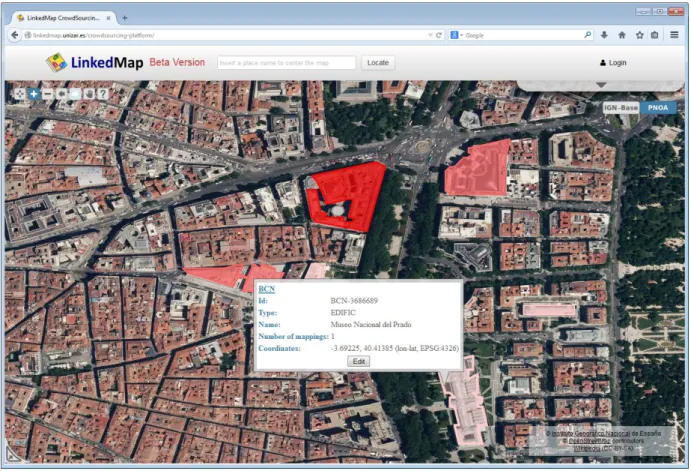
Moving the mouse over the features on the map a simple map tip is showed displaying some basic information about each feature. An example of this behaviour can be seen on Figure 4. Specifically, the information shown about each feature is the following:
• The source dataset from which it has been extracted.
• The identifier of the feature.
• The name of the feature.
• The type of the feature.
• The number of links or mappings with other features.
• The geographical coordinates where the feature is placed.
Figure 4 – Feature map tip
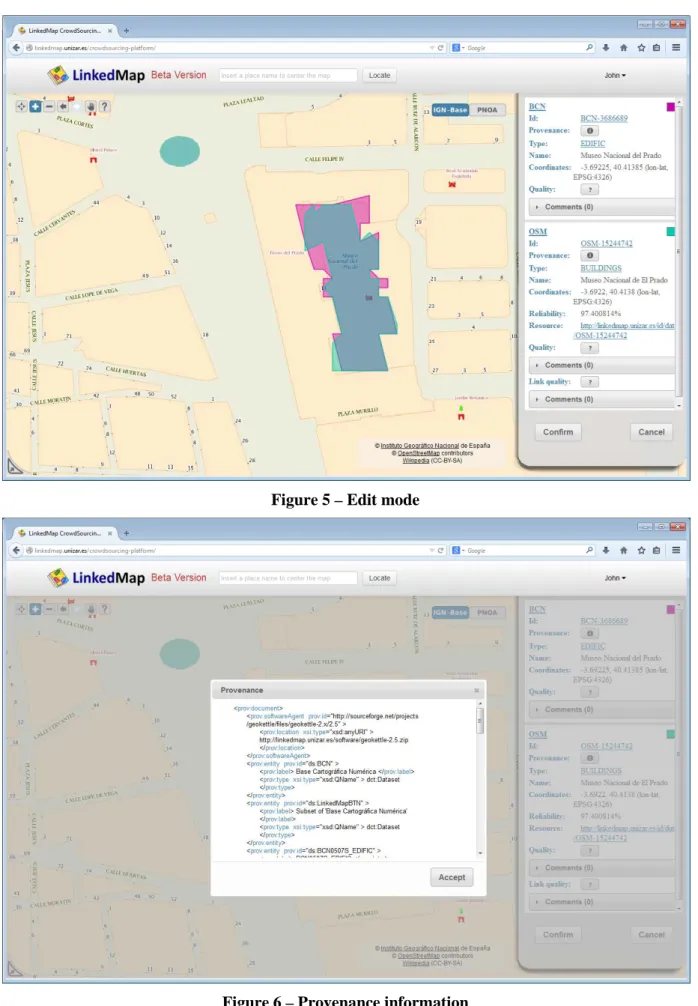
The user, once logged in, can choose a specific featured by clicking on the edit button showed on the map tip. Then, the geographical feature is highlighted in a colour and other features linked to it and belonging to other sources are shown over the map. At the same time, a form with information about the geographical feature itself and its linked geographical features is open at the right side (Figure 5). The form enables to:
• See a description of the selected geographical feature and the linked geographical features. Each description includes the name, the feature type, the location, and the source. The user can also access to the provenance information of each feature (Figure 6). Additionally, each linked geographical feature displays a reliability value between 0% and 100% that represents the confidence value of the mapping. The form contains links that enable to download the underlying RDF data.
• Give opinions about the quality of geographical features or the relation between geographical features
(Figure 7): The user can judge if a feature is right or a link makes sense or not. In order to improve the quality of the judgement, the user can see previous reviews from other users first (Figure 8). Next, the user may click on a button next to the “quality” or “link quality” property to begin its review. After clicking, a dialog is displayed offering two choices to users, “agree” or “disagree”, and a text field where they can input the motives of their agreement or disagreement. If the user agrees, the style of the button changes to the “agree” state otherwise the style of the button changes to the “disagree” state. Initially the control displays the icon associated with the “undefined” state. Table 2 shows the icons associated with each state. Once the user has made his contributions, the user can select the “confirm” button to send the changes to the LMS server or the “cancel” button to discard the changes.
Table 2 – User review icons Review Agree Disagree Undefined
Icon
PlanetData Linked Map Platform Beta version - User Manual
Figure 5 – Edit mode
Figure 6 – Provenance information
Figure 7 – Form to check the quality of links
Figure 8 – View Comments
PlanetData Linked Map Platform Beta version - User Manual
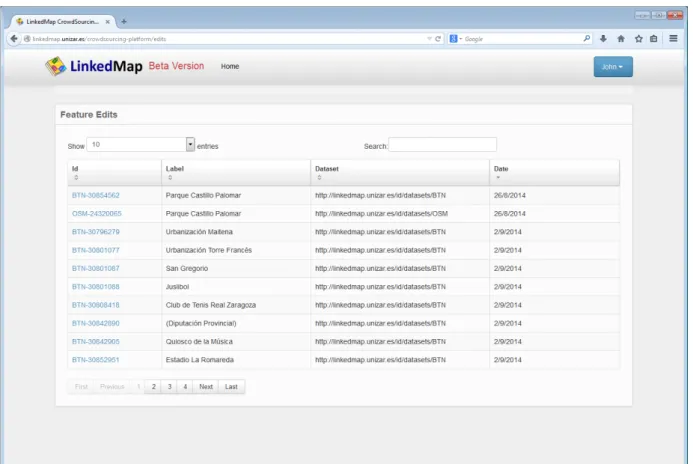
Users can access to the history of all comments they have made by means of a separate section, which shows a table with all the features reviewed by them. This table shows the identifier of each feature as well as its name and the source it belongs to (see Figure 9). It also offers a button that opens the map viewer in edition mode and focused on the feature.
Figure 9 – User history
If you have any doubt about the use of the Linked Map platform, you can watch this video that explains how to start working with the Linked Map Platform:
http://linkedmap.unizar.es/wp-content/uploads/2014/08/videoTutorial3.mp4