Original Research Article
Role of adipokines, oxidative stress, and endotoxins in the pathogenesis
of non-alcoholic fatty liver disease in patients with
type 2 diabetes mellitus
Pallavi M.
1, Suchitra M. M.
1*, Alok Sachan
2, Lakshmi A. Y.
3, Srinivasa Rao P. V. L. N.
1INTRODUCTION
Non-alcoholic fatty liver disease (NAFLD) is the hepatic manifestation of the metabolic syndrome and commonly seen in all ages and ethnic groups.1 NAFLD has been
increasingly recognized as a major cause of liver-related morbidity and mortality.2 NAFLD is characterized by
accumulation of fat in the liver, with or without inflammation and covers a wide spectrum of conditions ranging from non-alcoholic fatty liver to non-alcoholic
1Department of Biochemistry, 2Department of Endocrinology, 3Department of Radiology, Sri Venkateswara Institute
of Medical Sciences, Tirupati, Andhra Pradesh, India
Received: 12 February 2019 Revised: 02 March 2019 Accepted: 08 April 2019
*Correspondence: Dr. Suchitra M. M.,
E-mail: suchitra.n@rediffmail.com
Copyright: © the author(s), publisher and licensee Medip Academy. This is an open-access article distributed under the terms of the Creative Commons Attribution Non-Commercial License, which permits unrestricted non-commercial use, distribution, and reproduction in any medium, provided the original work is properly cited.
ABSTRACT
Background: Type 2 diabetes mellitus (T2DM) is associated with chronic inflammation and oxidative stress, implicated in the pathophysiology of non-alcoholic fatty liver disease (NAFLD). Present study aimed to assess the role of adipokines, oxidative stress, and endotoxins in the pathogenesis of NAFLD in T2DM.
Methods: Present cross-sectional observational study included healthy controls (n=50; group 1); T2DM patients without NAFLD (n=50; group 2), T2DM patients with NAFLD (n=50; group 3). Study subjects were age and gender matched.
Results: Tumor necrosis factor-α (TNF-α), interleukin-6 (IL-6), high sensitive C-reactive protein (hs-CRP), endotoxin, malondialdehyde (MDA) were significantly elevated and adiponectin, ferric reducing ability of plasma (FRAP), and glutathione (GSH) were significantly lower (p<0.001) in T2DM patients with NAFLD when compared to T2DM patients without NAFLD and controls. Endotoxin showed significant positive correlation with TNF-α (r=0.304; p<0.001), hs-CRP (r=0.193; p=0.018), and MDA (r=0.420; p<0.001), and significant negative correlation with adiponectin (r=-0.406; p<0.001). TNF-α and IL-6 showed significant positive correlation with MDA (r=0.526; p<0.001, r=0.229; p=0.005) and significant negative correlation with adiponectin (r=-0.396; p<0.001, r=-0.318; p<0.001), FRAP (r=-0.418; p<00.001, r=-0.170; p=0.038), and GSH (r=-0.353; p<0.001, r=-0.301; p<0.001).
Conclusions: Authors observed elevated endotoxin, oxidative stress, inflammation and lower adiponectin levels in T2DM subjects compared to controls. These changes were more pronounced in T2DM with NAFLD when compared to T2DM without NAFLD. Lower adiponectin levels were found to be a better predictor of NALFD in T2DM and is associated with oxidative stress and systemic inflammation.
Keywords: Adipokines, Endotoxins, Inflammation, Non-alcoholic fatty liver disease, Oxidative stress, Type 2 diabetes mellitus
steatohepatitis (NASH) and later progressing onto
advanced liver fibrosis and cirrhosis.3 Pathogenesis of the
NAFLD may involve deposition of excess fat in the liver followed in some patients by increased fatty acid oxidation, oxidative stress, endotoxemia, and adipokines production, resulting in progression to steatohepatitis and fibrosis.4,5 The increased prevalence of obesity, diabetes,
hypertension, hypertriglyceridemia, and hypercholesterolemia are considered to be the most common causes for NAFLD.6 The prevalence rate of
NAFLD in type 2 diabetes mellitus (T2DM) is estimated to be in the range of 12.5% to 8.5% in India.7 T2DM
contributes not only to steatogenesis, but also to progressive liver damage and possibly hepatocellular carcinoma.8 T2DM increasingly has been associated with
chronic inflammation, oxidative stress, and the up-regulation of hepatotoxic cytokines. All these factors are implicated in the pathophysiology of NAFLD which in turn is associated with increased cardiovascular risk. Adams LA et al, reported that T2DM individuals with NAFLD had a 2.2-fold increased risk of all-cause mortality due to liver complications and ischemic heart disease compared with those without NAFLD.9
As both T2DM and NAFLD are associated with adverse outcomes of the other, it is crucial to identify the predictors of NAFLD in T2DM. To the best of our knowledge limited information is available on the association between NAFLD and T2DM with respect to adipokines and endotoxins in Indian scenario. The clinicopathological profiles of NAFLD patients in Western population appear to be different when compared with Indians. Hence, the present work was undertaken to study the role of adipokines, oxidative stress, and endotoxins in the pathogenesis of NAFLD in patients with T2DM in a representative population of patients with T2DM attending a tertiary care hospital in Tirupati, Andhra Pradesh, India.
METHODS
The present study is a cross-sectional observational study, done in 100 patients with T2DM attending outpatient department of endocrinology and metabolism of Sri Venkateswara Institute of Medical Sciences, Tirupati between January 2014 to March 2016. The study was conducted after obtaining approval by the Institutional Ethics Committee and written informed consent from all the study subjects before commencing the study.
Sample size was calculated using the formula, n=2/d2 x
Cp, power, at 80% power and 0.05 alpha error. The patients were randomly chosen from among 3,119 subjects who were diagnosed with T2DM diagnosed as per American diabetes association (ADA) criteria.10
Selection criteria
Patients with duration of T2DM of less than one year, who were on treatment with oral hypoglycemic agent
metformin or diet and exercise, aged between 30-60 years, were recruited into the study. T2DM patients with history of alcohol intake, smoking, bilirubin level >1mg/dL, known liver diseases, cardiovascular diseases, malignancy, those on medication known to induce fatty liver, lipid lowering therapy, antioxidant therapy, and those who have undergone gastro intestinal surgery were excluded from the study. The subjects with normal or mild to moderately elevated ALT and AST (<5 times the upper normal limit for ALT was 35IU/L and for AST was 40IU/L), and absence of viral, metabolic or other specific etiologies of liver diseases were included into the study.11
The diagnosis of NAFLD was done by ultrasonographic examination of liver using a high-resolution B-mode ultrasonography system (GE medical systems, Austria) having an electric curvilinear transducer frequency of 3-5MHz, focusing on liver size, texture, visualization of intra-hepatic vessels and diaphragm, liver to kidney contrast ratio performed by an experienced radiologist, who was blinded to all clinical and biochemical characteristics of subjects. The diagnosis of hepatic steatosis was made on the basis of characteristic sonographic features which included evidence of bright liver (homogeneous hyper echogenicity in liver parenchyma compared to right kidney). All the subjects were screened for hepatitis B virus (HBV) and hepatitis C virus (HCV) to exclude presence of infective liver diseases. Serum iron, total iron binding capacity (TIBC), transferrin saturation, total bilirubin, albumin, total protein, alanine transaminase (ALT), aspartate transaminase (AST), alkaline phosphatase (ALP), and gamma glutamyl transferase (GGT) were estimated to assess liver function.
The T2DM patients following the NAFLD screening procedure were categorized into T2DM patients without NAFLD (n=50; group 2) and T2DM patients with NAFLD (n=50; group 3). Control group (n=50; group 1) comprised of age and sex matched healthy volunteers who also underwent similar selection process as cases and who had no ultrasonographic evidence of fatty liver.
Clinical examination
Blood pressure and anthropometric measurements such as weight, height, and waist circumference (WC) were recorded. Body mass index (BMI) was calculated using the formula: weight in kg/height in m2.12
Sampling
Venous blood samples were collected from the subjects who were fasting for 10-12hours. The blood collected was transferred into:
• Additive free tubes, which were allowed to stand for 30minutes for clotting to occur and then centrifuged for 3000 RPM for 15minutes to obtain serum for analysis of routine, screening, and all the study parameters except for adipokines.
• Lithium heparin tubes, which were placed in ice packed collection kit until separation. Samples were centrifuged at 4°C at 2000 rpm for 15minutes in a cooling centrifuge to obtain plasma for analysis of adipokines.
The separated serum and plasma samples were aliquoted and stored in vials at-80°C in deep freezer until analysis. The plasma glucose was analyzed immediately.
Biochemical analysis
• Routine parameters plasma glucose, ALT, AST, ALP, GGT, total protein, albumin, total bilirubin, iron, TIBC, and uric acid in serum were analyzed by standard methods on Synchron Unicel DxC 600 auto analyser (Beckman coulter, USA). Transferrin saturation was calculated using formula (Iron/TIBCx100).
• Hs-CRP in serum by immunoturbidimetric method on Synchron Unicel DxC 600 auto analyzer.
• Oxidative stress marker, malondialdehyde (MDA) in serum, was measured as thiobarbituric acid reactive substance (TBARS), antioxidant markers such as ferric reducing ability of plasma (FRAP), glutathione (GSH) by Ellman’s method using UV/VIS Perkin Elmer spectrophotometer.13-15
• Adipokines, TNF-α, IL-6, leptin and adiponectinin plasma were measured by sandwich enzyme linked immunosorbent assay (Assaypro, USA).
• Endotoxin in serum was measured by Limulus Amoebocyte Lysate (LAL) chromogenic end point assay (Hycult biotech, Netherlands). The serum samples were heated at 75oC for five minutes in a
water bath to neutralize the endotoxin inhibiting compounds.
Statistical analysis
Data was analysed by using statistical package for the Social Sciences (SPSS) version 16 for windows (SPSS Inc, Chicago, IL, USA), and MedCalc (version 12.1, Ostend, Belgium). Variables were expressed as Mean±SD or median (interquartile range), depending on assessment for Gaussian distribution. For the comparison of means of parameters between the three study groups, analysis of variance (ANOVA) followed by post-hoc Bonferroni multiple comparison test was applied for data with normal distribution and Kruskal Wallis post hoc multiple comparisons were applied for skewed data. Correlations between the parameters were tested using Pearson’s correlation for data with normal distribution and Spearman’s correlation coefficients for skewed data. Univariate logistic regression followed by multivariate logistic regression analysis was used to evaluate the
potential predictors of NAFLD, by keeping NAFLD as dependent variable. Significance was considered at p<0.05.
RESULTS
The anthropometric measurements BMI and WC were significantly higher across the groups (p=0.004 and p=0.005 respectively). BMI and WC were significantly higher in T2DM patients with NAFLD when compared to controls (p=0.004 and p=0.002 respectively). WC was also found to be significantly greater in T2DM with NAFLD when compared to T2DM patients without NAFLD (p=0.019) as shown in (Table 1).
Oxidative stress and anti-oxidant status in the study population
MDA was significantly elevated, FRAP and GSH were significantly lower across the groups (p<0.001) as shown in (Table 2).
Significantly elevated MDA and lower FRAP levels were observed in both groups of T2DM patients with NAFLD and without NAFLD when compared to controls (p<0.001). Between the T2DM subjects the elevation in MDA and lowering of FRAP levels were more significant in T2DM patients with NAFLD when compared to T2DM without NAFLD (p=0.016 and p<0.001 respectively) as shown in (Figure 1).
Data presented as mean ±SD for MDA and median (inter quartile range) for FRAP and GSH. *Statistically significant between group 1 and group 3, † statistically significant between group 1 and group 2, and ‡statistically significant between group 2 and group 3. NS: not significant; MDA: malondialdehyde; FRAP: ferric reducing ability of plasma; GSH: reduced glutathione.
Adipokines, hs-CRP, and endotoxin levels in the study population
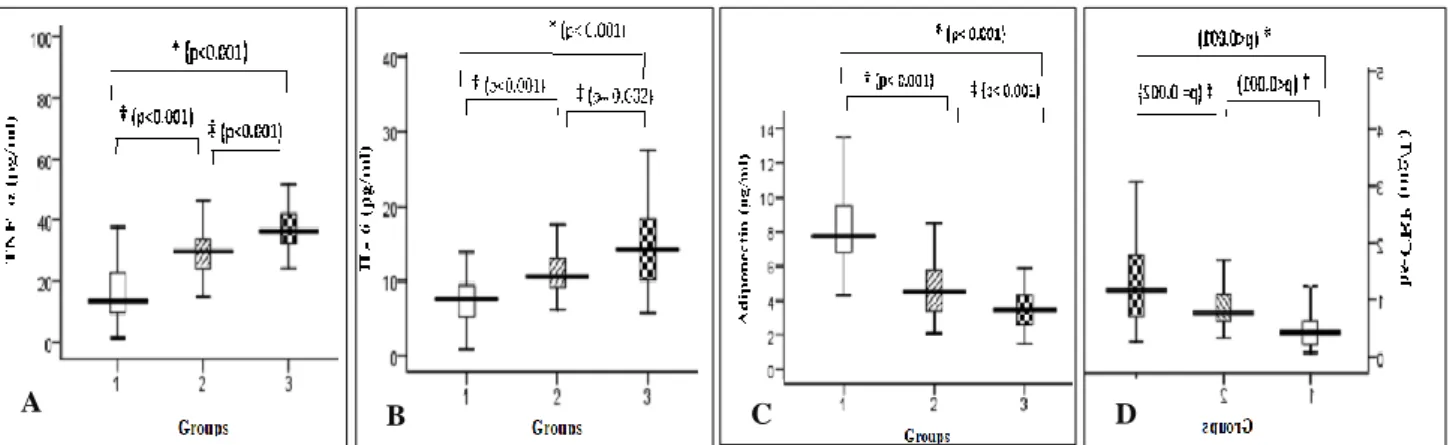
TNF-α, IL-6, hs-CRP, endotoxin was significantly elevated, and adiponectin was significantly lower across the groups (p<0·001) as shown in (Table 3). Significant increase in TNF-α, IL-6, hs-CRP, endotoxin and decrease in adiponectin in T2DM patients were observed in both groups of T2DM patients with NAFLD and without NAFLD when compared to controls (p<0.001).
Table 1: Baseline, anthropometric, and biochemical characteristics of study population.
Variable Group 1 (controls) (n=50)
Group 2 (T2DM without NAFLD) (n=50)
Group 3 (T2DM with NAFLD) (n=50)
Age (years) 43.38.6 46.88.4 45.27.8
Gender (M/F) 25/25 24/26 22/28
BMI (kg/m2) 24.53.4 25.34·2 27.24·5*‡
WC (cm) 87.5 (81-92) 89 (81-93) 91 (86-102) *‡ ±
Systolic BP (mm Hg) 119.85·1 120.66·5 1215 Diastolic BP (mm Hg) 78.83.2 794·6 80·2 3·1
FPG (mg/dL) 80.5 (75-90·2) 132 (119-162·7) † 148·5 (125·5-193·2) *‡±
PPPG (mg/dL) 107 (102·7-115) 235 (200-294·7) † 235 (196-326·5) *‡
Total bilirubin (mg/dL) 0.8 (0.5-0.9) 0.7 (0.5-0.8) 0.7 (0.4-0.8) Total protein (gm/dL) 8 (7.6-8.2) 8.1 (7.8-8.5) 8.1 (7.7-8.3) Albumin (gm/dL) 4.4 (4.2-4.5) 4.4 (4.3-4.6) 4.5 (4.2-4.6) Iron (g/dL) 108.633·7 109.330·9 118.732.9
TIBC(g/dL) 360 (347-383) 366 (357-378) 364 (355-379)
Transferrin saturation (%) 36 (25.7-41) 29 (25-34.2) 33 (25.5-39)
SGPT (IU/L) 15 (11-20.2) 14 (12-18.5) 17 (13-22.5)
SGOT (IU/L) 24 (20-28) 22.5 (19-27) 24 (20.7-29.2)
GGT(IU/L) 25 (19-33) 26 (19.5-35.2) 28 (22.7-39.2)
ALP (IU/L) 77 (60.7-89) 81·5 (64.7-91) 68 (58.7-96.2)
Statistically significant differences *across the groups, †group 1 and group 2, ‡group 1 and group 3, ±group 2 and group 3; Data presented as mean ±SD (Standard deviation) for normally distributed data and median, IQR (Inter quartile range) for skewed data. BMI: body mass index; WC: waist circumference; BP: blood pressure; FPG: fasting plasma glucose; PPPG: post prandial plasma glucose; SGPT: serum glutamate pyruvate transaminase; SGOT: serum glutamate oxaloacetate transaminase; ALP: alkaline phosphatase; GGT: gamma glutamyl transferase; TIBC: total iron binding capacity
Table 2: Oxidative stress and anti-oxidant status in the study population.
Variable Group 1 (controls) (n=50)
Group 2 (T2DM without NAFLD) (n=50)
Group 3 (T2DM
with NAFLD) (n=50) p-value*
MDA (µmol/L) 0.90.4 3.41.1 3.91 <0·001
FRAP (mmol/L) 0.36 (0.33-0.14) 0.31 (0.26-0.37) 0·24 (0.19-0.27) <0·001 GSH (mg/dL) 13 (11.6-18.8) 8.2 (7.1-9.6) 7.6 (6.4-8.7) <0·001 *Statistically significant; MDA: malondialdehyde; FRAP: ferric reducing ability of plasma; GSH: reduced glutathione.
Figure 1: Changes in (A) MDA, (B) FRAP, and (C) GSH in controls (group 1), T2DM without NAFLD (group 2), and T2DM with NAFLD (group 3).
Table 3: Adipokines, hs-CRP, and endotoxin levels in the study population.
Variable Group 1 (controls) (n=50)
Group 2 (T2DM without NAFLD) (n=50)
Group 3 (T2DM with NAFLD) (n=50)
p- value
TNF-α (pg/mL) 13.4 (9.6-22.7) 30 (24.2-33.9) 36.5 (32.6-42) <0·001* IL-6 (pg/mL) 7.7 (5.2-9.5) 10.5 (9.2-13.2) 14.2 (10.1-18.4) <0·001* Adiponectin (g/mL) 7.7 (6.8-9.6) 4.5 (3.3-5.8) 3.4 (2.6-4.3) <0·001* Leptin (ng/mL) 50.1 (35.4-83.5) 50.9 (30.7-78.8) 63.9 (40.1-103.5) 0·182 hs-CRP (mg/L) 0.4 (0.2-0.6) 0.7 (0.6-1.1) 1.1 (0.7-1.8) <0·001* Endotoxin (EU/mL) 0.25 (0.01-1.2) 3.4 (0.9-5.7) 5.2 (0.7-15.3) <0·001* *Statistically significant at p<0.05; Data presented as median (inter quartile range), TNF-α: tumor necrosis factor alpha; IL-6: interleukin-6; hs-CRP: highly sensitive C- reactive protein; EU: endotoxin unit
Figure 2: Changes in (A) TNF-α, (B) IL-6, (C) adiponectin, and (D) hs-CRP in controls (group 1), T2DM without NAFLD (group 2), and T2DM with NAFLD (group 3).
Data presented as median (inter quartile range). *Statistically significant between group 1 and group 3, †statistically significant between group 1 and group 2, and ‡statistically significant between group 2 and group 3.TNF-α: tumor necrosis factor alpha; IL-6: interleukin-6; hs-CRP: highly sensitive C- reactive protein.
Figure 3: Changes in endotoxin in controls (group 1), T2DM without NAFLD (group 2), and T2DM with
NAFLD (group 3).
Correlation between fasting plasma glucose (FPG), endotoxin, inflammatory markers, and oxidative stress markers in T2DM patients with NAFLD
FPG showed significant positive correlation with endotoxin (r=0.335; p<0.001), TNF-α (r=0.502;p <0.001), IL-6 (r=0.305; p <0.001), and MDA (r=0.654; p <0.001) and significant negative correlation with FRAP (r=-0.542; p<0.001), GSH (r=-0.542; p<0.001), and adiponectin (r=-0.622; p<0.001). Endotoxin showed significant positive correlation with TNF-α (r=0.304; p <0.001), hs-CRP (r=0.193; p=0.018), and MDA (r=0.420; p<0.001) and significant negative correlation with FRAP (r=-0.418; p<0.001), GSH (r=-0.367; p<0.001), and adiponectin (r=-0.406; p<0.001). TNF-α showed significant positive correlation with MDA (r=0.526; p <0.001) and significant negative correlation with FRAP (r=-0.418; p<0.001), GSH (r=-0.353; p<0.001), and adiponectin (r=-0.396; p<0.001). IL-6 showed significant positive correlation with MDA (r=0.229; p =0·005) and significant negative correlation with FRAP (r=-0.170; p =0.038), GSH 0.301; p <0.001), and adiponectin (r=-0.318; p <0.001). Hs-CRP showed significant positive correlation with MDA (r=0.186; p =0·023). MDA showed significant negative correlation with FRAP
0.551; p<0.001), GSH (r=-0.588; p<0.001), and
adiponectin (r=-0.515; p<0.001). FRAP showed significant positive correlation with GSH (r=0.429; p
<0.001), and adiponectin (r=0.561; p<0.001). GSH showed significant positive correlation with adiponectin (r=0.555; p <0.001) as shown in (Table 4).
Table 4:Correlation between fasting plasma glucose, endotoxin, inflammatory markers and oxidative stress markers.
Variables Endotoxin TNF-α IL-6 hs-CRP MDA FRAP GSH Adiponectin
FPG
r 0.335 0.502 0.305 0.124 0.654 -0.542 -0.542 -0.622
p-value <0.001* <0.001* <0.001* 0.132 <0.001* <0.001* <0.001* <0.001*
Endotoxin
r - 0·304 0·034 0.193 0.420 -0.418 -0.367 -0.406
p-value - <0·001* 0·682 0.018* <0·001* <0·001* <0·001* <0·001*
TNF-α
r - - 0.133 0.063 0.526 -0.418 -0.353 -0.396
p-value - - 0.104 0.447 <0.001* <0.001* <0.001* <0.001*
IL-6
r - - - 0.151 0.229 -0.170 -0.301 -0.318
p-value - - - 0.066 0.005* 0.038* <0.001* <0.001*
hs-CRP
r - - - - 0.186 -0.042 -0.115 -0.073
p-value - - - - 0.023* 0.612 0.160 0.377
MDA
r - - - -0.551 -0.588 -0.515
p-value - - - <0.001* <0.001* <0.001*
FRAP
r - - - 0.429 0.561
p-value - - - <0.001* <0.001*
GSH
r - - - 0.555
p-value - - - <0.001*
*Statistically significant; r: correlation coefficient; FPG: fasting plasma glucose, TNF-α: tumor necrosis factor alpha; IL-6: interleukin-6; hs-CRP: highly sensitive C- reactive protein; MDA: malondialdehyde; FRAP: ferric reducing ability of plasma; GSH: reduced glutathione
Logistic regression analysis to evaluate predictors of NAFLD among T2DM patients
Table 5: Univariate logistic regression analysis.
Odds ratio Exp (B)
95% CI lower
upper p-value*
TNF-α 0·920 0·874 0·969 0·002 IL-6 0·839 0·756 0·932 0·001 Adiponectin 1·773 1·274 2·468 0·001 Endotoxins 0·877 0·809 0·951 0·015 hs-CRP 0·325 0·155 0·680 0·003 MDA 0·639 0·435 0·940 0·023 BMI 0·904 0·822 0·993 0·035 WC 0·946 0·905 0·988 0·013 *Statistically significant; CI: confidence interval; Exp (B): exponentiation of the B coefficient; TNF-α: tumor necrosis factor alpha; IL-6: interleukin-6; hs-CRP: high sensitive C-reactive protein; MDA: malondialdehyde; BMI: body mass index; WC: waist circumference.
Univariate logistic regression analysis was performed keeping the binary categorical variable (NAFLD) as the dependent variable and the continuous variables as independent variables. TNF-α, IL-6, adiponectin, endotoxins, hs-CRP, MDA, BMI, and WC were found to be significant independent predictors (p=0·002, p=0·001, p=0·001, p=0·015, p=0·003, p=0·029, p=0·035, and p=0·013 respectively) of NAFLD in T2DM patients as shown in (Table 5).
Table 6: Multivariate logistic regression analysis.
Odds ratio EXP (B)
95% CI Lower upper
p-value
TNF-α 0.907 0.843 0.975 0·008* IL-6 0.897 0.761 1.057 0·194 Adiponectin 1.673 1.091 2.567 0·018* Endotoxins 0.777 0.667 0.905 0·001* hs-CRP 0.313 0.099 0.991 0·040* MDA 0.646 0.370 1.129 0·125 BMI 1.036 0.872 1.231 0·688 WC 0.894 0.821 0.974 0·010* *Statistically significant; CI: confidence interval; Exp (B): exponentiation of the B coefficient; TNF-α: tumor necrosis factor alpha; IL-6: interleukin-6; hs-CRP: high sensitive C-reactive protein; MDA: malondialdehyde; BMI: body mass index; WC: waist circumference.
DISCUSSION
The significantly higher waist circumference observed in T2DM patients with NAFLD is indicative of presence of abdominal adiposity, which appears to be an important risk factor for development of NAFLD, even in those with a normal BMI.16,17 The relationship between
increased waist circumference and NAFLD can be explained by the ‘portal hypothesis’, which suggests that increased visceral adipose tissue lipolysis leads to an elevated flux of free fatty acids into the portal vein for direct transport to the liver, resulting in increased hepatic fat, which suggests that visceral fat is an important contributor of liver fat content.18
The endoplasmic reticulum stress due to metabolic dysregulation is accompanied by accumulation of unfolded proteins and generation of ROS and consequently, oxidative stress.19 The present study
observed presence of oxidative stress in both T2DM without and with NAFLD when compared to controls as evidenced by elevated MDA, lowered FRAP and GSH levels (Table 2) . In line with our finding, studies have reported significant increase in serum concentration of MDA, depletion of GSH and significantly lower FRAP levels in T2DM and/or NAFLD when compared to controls.20,21 Several lines of evidence suggest that
chronic oxidative stress may be important in the pathogenesis and progression of NAFLD.21,22 Similarly
present study observed that oxidative stress was more pronounced in T2DM with NAFLD when compared to T2DM as indicated by a pronounced elevation in MDA, a pronounced lowering of FRAP levels, indicative of exacerbation of oxidative stress in NAFLD of T2DM.
Oxidative stress may lead to activation and release of proinflammatory cytokines. The potential role of inflammatory molecules in the development of NAFLD in T2DM patients has been hypothesized. The present study observed elevation of TNF-α and IL-6 in T2DM patients which was more pronounced in T2DM with
NAFLD (Table 3). Our results are in line with studies reporting similar elevations in serum concentrations of TNF-α and IL-6 in T2DM patients with NAFLD as compared with T2DM patients without NAFLD.20,21 Our
findings of a pronounced increase in proinflammatory cytokines in T2DM patients with NAFLD was associated with hyperglycemia and oxidative stress, as evidenced by a significant positive correlation of TNF-α and IL-6 with FPG, and MDA and significant negative correlation with FRAP and GSH (Table 4). Inflammation was observed as an elevation in hs-CRP levels in both groups of T2DM patients when compared to controls. This elevation was more pronounced in T2DM with NAFLD when compared to T2DM without NAFLD, indicating a progressive inflammatory state. In present study authors observed significant positive correlation between hs-CRP and MDA. These findings support the relationship between oxidative stress and inflammation.
In this study, significantly lower adiponectin levels in T2DM patients with NAFLD when compared to T2DM patients without NAFLD and controls were observed. In accordance with our reports, some studies, including an Indian study reported significantly lower serum adiponectin level in T2DM and/or NAFLD patients than in the control group.21,23,24 Adiponectin may preserve
liver function by preventing lipid accumulation in hepatocytes. Hence, hypoadiponectinemia observed in T2DM, may play a key role in the pathogenesis of NAFLD. The underlying mechanism for lower adiponectin levels may be due to elevated TNF-α and IL-6 levels, which suppress the transcription of adiponectin in adipocytes. In support of this authors found a significant negative correlation of adiponectin with TNF-α and IL-6. However no significant difference in leptin levels among the three groups was found. Our findings are in accordance to a study which observed no significant change in leptin levels in T2DM patients in comparison with healthy controls.25 In the present study
74% of the T2DM patients with NAFLD and 54% T2DM patients without NAFLD were on treatment with metformin (3 months to 1 year). Metformin is known to reduce leptin levels in addition to its effect on glucose homeostasis.26
functional measure of the endotoxin activity.
Endotoxin/HDL ratio was significantly high in T2DM patients with NAFLD when compared to T2DM patients without NAFLD (p=0·030) (data not shown). This suggests that endotoxin activity is high in T2DM patients with NAFLD. High endotoxin activity combined with low HDL levels was found to increase the risk for cardiovascular disease.28 Our findings of significant
positive correlation of endotoxin with TNF-α, hs-CRP, and MDA and a significant negative correlation with adiponectin, FRAP, and GSH (Table 4) indicate the association of endotoxinemia with the inflammatory state and oxidative stress. Endotoxin, by itself is reported to be a potent inducer of proinflammatory state.29
Experimentally induced endotoxemia has been reported to produce increase in TNF-α which produces a lowering of adiponectin levels which put together were found to induce insulin resistance.30 In this study, hyperglycemia
as higher FPG was also found to have a significant positive correlation with endotoxin (Table 4). Elevated glucose levels have been shown to cause adverse effects on intestinal motility by potentiating endotoxin absorption through inhibition of gut motility.31 If the gut
flora turns out to be an important determinant of endotoxin levels in humans, treatment with probiotics may prove to be beneficial in NAFLD.
Identifying the best predictors of NAFLD may serve as targets for therapeutic interventions thereby helping in the prevention of development of liver disease in T2DM patients. Hence logistic regression analysis was carried out by introducing each individual variable that was found to be significantly altered in T2DM subjects into the univariate model. The findings revealed that TNF-α, IL-6, adiponectin, endotoxin, hs-CRP, MDA, BMI, and WC had a significant association with NAFLD among T2DM patients (Table 5). When all these variables were introduced in the multivariate model the findings revealed that TNF-α, adiponectin, endotoxin, hs-CRP, and WC remained significantly associated with NAFLD in T2DM (Table 6). Among these parameters’ adiponectin had highest odds ratio, suggesting that low adiponectin levels may serve as a strong predictor of NAFLD among T2DM patients.
The limitations for the present studies were the cross-sectional design of this study precludes the establishment of causal or temporal relationship among NAFLD and T2DM, diagnosis of NAFLD was based on ultrasound imaging and was not confirmed by liver biopsy. However, ultrasonography is the most common method of diagnosing NAFLD in clinical practice and has a sensitivity of 82 to 89% and a specificity of 93% for identifying fatty liver infiltrate.32
CONCLUSION
The findings of the present study demonstrate presence of inflammation, oxidative stress, elevated TNF-α, IL-6, lowered adiponectin and endotoxemia, which were
observed in both groups of T2DM subjects when compared to controls and was more pronounced in T2DM patients with NAFLD when compared to T2DM patients without NAFLD, suggests that these may be the initiating factors for development of NAFLD in T2DM. Among these markers the low adiponectin levels observed may be considered as the best predictor of presence of NAFLD among patients with T2DM. Adipokines and endotoxins being key players in the pathogenesis and progression of NAFLD may serve as therapeutic targets considering that there are no specific treatment options available for NAFLD. Hence the use of adipokine based therapeutic agents which are said to have hepatoprotective actions along with specific inhibitors directed towards TNF-α and probiotics may be beneficial in decreasing the systemic inflammatory response.
Funding: Funded by Sri Balaji AarogyaVaraprasadini scheme (SBAVP) of Sri Venkateswara Institute of Medical Sciences, SVIMS University, Tirupati, India Conflict of interest: None declared
Ethical approval: The study was approved by the Institutional Ethics Committee
REFERENCES
1. Kim CH, Younossi ZM. Nonalcoholic fatty liver disease: a manifestation of the metabolic syndrome. Cleve Clin J Med. 2008;75(10):721-8.
2. Pagano C, Soardo G, Esposito W, Fallo F, Basan L, Donnini D, et al. Plasma adiponectin is decreased in nonalcoholic fatty liver disease. European J Endocrinol. 2005;152(1):113-8.
3. Mikako O, Hirofumi N. Diagnosis and evaluation of non-alcoholic fatty liver disease. Exp Diab Res. 2012.
4. Duseja A. Nonalcoholic fatty liver disease in India-a lot done, yet more required!. Indian J Gastroenterol. 2010;29(6):217-25.
5. Day CP, James OF. Steatohepatitis: a tale of two "hits"? Gastroenterol. 1998;114:842-5.
6. Das SK, Balakrishnan V. Role of cytokines in the pathogenesis of non-alcoholic fatty liver disease. Indian J Clinic Biochem. 2011;26(2):202-9.
7. Prashanth M, Ganesh HK, Vima MV, John M, Bandgar T, Joshi SR, et al. Prevalence of nonalcoholic fatty liver disease in patients with type 2 diabetes mellitus. J Assoc Physic India. 2009;57(3):205-10.
8. Fruci B, Giuliano S, Mazza A, Malaguarnera R, Belfiore A. Nonalcoholic fatty liver: a possible new target for type 2 diabetes prevention and treatment. Int J Molecular Sci. 2013;14(11):22933-66.
10. American diabetes association. Diagnosis and
classification of diabetes mellitus. Diabetes Care. 2010;33(1):S62-9.
11. Zeng MD, Fan JG, Lu LG, Li YM, Chen CW, Wang BY, et al. Guidelines for the diagnosis and treatment of nonalcoholic fatty liver diseases. J Digestive Dis. 2008;9(2):108-12.
12. Garrow JS, Webster J. Quetelet's index (W/H2) as a measure of fatness. Int J Obesity. 1985;9(2):147-53. 13. Tukozkan N, Erdamar H, Seven I. Measurement of
total malondialdehyde in plasma and tissues by high-performance liquid chromatography and thiobarbituric acid assay. Firat Tip Dergisi. 2006;11(2):88-92.
14. Benzie IF, Strain JJ. The ferric reducing ability of plasma (FRAP) as a measure of antioxidant power: the FRAP assay. Analytical Biochem. 1996;239(1):70-6.
15. Ellman GL. Tissue sulfhydryl groups. Archives Biochem Biophysic. 1959;82(1):70-7.
16. Angulo P. Nonalcoholic fatty liver disease. New Eng J Med. 2002;346(16):1221-31.
17. Verrijken A, Francque S, Van Gaal L. The role of visceral adipose tissue in the pathogenesis of non-alcoholic fatty liver disease. European Endocrinol. 2011;7(2):96-103.
18. Kuppan G, Anjana RM, Deepa M, Paramasivam P, Chandrakumar S, Kaliyaperumal V, et al. Inflammatory markers in relation to nonalcoholic fatty liver disease in urban South Indians. Diabetes Technol Therapeut. 2012;14(2):152-8.
19. Narasimhan S, Gokulakrishnan K, Sampathkumar R, Farooq S, Ravikumar R, Mohan V, et al. Oxidative stress is independently associated with non-alcoholic fatty liver disease (NAFLD) in subjects with and without type 2 diabetes. Clinic Biochem. 2010;43(10-11):815-21.
20. Shams ME, Al-Gayyar MM, Barakat EA. Type 2 diabetes mellitus-induced hyperglycemia in patients with NAFLD and normal LFTs: relationship to lipid profile, oxidative stress and pro-inflammatory cytokines. Scientia Pharm. 2011;79(3):623-34. 21. Kumar R, Prakash S, Chhabra S, Singla V, Madan
K, Gupta SD, et al. Association of pro-inflammatory cytokines, adipokines and oxidative stress with insulin resistance and non-alcoholic fatty liver disease. Indian J Med Res. 2012;136(2):229. 22. Baskol G, Baskol M, Kocer D. Oxidative stress and
antioxidant defenses in serum of patients with non-alcoholic steatohepatitis. Clinic Biochemist. 2007;40(11):776-80.
23. Weyer C, Funahashi T, Tanaka S, Hotta K, Matsuzawa Y, Pratley RE, et al.
Hypoadiponectinemia in obesity and type 2 diabetes: close association with insulin resistance and hyperinsulinemia. J Clinic Endocrinol Metabol. 2001;86(5):1930-5.
24. Lindsay RS, Funahashi T, Hanson RL, Matsuzawa Y, Tanaka S, Tataranni PA, et al. Adiponectin and development of type 2 diabetes in the Pima Indian population. Lancet. 2002;360(9326):57-8.
25. Chalasani N, Crabb DW, Cummings OW, Kwo PY, Asghar A, Pandya PK, et al. Does leptin play a role in the pathogenesis of human nonalcoholic steatohepatitis?. Am J Gastroenterol. 2003;98(12):2771-6.
26. Nar A, Gedik O. The effect of metformin on leptin in obese patients with type 2 diabetes mellitus and nonalcoholic fatty liver disease. Acta Diabetol. 2009;46(2):113-8.
27. Lassenius MI, Pietiläinen KH, Kaartinen K, Pussinen PJ, Syrjänen J, Forsblom C, et al. Bacterial endotoxin activity in human serum is associated with dyslipidemia, insulin resistance, obesity, and chronic inflammation. Diabetes Care. 2011;34(8):1809-15.
28. Laugerette F, Vors C, Peretti N, Michalski MC. Complex links between dietary lipids, endogenous endotoxins and metabolic inflammation. Bioch. 2011;93(1):39-45.
29. Marshall JC. Glucose, insulin, coagulation: endotoxin as exohormone. Blood. 2008;112(1):6-7. 30. Keller P, Møller K, Krabbe KS, Pedersen BK.
Circulating adiponectin levels during human endotoxaemia. Clinic Exp Immunol. 2003;134(1):107-10.
31. Byrne MM, Pluntke K, Wank U, Schirra J, Arnold R, Göke B, et al. Inhibitory effects of hyperglycaemia on fed jejunal motility: potential role of hyperinsulinaemia. European J Clinic Investiga. 1998;28(1):72-8.
32. Joseph AE, Saverymuttu SH, Al-Sam S, Cook MG, Maxwell JD. Comparison of liver histology with ultrasonography in assessing diffuse parenchymal liver disease. Clinic Radiol. 1991;43(1):26-31.
Cite this article as: Pallavi M, Suchitra MM, Sachan A, Lakshmi AY, Srinivasa RPVLN. Role of