Mema Devi Waikhom, Th. Binoy Singh IJSRE Volume 06 Issue 05 May 2018 Page 7945
Volume||6||Issue||05||May-2018||Pages-7945-7949||ISSN(e):2321-7545 Website: http://jsae.in Index Copernicus Value- 76.10 DOI: http://dx.doi.org/10.18535/ijsre/v6i5.05
Abundance & Relationship Of Acarines And Collembolas With The Organic
Carbon, Cu, Fe, Zn and Mn of phumdi Soil of Keibul Lamjao National
Park(KLNP),Manipur.
Authors
Mema Devi Waikhom1, Th. Binoy Singh2.
1Zoology Dept., G.P.Women’s College,P.G. Centre, Imphal.
Email: [email protected]
2
Centre for Advanced Studies, Life Sciences Dept. Manipur University, Imphal. ABSTRACT
Soil microarthropods specially Acarines and Collembolas are considered to be the most important group in litter decomposition, thereby in releasing nutrients and hence in nutrient cycling in all ecosystems. Keibul Lamjao National Park (KLNP) is a unique and peculiar habitat and only one of its kind all over the world. This study examined the abundance of Acarines, Collembolas and their relationship with the organic Carbon and micronutrients of phumdi, monthly , for one year. F test values of C (F=3628.98; P<0.01), Cu(F=1274.07; P<0.01), Fe(F=17077.12; P<0.01), Zn(F=20305.09; P<0.01), and Mn(F=340435.87; P<0.01) are found showing highly significant relationship within the months. Linear relations among the parameters and microarthropods at zero order correlation coefficient are also analysed.
Key words: Acarines, Collembolas, Phumdi
INTRODUCTION
Mema Devi Waikhom, Th. Binoy Singh IJSRE Volume 06 Issue 05 May 2018 Page 7946
MATERIAL AND METHODS
The present investigation was carried out for one year, from January to December 2016. The study area was demarcated into three sites -Site I: near the boundary of the park region, Site II: about 100 m from the boundary and Site III: the interior of the Park area. Phumdi samples were collected on monthly intervals by using a sharp dagger for cutting the Phumdi. Three replicates were taken from each site. All together nine samples were taken for every month. A total of 108 samples were collected during the study period. The Phumdi samples were taken to the laboratory for extraction and transferred to the extraction box as soon as possible.
Soil organic carbon was measured by Oxidation calorimetric method [ 4 ] . Estimation of micronutrients viz, Cu, Fe, Zn and Mn was done by dissolving ash in 2N HCl method [ 5 ].
The extraction of Phumdi soil was based on the modified Tullgren funnel [ 6 ] & [7 ]. The heating source for each funnel was a 40 watt electric bulb. Low settings were used so that the soil animals may not be trapped inside the rapidly drying soil. The extraction was left to dry for 5-7 days. The extracted animals were collected in the tube containing solution of 80 % ethanol and 1% glycerine. At the end of the extraction period the tubes containing the extracted fauna were removed from the funnels. The contents of the tube were washed into the petri dishes several times with 80% alcohol. The animals were sorted out into different groups with the help of a fine pipette and No. 0 brush. Counting was done using a dissecting binocular microscope. Preservation was done in 87 parts of 70 % alcohol, 5 parts by glycerol and 8 parts glacial acetic acid. All the counts were expressed as monthly averages per 500 gm of dry soil.
RESULTS AND DISCUSSIONS
Analysis of organic Carbon and Micro elements like Copper (Cu), Iron (Fe), Zinc (Zn) and Magnesium (Mn) are shown in Table- 1.
Organic Carbon concentration calculated in terms of percentage is found to be minimum 5.4 (April) and maximum 17.5 (Oct.) during the study period. Higher C contents are recorded in the months of Sep. and Oct. However more or less equal amount of C contents are recorded in all the months except the month of April where minimum C content also recorded.
Total Copper (Cu) is calculated in mg/Kg and is shown in Table- 9. Minimum value is recorded during the month of May (1.80) and maximum (7.55) in the month of April. Sudden decline in the value of Cu is observed from April to May and some increase and again decrease is observed in the remaining months until it reaches its maximum value in April.
Total monthly Ferric content is calculated for one year in mg/Kg and is shown in Table- 9. Extremely high values of iron content are found in all the study months. The maximum value is obtained during the month of April (1963) and minimum in October (1520). Average high Ferric content or values without many fluctuations are observed in all the months of the study period.
Another micro element analysed during the study period is Manganese (Mn) and calculated in terms of mg/Kg. The values ranged from a minimum (69.8) to a maximum of 221.3 (September) during the study period . Unlike Fe, its value show drastic rise and fall in between the months.
The last micronutrient analysed is Zinc (Zn) and its monthly values are shown in Table -1. Its values ranged from 10.1 (September) to 49.6 (April) with a sudden rise in the month of April.
Mema Devi Waikhom, Th. Binoy Singh IJSRE Volume 06 Issue 05 May 2018 Page 7947
deviation) of these parameters with respect to different months is shown in Table -1. A significant monthly variation on the levels of each parameter has been observed during the 12 months (P<0.01).
A dissimilar pattern of variations in the parameters under study is seen according to different twelve months in a year. The highest percentage level of Organic Carbon in the observed soil is noted to be (17.5 0.08)% in the month of October followed by September (17.40.10)% and the lowest level of (5.40.05)% is
found in April while its annual average is (13.83.06) %. The twelve months variation in the percentage levels of Organic Carbon of the soil is observed to be highly significant as witnessed by the F test - value (3628.98; P<0.01). While the twelve months average level of Copper nutrient (Cu) in the soil is (3.61.46) mg/kg, its highest level, (7.60.06) mg/kg is observed in the month of April and the lowest level (1.8 0.11) mg/kg is found in May.
Here, a non-linear trend in the level of Cu nutrient of the soil is confirmed at the study site. The variation in Cu level is found to be highly significant (F=1274.07; P<0.01) according to the experimental result. In case of Fe, the highest level of (19631.50) mg/kg is noted in the month of April and lowest level (15202.09) mg/kg is found in October while its twelve months average is (1723130.38) mg/kg of the experimental soil. This variation is found to be highly significant (F=17077.12, P<0.01). A highly significant variation (P<0.01) in the Zn nutrient of the soil is also witnessed. The extremely high level of (49.60.05) mg/kg is again found in April and the lowest level, (10.10.02) mg/kg is observed in September. While the average Mn nutrient during the twelve months under observation is (146.961.50) mg/kg, its maximum level of( 221.30.04 ) has been found in the month of October and the lowest level, (81.10.02) mg/kg in July. It is also having highly significant variation (P<0.01) of the Mn nutrient of the experimental soil according to twelve months of the study period.
From the above results it can be concluded that all the micronutrients in the KLNP soil are very high, organic matter is high, percent based saturation is high and iron(Fe) content is extremely high. The probable reason is that Fe availability depends much on ecological condition. The litter of the vegetation may have high Fe content due to which the Fe content in the organic matter is high. We cannot neglect the climatic factor such as heavy rainfall. Heavy rainfall areas have high Fe content because of the weathering of nutrients by the sedimentary rocks. Acid soils in which extremely large concentrations of Fe in the soil solution arise as a result of the soils’ peculiar mineralogy, poorly drained sandy soils in valleys receiving interflow water from adjacent areas. If not checked in time, the iron toxicity may lead to severe adverse effects to the phumdi soil of KLNP.
The Acarina reaches its maximum value to 418.09 (May) and sharply decline to 20.72 (Aug.). Likewise, Collembola reaches its maximum value 104.43( June) and suddenly falls down to its lowest 6.93 (Aug), shown in Tab. 2. Acarina and Collembola were found to be significantly correlated with NPK and moisture content of the KLNP soil [8]. Correlation coefficient of Collembola with all C, Cu, Fe, Zn and Mn are found to be negatively correlated or insignificantly correlated showing adverse relationships. If the concentration of these elements increase, the Collembolan population will be reduced and soil will become unfertile. However, with Acarina significant positive correlations are obtained with Cu, Fe and Zn (Table-4). That may be the reason for having higher population density of Acarina than Collembola (Table -2).
Mema Devi Waikhom, Th. Binoy Singh IJSRE Volume 06 Issue 05 May 2018 Page 7948
Lastly, the park managers must realise the role of soil animals particularly soil microarthropods and how important groups of soil animals they are in maintaining the habitat by performing decomposition and mineral cycling providing nutrients for the grasses , the food plants of brow antlered deer of KLNP. If necessary some manipulation may be made for the sustenance of phumdi forever.
Table 1: Monthly variation in the average levels of organic carbon and micronutrients
Month Organic carbon (%)
Total Cu
(mg/kg) Total Fe (mg/kg) Total Zn (mg/kg)
Total Mn (mg/kg) Jan 15.0.11 2.9.07 17241.53 12.0.03 134.7.12 Feb 12.3.05 3.7.12 16771.51 13.3.10 157.8.05 Mar 13.3.02 3.1.07 18961.52 12.4.02 216.5.07 Apr 5.4.05 7.6.06 19631.50 49.6.05 215.9.53 May 12.8.13 1.8.11 18662.03 15.9.02 207.5.04 Jun 14.9.05 2.4.04 16251.05 10.5.01 69.8.03 Jul 15.7.12 4.2.03 15433.01 12.7.03 81.1.02 Aug 12.4.18 3.1.05 16991.00 14.8.03 83.5.07 Sep 17.4.10 3.0.06 17632.08 10.1.02 221.3.04 Oct 17.5.08 2.8.07 15202.09 12.8.01 88.0.33 Nov 14.3.09 4.8.10 16742.00 13.7.04 83.2.04 Dec 14.1.07 4.4.09 17341.05 21.5.03 203.9.04 Total 13.83.06 3.61.46 1723130.38 16.610.49 146.961.50
F-Test 3628.98 P<0.01
1274.07 P<0.01
17077.12 P<0.01
20305.09 P<0.01
340435.87 P<0.01
Table 2: Mean population densities of Collembola & Acarina per 500 gm of dry phumdi soil during the study period .
Month Mesofauna
(Collembolla) (Acarina)
January 51.48 167.12
February 60.71 238.50
March 84.90 339.63
April 87.94 146.57
May 97.06 416.09
June 104.43 122.86
July 15.78 23.67
August 6.93 20.72
September 27.69 36.93
October 18.43 43.02
November 12.50 37.45
December 45.45 86.36
Total 51.11 139.91
P-values of F-test P<0.001 P<0.001
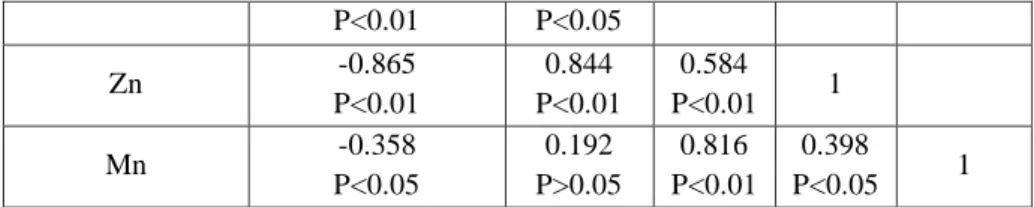
Table 3: Correlation Matrix of Micronutrients
Parameters Organic Carbon Cu Fe Zn Mn Organic Carbon 1
Cu -0.692
P<0.01 1
Mema Devi Waikhom, Th. Binoy Singh IJSRE Volume 06 Issue 05 May 2018 Page 7949
P<0.01 P<0.05
Zn -0.865
P<0.01
0.844 P<0.01
0.584 P<0.01 1
Mn -0.358
P<0.05
0.192 P>0.05
0.816 P<0.01
0.398
P<0.05 1
Table 4: Zero order Correlation Coefficient(r) of Acarina & Collembola with organic C and micronutrients: Parameters Organic Carbon Cu Fe Zn Mn
Acarina 0.323 0.095 0.049 0.069 - 0.262 Collembola 0.334 -0.063 - 0.692 -0.865 -0.360
REFERENCES
1. Samungou, K. 2000. In. Wildlife in Manipur . 117 - 120 .
2. Samungou, K. 2010. In. Endangered Manipur Brow Antlered Deer. An Environmental Assessment. 7 - 29 .
3. Salmon, S. 2004. The impact of earthworms on the abundance of Collembola: Improvement of food resources or of habitat ? Biology and Fertility of soils 40, pp. 323-333.
4. Anderson, J.H. and J.S. Ingram I Eds. 1993 . Tropical soil Biology andFertility: A hand book of Method, U.K. C.A.B International. 67
5. Chapman, H.D., P.F. Pratt. 1961. Methods of Analysis for soils, plants and waters. University of California, Riverside, CA.
6. Macfadyen. A., 1969. The systemic study of soil ecosystem , In sheals J.G.(Editor). The soil ecosystem:A symposium systematic Association publication 8 . London :pp . 191-197.
7. Luxton. M., 1981. Studies on the Astigmata mites of a Danish beech wood soil, Pedobiologia . 22:29-38.
8. Mema, D.W., 2013. Influence of NPK and moisture content on the population density of below ground fauna at Keibul Lamjao National Park of Manipur. IJSER. 4(10): pp 1282- 1285.
9. Dhillon,B.S. & N.H.E.Gibson., 1962. A study of Acarina and Collembola of agricultural soils 1 numbers and distribution in undisturbed grassland, Pedobiologia 1: 189 – 209.
10. Hale,W.G. 1966. A population study of moorland Collembola, Pedobiologia 6: 65 – 99.