Emerging Science Journal
Vol. 2, No. 3, June, 2018
An Investigation on the Correlation of Inter-story Drift and
Performance Objectives in Conventional RC Frames
Saeed Rastegarian
a, Ashkan Sharifi
b*a Department of Civil Engineering, Fars science and Research Branch, Islamic Azad University, Fars, Iran . b Department of Civil Engineering, Shiraz Branch, Islamic Azad University, Shiraz, Iran.
Abstract
The main objective of this study is interpreting the probable dependency of structural performance level and its corresponding story drift in conventional RC moment frames. For this purpose, inter-story drift as dependent variable and other structural characteristics such as strength of materials, structural dimensions and internal loads as independent variables have been assumed. Specimens were studied by means of pushover analysis, then independent and dependent variables have been recorded for each member. Correlation of all variables were examined extensively and finally accurate equations have been proposed to predict inter-story drift at performance objectives.
Keywords:
Performance-based Seismic Design; Inter-story Drift;
Structural Performance Objectives; RC Frame.
Article History:
Received: 28 January 2018
Accepted: 10 June 2018
1-
Introduction
Inter-story drift is one of the most tangible structural concepts among practical engineers regarding its definition and calculation. On the other hand determination of structural performance level requires significant knowledge, time and experience. Hence, finding any reliable approach which uses Inter-story drift to evaluate structural performance level is desirable. One of the first technical texts that defines the relation between inter-story drift and performance levels is FEMA-273 [1]. In this guide permanent and temporary inter-story drift range are specified for each structural system. These values are repeated in the FEMA-356 [2] and ACSE41-06 [3] with no change. And finally Standard ASCE41-13[4] replaced former mentioned inter-story drift values with description of inter-story drift at structural performance objectives. In all above-mentioned references it is stated that “Drift values in these tables are not intended to be used as acceptance criteria for evaluating the acceptability of a rehabilitation design in accordance with the analysis procedures provided in this standard; rather, they are indicative of the range of drift that typical structures containing the indicated structural elements may undergo when responding within the various structural performance levels. The values indicated are intended to be qualitative descriptions of the approximate behavior of structures meeting the indicated levels.
In the past decade, considerable research has been conducted to quantify performance objectives. Arduran and Yakut [5], Ghobarah [6], Haselton and Dierlein [7] and Bebamzadeh [8] reported that the proposed inter-story ranges in regulations are conservative. They believe variables such as yielding strength of reinforcement, slenderness ratio, axial load ratio and transverse reinforcement ratio are the most effective parameters of assessment of inter-story drift at performance objectives. According to these studies the current expression of the corresponding inter-story drift at performance levels is not authentic; so, the criterion should be defined based on a combination of structural variables such as section cracking, soil type, boundary conditions, story height and regional seismicity specifications.
relationships to predict inter-story drift of RC frames at certain performance levels is not out of reach. Although it needs sufficient statistical data and extensive study.
Where:
ρs: Volumetric ratio of transverse reinforcement, N⁄N0: Axial load ratio, V: Shear force at the critical section bw:
Width of the web reinforcement, d: Flexural depth of the section, fc: Concrete compressive strength, fyk: Yielding
strength of longitudinal reinforcement, L/H: Slenderness ratio.
One of the most robust recent research on quantification of performance objectives have been conducted by Sharifi et al. [11]. They delimitated rebar and concrete core strain at performance levels. The large number of statistical samples and precise structural modeling are the strengths of this study. Table 1 shows strain ranges which has proposed by them. In this article table 1 values have been used to quantify performance objectives by their corresponding inter-story drift.
Table 1. Strain values corresponding performance levels [11].
Performance Level Concrete core limits Rebar strain limits
Square column Circular column
Operational 0 < εc ≤ 0.35 εcc εs < 0.06εsu εs < 0.06εsu
Immediate occupancy 0.35εcc < εc ≤ εcc εs < 0.25εsu εs < 31εsu
Life safety εcc < εc ≤ εcu & fcc ≥ fc > 0.8fcc εs < 0.58εsu εs < 0.58εsu
Collapse prevention εcc < εc ≤ εcu & 0.8fcc ≥ fc > 0.5fcc εs < εsu εs < εsu
2-
Modeling and Analysis
The primary objective of this study was determining a logical relationship between inter-story drift and structural performance objectives for conventional reinforced concrete moment frame. In order to achieve this goal, first of all statistical samples should be defined which are proper representative of the target population - conventional reinforced concrete moment frame. Sufficient range of data was required to achieve reliable relationship between the dependent and independent variables. Therefore, a sensitivity analysis has been done on the independent variables, a number of decisions were taken which will be described below, and finally 41 moment frames with intermediate ductility have been assumed as conventional frame specimens. The frames have 4, 8 and 12 stories make a total number of 328 sample stories. Frames specifications range are presented in Table 2. Seismic design of the frames has been done based on standard no. 2800 4th edition – Iranian code of practice for seismic resistant design of buildings [12]. Seismic assumptions have been chosen as Shiraz city in Iran, residential building and soil type three. Gravity loading of samples assigned assuming regular plans for a mid-span frame loading 3 meters from each side (total of six meters loading span). Controlling parameter in the design procedure was mainly allowable drift.
It should be noted that according to section 9-13-7-6 of ninth issue of Iranian national building regulations [13], using rebar higher than grade S400 is forbidden; as lower grades are not common, only steel grade S400 was used. And according to the current state of conventional structures in Iran, concrete grades C20, C25 and C30 have been used.
Considering intermediate ductility conditions of ninth issue of Iranian national building regulations, transverse reinforcement ratio of all samples were limited to about 0.5 percent.
Table 2. Specimens’ specifications.
Statistical samples were designed in accordance with ninth and sixth issues of Iranian national building regulations, respectively reinforced concrete buildings design and construction [13] and loads on buildings [14, 18].
(1)
(DR)CP= −1.42 + 70.212ρs+ 5.324(0.01) N
N0
⁄ + 0.0074 ( V
bwd√fc
)
−0.818
+ 0.00142fyk+ 0.822(L H⁄ ) − 0.077fc
(2)
(DR)LS= 0.75(DR)CP
(3)
(DR)IO= −0.30 + 0.001fyk+ 0.16(L H⁄ )
Story num
Column num
Story height(m)
Span (m)
f’c (Mpa)
Fy (Mpa)
Total height(m)
ρl
(%) T (s)
C (ABI/R)
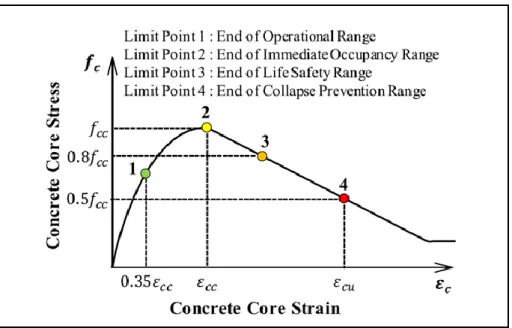
In order to fulfillment of initial proposal, designed frames have been analyzed floor to floor with OpenSees. Given that the intended analysis in this study was nonlinear static or pushover analysis, determination of materials nonlinear characteristics was very important. Therefore, material nonlinear specifications have been chosen according to reliable research, such as Yavari et al. [15], Haselton et al. [7] and OpenSees manual [16]. Moreover, pushover analysis OpenSees code validated using the results of test nember 5 of Tanaka and Park (1990) research. Validation result is illustrated in Figure 1. Analysis shows that in all specimens, concrete core strain was controlling value not rebar strain. Therefore, based on Hoshikuma [17] and Sharifi et al. [11] research results, concrete core strain threshold values were determined corresponding to the four performance levels including operational, immediate occupancy, life safety and collapse prevention. Figure 2 illustrates these strain threshold values.
Figure 1. OpenSees code validation (Tanaka and Park test #5 (1990)).
Figure 2. Concrete core strain at performance levels, Sharifi et al. (2012).
Life-safety performance level (end of life-safety range) where concrete core stress is reduced by 20% from peak confined concrete stress of fcc to 0.8fcc.
Collapse prevention level (end of collapse prevention range) where concrete core stress is reduced from peak fcc by
50% to 0.5fcc, as a lower bound for core crushing.
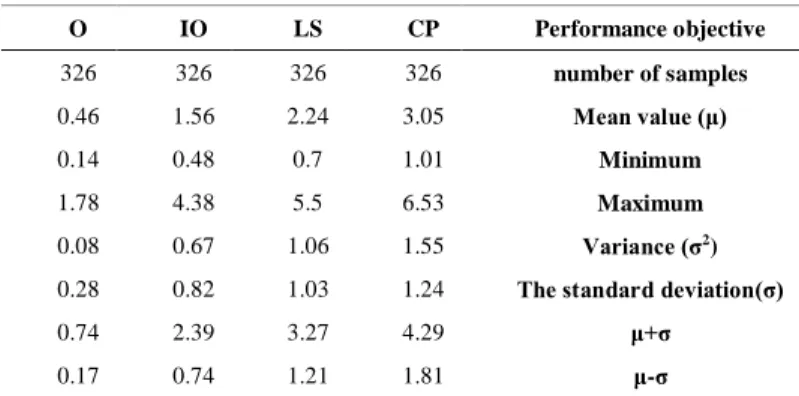
Structural performance level and its corresponding inter-story drift has been recorded by reaching the first member to strain boundary of the higher performance level for all specimens. Thus, it is obvious that if other criteria such as reaching all story members to strain limits had been assumed, results would vary. Table 3 shows descriptive statistics of the recorded specimens’ results for inter-story drifts at performance objectives.
Table 3. Descriptive statistics of specimens’ inter-story drift.
O IO LS CP Performance objective
326 326 326 326 number of samples
0.46 1.56 2.24 3.05 Mean value (μ) 0.14 0.48 0.7 1.01 Minimum
1.78 4.38 5.5 6.53 Maximum
0.08 0.67 1.06 1.55 Variance (σ2)
0.28 0.82 1.03 1.24 The standard deviation(σ)
0.74 2.39 3.27 4.29 μ+σ 0.17 0.74 1.21 1.81 μ-σ
3-
Data Analysis
In order to achieve a clear understanding of the data, correlation of independent and dependent variables have been investigated separately and together. High linear correlation between dependent variables at performance levels O, IO, LS and CP were seen. So, multiple regression has been done to predict inter-story drift at CP level and the other performance levels’ drifts would be a function of CP level’s drift.
Independent variables should be orthogonal to be used simultaneously in a regression model. In other words, their low linear dependency is preferable in case of finding precise relationship without collinearity. Figure 3 shows linear and nonlinear trend between dependent and independent variables. Where dependent variable is drift at collapse prevention performance level and independent variables are p/Agfc (axial load ratio), fyeq (modified yield stress of
reinforcement steel) [11], Ke (story equivalent stiffness), H/D (story height-column section dimension ratio), V/bd√fc
(story shear ratio), ρl (longitudinal reinforcement ratio), Ib/4Ic (beam-column moment of inertia ratio), S/H (beam
span-story height ratio), fc (concrete compressive strength) and ρs (transverse reinforcement ratio). Because of regulation
limits of producing specimens which mentioned in the methodology section, distribution of some independent variables is dispersed. So it explains low linear dependency between parameters such as ρs or fc and drift capacity at CP
performance level.
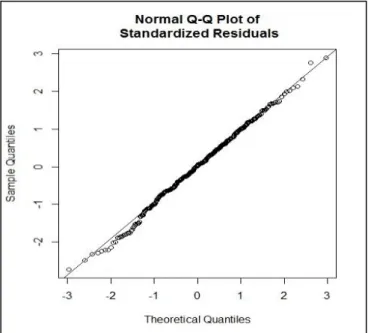
According to the result of an extensive data survey to predict the dependent variables via independent variables, a quite number of multiple regression models tested using R [18]. Coefficients of independent variables predicted using least square method. Based on data, equation 4 is the best to predict CP’s inter-story drift capacity. Although usage of coefficient of determination (R2) is not right in nonlinear regression, because of its frequency in technical literature, R2
value for equation 4 is 0.94. Figures 4 and 5 illustrate Q-Q plot and frequency of residual values of equation 4 respectively.
Where:
fc: concrete compressive strength
p: column axial load Ag: column section area
H: story height D: column dimension
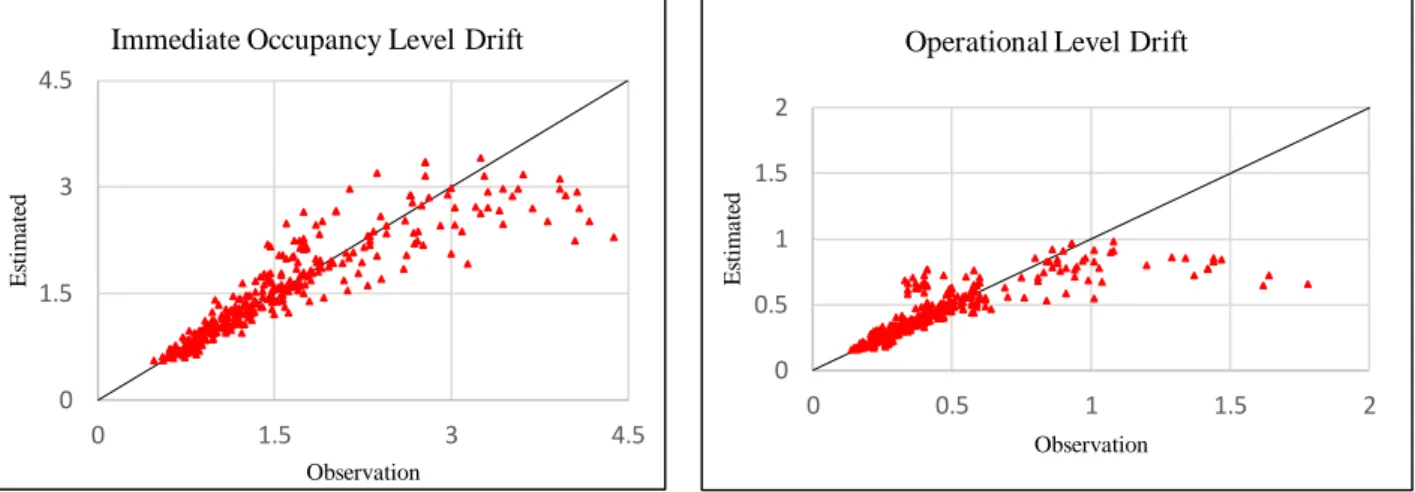
Using equation 4, CP drift capacity values have been calculated. Correlation of these values with documented drift for other performance levels have been presented as equations 5 to 7. R2 of these equations are respectively 0.93, 0.89 and
0.80. Figure 6 shows estimated values and statistical samples’ observed values.
(4)
𝑙𝑛(𝐷𝑟𝑖𝑓𝑡𝐶𝑃) = 0.191 − 0.025 𝑓𝑐 + 1.870 𝑒
−3.514𝐴𝑔𝑓𝑐𝑝
+ 0.075 𝐻/𝐷
𝑙𝑛(𝐷𝑟𝑖𝑓𝑡𝐶𝑃) = 0.191 − 0.025 𝑓𝑐 + 1.870 𝑒
−3.514𝐴𝑔𝑓𝑐𝑝
(5)
DriftLS = 0.6785 (DriftCP)1.0655
(6)
DriftIO = 0.4309 (DriftCP)1.1367
(7)
DriftO= 0.1219 (DriftCP)1.1464
0 2 4 6
0.00 0.10 0.20 0.30 0.40 0.50
CP D ri ft Avg p/Agfc 0 2 4 6
110 130 150 170
CP D ri ft fyeq(MPa) 0 2 4 6
0.005 0.015 0.025 0.035 0.045
CP
D
ri
ft
Avg V/bd√fc
0 2 4 6
0.E+00 2.E+05 4.E+05 6.E+05 8.E+05
CP D ri ft Ke (kg/cm) 0 2 4 6
0.010 0.020 0.030
CP D ri ft ρl 0 2 4 6
3.50 5.50 7.50
CP D ri ft H/D 0 2 4 6
0.0045 0.0065 0.0085 0.0105
CP D ri ft ρs 0 2 4 6
0.00 0.20 0.40 0.60 0.80
CP
D
ri
ft
Ib/4Ic
0 2 4 6
20 25 30
CP D ri ft fc(MPa) 0 2 4 6
1.0 1.5 2.0 2.5 3.0 3.5
CP
D
ri
ft
S/H
Figure4. Q-Q plot of equation 4.
Figure 5. Residuals frequency of equation 4.
0 1 2 3 4 5 6 7
0 1 2 3 4 5 6 7
E
st
im
a
te
d
Observation
Collapse Prevention Level Drift
0 1 2 3 4 5 6
0 1 2 3 4 5 6
E
st
im
a
te
d
Observation
Figure 6. Estimated and statistical samples’ observed values.
4-
Conclusions
In this study, the correlation between inter-story drift and structural performance objectives of RC intermediate moment frame has been studied extensively. Proposed equations are capable to predict inter-story drift at performance levels with a bit of story information precisely. The results of this study regarding decisions such as the selection of Hoshikuma [17] model for concrete confinement, setting higher performance level at entrance point of first element to the strain limits and recording strain values at the outermost fibers of concrete core are quite conservative. Therefore, these equations can be used in the post-earthquake assessment of code designed intermediate RC moment frame to evaluate level of safety and damage. Prediction of ultimate inter-story drift can be used to propose a drift based damage index. Thus, inter-story drift damage index (IDDI) is suggested as equation 8. Considering equation 6, dividing present drift by CP drift as the ultimate probable value results IDDI. Practical usage of this damage index needs further research. Hence, comparing IDDI with common damage indices such as Park-Ang, target displacement of regulations such as ASCE41-13 [5] and other similar studies seem necessary and useful.
(8)
IDDI = DriftP
DriftU
Where:
Driftp: Present drift of the story based on observation or assumption
DriftU: Ultimate drift of the story based on equation 6.
5-
References
[1]Federal Emergency Management Agency, NEHRP Guidelines for the Seismic Retrofit of Buildings, FEMA 273, 1997. [2]Federal Emergency Management Agency, Prestandard and Commentary for the Seismic Rehabilitation of Buildings
(FEMA-356), 2000.
[3]American Society of Civil Engineers, Seismic Rehabilitation of Existing Buildings (ASCE41-06), 2006.
[4]American Society of Civil Engineers, Seismic Evaluation and Retrofit of Existing Buildings (ASCE41-13), 2013.
[5]Erduran, Emrah, and Ahmet Yakut. “Drift Based Damage Functions for Reinforced Concrete Columns.” Computers & Structures 82, no. 2–3 (January 2004): 121–130. doi:10.1016/j.compstruc.2003.10.003.
[6]Ghobarah A, On Drift limits associated with different damage levels, Performance-based seismic design concepts and implementation, PEER 2004/2005.
[7]Haselton C, Deierlein G, Assessing Seismic Collapse Safety of Modern-Reinforced Concrete Moment-Frame Buildings, PEER Report 2007/08.
[8]Bebamzadeh A, Ventura C.E., Pandey B.H, Liam Finn W.D., Taylor G, Design Drift Limits for Performance-based Seismic Assessment and Retrofit Design of School Buildings in British Columbia, Canada. 2012.
[9]Habibi, A.R., and M. Izadpanah. “New Method for the Design of Reinforced Concrete Moment Resisting Frames with Damage Control.” Scientia Iranica 19, no. 2 (April 2012): 234–241. doi:10.1016/j.scient.2012.02.007.
[10]Yakut A, Solmaz T, Performance based Displacement Limits for Reinforced Columns under Flexure. 15 WCEE, LISBOA 2012. [11]Sharifi, Ashkan, Mahmoud-Reza Banan, and Mohammad-Reza Banan. “A Strain-Consistent Approach for Determination of
0 0.5 1 1.5 2
0 0.5 1 1.5 2
E
st
im
a
te
d
Observation
Operational Level Drift
0 1.5 3 4.5
0 1.5 3 4.5
E
st
im
a
te
d
Observation
[13]Iranian national building regulations, ninth issue, reinforced concrete buildings design and construction, 1392. [14]Iranian national building regulations, sixth issue, loads on buildings, 1392.
[15]Yavari S., Shaking table tests on the response of reinforced concrete frames with Non-Seismic Detailing. Ph.D. Thesis, Vancouver, Canada, University of British Columbia, 2011.
[16]Pacific Earthquake Engineering Research Center PEER, OpenSees manual, 2009.
[17]Hoshikuma, Jun-ichi, Kazuhiko Kawashima, and Kazuhiro Nagaya. “A Stress-Strain Model for Reinforced Concrete Columns Confined by Lateral Reinforcement.” Doboku Gakkai Ronbunshu no. 520 (1995): 1–11. doi:10.2208/jscej.1995.520_1. [18]R Core Team. R: A language and environment for statistical computing. R Foundation for Statistical Computing, Vienna, Austria.
![Table 1. Strain values corresponding performance levels [11].](https://thumb-us.123doks.com/thumbv2/123dok_us/7935292.2109638/2.893.148.742.452.593/table-strain-values-corresponding-performance-levels.webp)