Italian Journal of Science & Engineering
Vol. 1, No. 2, August, 2017
Neuro-Simulation Tool for Enhanced Oil Recovery Screening
and Reservoir Performance Prediction
Soheil Bahrekazemi
a*, Mahnaz Hekmatzadeh
ba Petroleum Engineering Department, Science and Research Branch, Islamic Azad University, Tehran, Iran b IOR Research Institute, Tehran, Iran
Abstract
Assessment of the suitable enhanced oil recovery method in an oilfield is one of the decisions which are made prior to the natural drive production mechanism. In some cases, having in-depth knowledge about reservoir’s rock, fluid properties, and equipment is needed as well as economic evaluation. Both putting such data into simulation and its related consequent processes are generally very time consuming and costly. In order to reduce study cases, an appropriate tool is required for primary screening prior to any operations being performed, to which leads reduction of time in design of ether pilot section or production under field condition. In this research, two different and useful screening tools are presented through a graphical user interface. The output of just over 900 simulations and verified screening criteria tables were employed to design the mentioned tools. Moreover, by means of gathered data and development of artificial neural networks, two dissimilar screening tools for proper assessment of suitable enhanced oil recovery method were finally introduced. The first tool is about the screening of enhanced oil recovery process based on published tables/charts and the second one which is Neuro-Simulation tool, concerns economical evaluation of miscible and immiscible injection of carbon dioxide, nitrogen and natural gas into the reservoir. Both of designed tools are provided in the form of a graphical user interface by which the user, can perceive suitable method through plot of oil recovery graph during 20 years of production, costs of gas injection per produced barrel, cumulative oil production, and finally, design the most efficient scenario.
Keywords:
Neuro-Simulation; Enhanced Oil Recovery; Neural Network; Reservoir Simulation; Screening Tool; Gas Flooding.
Article History:
Received: 27 June 2017
Accepted: 06 September 2017
Notation
cP Centipoise
PV Pore Volume
API The American Petroleum Institute gravity
Kv Vertical Permeability
Kh Horizontal Permeability
bbl Barrel
Scf Standard cubic foot
Stb Standard barrel
Avg. Average
Kh The product of formation permeability, k, producing formation thickness, h
CO2 Carbon Dioxide
N2 Nitrogen
ft. Foot
F Fahrenheit
psi Pounds per square inch
md MilliDarcy
*CONTACT: Soheil.pe@gmail.com
1-
Introduction
Enhanced oil recovery is the process of recovering oil by injection of fluids which are not normally present in the reservoir. Oil recovery can be categorized into three phases: primary, secondary and tertiary. Displacement of oil by its natural drive mechanisms such as solution gas drive, gravity drainage, gas cap drive and water influx which are the first stages in oil production is called primary recovery. Applying techniques, namely gas or water injection with the view to maintaining reservoir pressure refers to secondary recovery. Tertiary recovery is any technique applied after secondary recovery. In general, tertiary recovery is classified into three main categories: “thermal processes” consisting injection of thermal energy, or in-situ combustion of reservoir which results in reduction of viscosity, “chemical processes” including injection of surfactants or alkaline agents that have considerable influence on reduction of interfacial tension and solvent methods including injection of a displacing fluid that facilitate macroscopic displacement. EOR is not restricted to a particular phase (primary, secondary or tertiary). Nearly all EOR processes have been field tested as secondary displacement, yet much interest has been focused on tertiary EOR. EOR is an interested topic because of amount of oil to which it is potentially applicable. The EOR target oil is the amount unrecoverable by conventional means. Conventional recovery consists of primary and secondary recovery. In fact, EOR is one of the technologies to maintain petroleum (crude and condensate) recoverable from known reservoirs under existing economic and technology which are referred as oil reserves [1]. Thus, assessment of most suitable enhanced oil recovery method is one of the decisions which are made prior to natural drive production mechanism.
Reservoir engineers should have in-depth knowledge about reservoir characteristics to conduct reservoir simulation, laboratory tests and pilot tests in order to implement a plan of designed scenario into real reservoir under control. Different screening criteria and screening tables are suggested in verified papers so that reservoir engineer is able to use these criteria in order to reduce number of case studies. There are some major issues in utilizing of these tables such as overlap between suggested criteria. This problem leads to have difficulty for an engineer assessing the most suitable EOR process and in addition, there are no economic evaluation for implementation of methods. Therefore, an appropriate tool is required for primary screening the suitable recovery method as well as economic evaluation of different candidate scenarios prior to any operations being performed. In this research, two different screening tools are presented through a graphical user interface. Both screening tools are designed based on development of artificial neural network architecture. The first screening tool is based on updated criteria proposed by Al Adasani and Bai [2], so efficient networks developed for classification of EOR methods via miscible and immiscible injection of carbon dioxide, nitrogen and hydrocarbon, while the other, Neuro-Simulation technique used for prediction of reservoir performance and economic evaluation for injection of CO2, N2 and natural gas into the reservoir. Neuro-simulation is a hybrid synergistic technique that couples soft-computing and hard-computing techniques [3]. In part of hard-computing, reservoir models were built and run using CMG simulation software. In part of soft computing, different neural networks were developed by MATLAB® software.
1-1-MATLAB®
MATLAB is a software package developed by the Math Work Inc. founded by Jack Little and Cleve Moler in 1984. MATLAB® was designed to perform mathematical calculations, software programming, data visualization and data
mining. since MATLAB® provides considerable library of ready-to-use routines for plethora of applications, the user is
able to solve technical programming problems much faster than traditional programming languages such as C, C++ and FORTRAN [4].
The process of design and development of neural network(s) is performed by MATLAB® software. In addition,
MATLAB® GUIDE employed in development of graphical user interface. by utilizing GUIDE interface in MATLAB®,
one can create graphical user interface in a convenient way for engineering purposes [5].
1-2-CMG®
CMG is commercial software which is widely used for numerical simulation of reservoir models. This software consists of three main simulator: GEM, which is Equation-of-state* reservoir simulator for compositional reservoir modeling, IMEX which is three-phase black-oil simulator and STARS for modeling of steam, solvents, air and chemical additives simulation [6].
In this research, diverse reservoir models were built and simulated with GEM.
1-3-Miscible and Immiscible Displacement
Limitation of oil recovery can be overcome by employing miscible displacement process in which the displacing material is miscible with the displaced fluid at the existing condition at the displacing-fluid/displaced-fluid interface. Thus, IFT is eliminated. If the two fluids do not mix to form a single phase, the process is called immiscible [7].
1-4- Artificial Neural Networks
an artificial neural network is an information processing system that has certain performance characteristic in common with biological neural networks that have been developed as generalizations of mathematical models of human cognition or neural biology [8].
1-5-Screening Tools
According to Samuel Armacanqui and Hassan [9], screening tools are made up of three categories: EOR screening tables and matrices, databases of companies, and artificial neural network based systems.
In case of ANN based tools Surguchev and Li [10] proposed an artificial neural network model for assessment and screening of IOR*/EOR processes, such as water and gas shut off methods, based on applicable ranges for dominant reservoir parameters in mentioned processes. By means of Back Propagation† and Scaled Conjugate Gradient‡ algorithms the proposed model was capable of assessing the efficiency of EOR/IOR processes even in defective and noisy reservoir parameters. Alvarado, Ranson et al. [11] proposed a model by means of space reduction method in data mining for total number of 290 cases including miscible and immiscible drive. By employing machine learning algorithms, they established criteria for adequate selection of EOR approaches. One of recently used methods is neuro-simulation which is widely used in petroleum applications and can be used as screening tool.
Some recent studies in neuro-simulation include Ayala, Ertekin et al. [12] that carried out parametric studies for simplified gas-condensate reservoir with specification of bottom hole pressure in identification of most influential reservoir characteristics in the establishment of optimum exploitation of gas-condensate reservoirs and eventually put forward a powerful screening and optimization tool for forecasting depletion performance of mentioned reservoirs, Olufemi, Ertekin et al. [13] developed CO2 performance predictor tool capable of predicting values of the performance indicators of the CO2 sequestration process for a wide range of coal-seams and various production schemes which enabled to be used as a screening tool with ability of ascertaining feasibility of various coalbed reservoirs for the sequestration of CO2 as well as optimum production scheme. Gorucu, Ertekin et al. [14] Applied a compositional coalbed methane reservoir simulator to generate training data sets employed in training of artificial neural networks and finally introduced a screening tool for scenarios of operational condition in the optimization of coal sequestration projects without intensive numerical simulation. One of the most valuable research studies that has been carried out in discipline of neuro-simulation is the toolbox capable of proposing oil production scenario and estimation of oil production curve provided by Parada and Ertekin [3] for screening IOR methods such as water flooding, steam injection and miscible injection of CO2 and N2.
Some other research studies based on artificial intelligence are as follows: Al-Dousari and Garrouch [15] put forward an artificial neural network model consisting input data of 18 dimensionless groups that dominate the displacement efficiency of surfactant polymer flood. The aforementioned model was able to predict oil recovery factor within roughly 3% average absolute error. Siena, M., et al. [16] developed and tested new screening method for identifying most suitable EOR approach by means of gathered database from chemical, thermal and gas/WAG§ injection projects, applying Principle Component Analysis(PCA) algorithm for data mining and to assess analogy between data and targets, employed Bayesian clustering algorithm. Eghbali, S., et al. [17] employed expert fuzzy logic system to screen four noted EOR methods including miscible CO2 and HC gas injection, polymer flooding and steam injection, then developed a screening program capable of evaluating suitable EOR techniques and finally, drew distinction between output results of mentioned system and Bayesian Belief Network(BBN) model. Le Van, S. and B. H. Chon [18] generated ANN models for oil recovery, net CO2 storage and cumulative CO2 production, by simulation and collecting total number of 233 numerical samples in training networks and established optimal injection design for various technical and economic reservoir conditions.
The difference between current study and previous research studies is in employing two different screening tools, considering vast domain for reservoir characteristics and initial conditions. Therefore, it is fully comprehensive to assess suitable enhanced oil recovery method. In addition, design of graphical user interface would conveniently assist computer user with observation of the results by entering required data without any programming knowledge.
This paper is organized as follows. Firstly, after introduction, section 2 describes the methodology in development of neural networks and reservoir simulation models, including description in development of neural networks for neuro-simulation. Then section 3 describes the results and discussion for the networks and designed tool box. Finally, section 4 present our conclusion.
* Improved Oil Recovery † BP
‡ SCG
2-
Methodology
The methodology includes two main processes: firstly, development of neural network(s) for classification purpose and secondly development of neural networks (soft computing) by means of gathered simulation data (hard computing).
2-1-Development of Neural Networks for Classical Screening Tool
In order to develop neural network(s) for the first screening tool which is based on classical methods of screening, suitable screening criteria and tables were needed. Established criteria of Al Adasani and Bai [2] selected as the updated table after Taber, J. J., et al [19] screening tables. Screening criteria for miscible and immiscible injection of CO2, N2 and hydrocarbon considered for generating sufficient data in training neural networks. Table 1 shows selected table and range of the dominant parameters for miscible injection of CO2 and hydrocarbon (full table is accessible in the original paper). Sufficient data with uniform distribution generated based on mentioned paper. Classification of methods considered as the output parameters in training phase. Table 2 shows input and output parameters for training artificial neural network(s) in development of screening tool which is based on classification of mentioned EOR methods.
Table 1. Selected table for miscible injection of CO2 and hydrocarbon
EOR Method Gravity(API) Viscosity (cP) Porosity (%) Oil Saturation (%PV) Permeability
(md) Depth(ft.)
Temperature (F) Hydrocarbon 23-57 Avg. 38.3 0.04-18000 Avg. 286.1 4.25-45 Avg. 14.5 30-98 Avg. 71 0.1-5000 Avg. 726.2 4000-15900 Avg. 8343.6 85-329 Avg. 202.2 CO2 22-45 Avg. 37 0-35 Avg. 2.08 3-37 Avg. 15.15 15-89 Avg. 46 1.5-4500 Avg. 209.73 1500-13365 Avg. 6230.17 82-257 Avg. 138.1
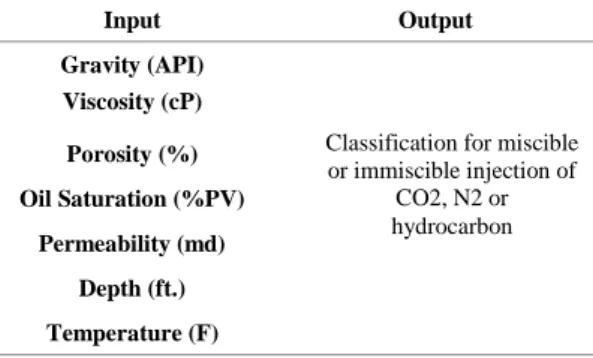
Table 2. Input and output parameters for training artificial neural network(s) in development of screening tool
Input Output Gravity (API)
Viscosity (cP) Porosity (%) Oil Saturation (%PV)
Permeability (md) Depth (ft.) Temperature (F)
In case of classification of methods, suitable networks were developed, including three hidden layers made up of 60, 20 and 3 neurons in each layer respectively. Amount of data considered for training accounted for 70% and 15% for validation and testing. Figure 1 shows a schematic of designed network, its layers and transfer functions.
Figure 1. Schematic for neural network(s) in screening tool
2-2-Neuro-Simulation
The general strategy used in this section is simulation of CO2, N2 and natural gas injection into the different reservoir models and so generating sufficient data with the aim of training neural networks.
With the view to generating sufficient data, diverse reservoir models were built with CMG® simulation software.
2-3-Simulation Models
2-3-1-Reservoir Model
The base model is 1085ft*1085 ft. with 31i*31j*3k gridding and 5 spot injection pattern (4 production wells and 1 injection well). Figure 2 shows the reservoir model for average porosity of 25%
Classification for miscible or immiscible injection of
Figure 2. Base model of the reservoir with average porosity of 25%
2-3-2-Rock Properties
In order to build heterogeneous reservoir, each grid would have a specific property of porosity and permeability. Heterogeneous reservoir models were built with two different distributions: normal distribution for porosity and triangular distribution for permeability. Average properties of porosity and permeability were used for the phase of training.
2-3-3-Fluid Properties
Some parameters for screening including oil gravity, viscosity and oil composition is suggested [19]. In this research two dissimilar oil compositions were used which is shown on table 3.
Table 3. Oil compositions used in simulation
Low Shrinkage Oil High Shrinkage Oil
Oil Composition
3.2 0.91
CO2
0.03 0.16
N2
27.81 36.47
C1
18.21 9.67
C2
5.99 6.95
C3
0.31 1.44
iC4
4.1 3.93
nC4
1.3 1.44
iC5
7.3 1.41
nC5
9.62 4.33
C6
22.13 32.29
C7+
0.782 0.8515
S.G C7+
210 205
M.W C7+
2-3-4-Initial Condition
Table 4. Initial conditions used for simulation Models
Low Shrinkage Oil High Shrinkage Oil
Initial conditions
2000-3500 2500-3500
Reservoir Pressure range (psi)
0.1 0.1
Kv/Kh ratio
7900 7900
Depth (Ft.)
2-3-5-Relative Permeability Curves
In this research, the relative permeability curves are generated by CMG software considering end point saturations data and Brooks, R. H. and A. T. Corey [20] correlations. In table 5 end point saturation for the one case that is used in generating relative permeability curves is shown.
Table 5. End point saturations used in CMG for generation of relative permeability curves
# Description Value
1 SWCON - Endpoint Saturation: Connate Water 0.2
2 SWCRIT - Endpoint Saturation: Critical Water 0.2
3 SOIRW - Endpoint Saturation: Irreducible Oil for Water-Oil Table 0.4
4 SORW - Endpoint Saturation: Residual Oil for Water-Oil Table 0.4
5 SOIRG - Endpoint Saturation: Irreducible Oil for Gas-Liquid Table 0.2
6 SORG - Endpoint Saturation: Residual Oil for Gas-Liquid Table 0.2
7 SGCON - Endpoint Saturation: Connate Gas 0.05
8 SGCRIT - Endpoint Saturation: Critical Gas 0.05
9 KROCW - Kro at Connate Water 0.8
10 KRWIRO - Krw at Irreducible Oil 0.3
11 KRGCL - Krg at Connate Liquid 0.3
12 Exponent for calculating Krw from KRWIRO 3
13 Exponent for calculating Krow from KROCW 3
14 Exponent for calculating Krog from KROGCG 3
15 Exponent for calculating Krg from KRGCL 3
For sensitivity analysis of relative permeability curves, diverse reservoir models with different end point saturations of connate water and residual oil were considered. Table 6 shows the range of mentioned saturations.
Table 6. Range of endpoint saturations used in generation of relative permeability curves
Maximum Minimum
End Point Saturation
0.4 0.1
Residual Oil Saturation
0.03 0.05
Connate Water Saturation
2-3-6-Operational and Abandonment Conditions
Table 7. Operational condition
Description Value
Bottom hole pressure (psi) 800
Range of maximum production rate (bbl/day) 500-3100
Amount of injection 15%-25% of total pore volume
Table 8. Abandonment condition
Description Value Minimum production rate(bbl/day) 50
Maximum gas oil ratio(scf/stb) 2000
2-4-Development of Neural Network for Neuro-Simulation Tool
In this section, distinctive neural networks developed for prediction of recovery factor based on miscible or immiscible injection of N2, CO2 and natural gas. In addition, economic evaluation of different approaches can be analyzed by prediction of cumulative oil production and cumulative gas injection. Sufficient data for training neural networks acquired from simulation of different reservoir models. Finally, exceeding 900 simulation models were run and analyzed for collecting training data. Table 9 shows input and output parameters for designing neural networks.
Table 9. Inputs and outputs for designing neural networks in Neuro-Simulation
Input Output
Porosity Oil Recovery During 20 Years of Production
Permeability (md) Cumulative Oil Production by CO2 Injection For 20 Years of Production
Maximum Production Rate (bbl/day) Cumulative CO2 injection For 20 Years of Production
Injection Pressure (psi) Cumulative Oil Production by N2 Injection For 20 Years of Production
Net thickness (ft.) Cumulative N2 injection For 20 Years of Production
kh Cumulative Oil Production by Natural Gas Injection For 20 Years of Production
Residual Oil Saturation
Connate Water Saturation
In case of gas injection, suitable network designed for each gas, including three hidden layers consist of 20, 10 and 3 neurons in each layer respectively. Training function that was used in this section was “trainbr” which is built-in MATLAB function for training neural network based on Levenberg-Marquardt optimization. Transfer functions of each layer and percentage of test, train and validation of each network according to oil composition, can be seen in table 10 and 11. Fig. 3 shows a schematic of designed network, hidden layers and transfer functions.
Table 10. Transfer function used for design of Neuro-Simulation Tool
Fluid Type Transfer Function for 1
st
Hidden Layer
Transfer Function for 2nd
Hidden Layer
Transfer Function for 3rd
Hidden Layer
Transfer Function for Output Layer
Low Shrinkage Oil tansig logsig logsig purelin
High Shrinkage Oil tansig tansig logsig purelin
Table 11. Percentage of Data Used in Train, Test and Validation
Fluid Type Percentage of Train Data Percentage of Test Data Percentage of Validation Data
Low Shrinkage Oil 85 10 5
High Shrinkage Oil 80 10 10
Figure 3. Schematic for neural network(s) in Neuro-Simulation Part
2-5-Toolbox Design
In order to design toolbox, MATLAB GUIDE which is a development environment tool, was used. Two separate panel, named “Neuro-Simulation Tool” and “Screening Tool” considered. These two panels designed so that the required input data to simulate trained network would be entered by the user in a convenient way via the interface. In addition, for economic evaluation of each method, the price of each gas should be entered by the user, so that amount of cumulative gas injection is utilized in economic evaluation of each approach
3-
Result and Discussion
This section is structured around two categories. First, for panel of classical screening tool. Second, for Neuro-Simulation panel.
Firstly, intended to have apt neural networks for the purpose of classification in miscible and immiscible gas injection (CO2, N2 and natural gas) methods, specific neural network developed. Figure 4 shows confusion matrix for miscible injection.
Figure 4. Confusion matrix for classification of miscible Injection
Secondly, in case of Neuro-Simulation tool, over 900 simulation models designed and ran with the aim of generating sufficient data in training of neural networks.
Figure 5. Predicted results from network versus target Data for CO2 Injection
Finally, after designing required networks, graphical user interface designed with MATLAB GUIDE, which is shown on Figure 6.
Figure 6. Main window of graphical user interface
As outlined earlier, the toolbox contains two main panel. Firstly, the classical screening tool which is based on verified paper of Al Adasani and Bai [2]. Secondly, Neuro-Simulation panel.
Neuro-simulation tool consists of three main sections: “Input Data”, “Recovery Plots” and “Result data”. In input section, user is able to choose the oil type. By clicking on “information” button, user would get some useful information such as: two phase envelope, oil gravity, Solution gas oil ratio and also minimum miscibility pressure for different gases. Figure 7 shows information about low shrinkage oil after clicking on “information” button.
Figure 7. Main window of "information" button for low shrinkage oil
Initial conditions of the reservoir should be entered in “Initial Condition” panel. End point saturation (residual oil and water) should be entered in “Saturation” panel as well.
For economic evaluation of methods, price of each gas should be entered by user in specific units which is dollar per ton* for CO2 and N2, and dollar per one thousand cubic feet† for natural gas.
Finally, by entering required data and clicking on “Plot Results”, plot of recovery versus time for 20 years and other results such as total cost per barrel and cumulative oil production, based on injected gases will be shown. Fig 7 shows that recovery factors for CO2 injection, N2 and natural gas are 29, 18 and 7 percent respectively. In addition, by considering oil type and injection Pressure, the gas injection process would be miscible for CO2 and immiscible in case of N2 and natural gas. Total cost for each produced barrel, helps user design the most efficient EOR scenario after careful consideration of facilities and accessible equipment.
4-
Conclusion
By employing neural networks, a graphical user interface including two panel of screening tools designed so that the first panel named “Screening Tool” based on successful EOR projects and second panel named “Neuro-Simulation Tool” based on over 900 simulation models.
A multilayer neural network for classification of enhanced oil recovery methods designed and used as a screening toolbox
Panel of “Screening Tool” is able to suggest proper enhanced oil recovery method, including immiscible or miscible injection of hydrocarbon, CO2 and N2 gases based on successful projects until 2011
A total number of six artificial neural networks were developed in order to forecast recovery factor during 20 years, cumulative oil production as well as cumulative gas injection with the aim of designing panel of “Neuro-Simulation Tool”
Panel of “Neuro-Simulation Tool” can be used for simulation of two black oil compositions, economic evaluation of each method, forecasting cumulative injection of gases and cumulative oil production.
Designed toolbox can be used as a fast tool for economic evaluation of enhanced oil recovery method and
simulation of miscible and immiscible injection of gases based on injection pressure.
Designed toolbox will reduce time and cost of simulation projects.
5-
References
[1] Lake, Larry W. "Enhanced oil recovery." (1989): 17-39.
[2] Al Adasani, Ahmad, and Baojun Bai. "Analysis of EOR projects and updated screening criteria." Journal of Petroleum Science and Engineering 79, no. 1 (2011): 10-24.
[3] Parada, Claudia Helena, and Turgay Ertekin. "A new screening tool for improved oil recovery methods using artificial neural networks." In SPE Western Regional Meeting. Society of Petroleum Engineers, 2012.
[4] Trauth, Martin H., Robin Gebbers, Norbert Marwan, and Elisabeth Sillmann. MATLAB recipes for earth sciences. Vol. 34. Berlin: Springer, 2007.
[5] Moore, Holly. MATLAB for Engineers. Pearson Prentice Hall, 2007.
[6] Manual, C. M. G. "Computer Modeling Group." Component Adsorption and Blockage in Appendix D 7 (2008). [7] Green, D. W., and G. P. Willhite. "Enhanced oil Recovery, vol. 6." SPE Textbook Series, TX, USA (1998).
[8] Fausett, Laurene, and Laurene Fausett. Fundamentals of neural networks: architectures, algorithms, and applications. No. 006.3. Prentice-Hall, 1994.
[9] Samuel Armacanqui, J., and Ahmed Mohamed Hassan. "The Use of an Operational Filter Boosted Artificial Neural Network for Selection of Enhanced Oil Recovery Technique." In SPE North Africa Technical Conference and Exhibition. Society of Petroleum Engineers, 2015.
[10] Surguchev, Leonid, and Lun Li. "IOR evaluation and applicability screening using artificial neural networks." In SPE/DOE Improved Oil Recovery Symposium. Society of Petroleum Engineers, 2000.
[11] Alvarado, Vladimir, Aaron Ranson, Karen Hernandez, Eduardo Manrique, Justo Matheus, Tamara Liscano, and Natasha Prosperi. "Selection of EOR/IOR opportunities based on machine learning." In European Petroleum Conference. Society of Petroleum Engineers, 2002.
[12] Ayala, Luis F., Turgay Ertekin, and Michael Adewumi. "Optimized Exploitation of Gas-Condensate Reservoirs Using Neuro-Simulation." In SPE Asia Pacific Oil and Gas Conference and Exhibition. Society of Petroleum Engineers, 2004.
[13] Olufemi, Odusote, Turgay Ertekin, Duane H. Smith, Grant Bromhal, W. Neal Sams, and Sinisha Jikich. "Carbon Dioxide Sequestration in Coal Seams: A Parametric Study and Development of a Practical Prediction/Screening Tool Using Neuro-Simulation." In SPE Annual Technical Conference and Exhibition. Society of Petroleum Engineers, 2004.
[14] Gorucu, Fatma Burcu, Turgay Ertekin, Grant S. Bromhal, Duane H. Smith, W. Neal Sams, and Sinisha A. Jikich. "A Neurosimulation Tool for Predicting Performance in Enhanced Coalbed Methane and CO2, Sequestration Projects." In SPE Annual Technical Conference and Exhibition. Society of Petroleum Engineers, 2005.
[15] Al-Dousari, Mabkhout M., and Ali A. Garrouch. "An artificial neural network model for predicting the recovery performance of surfactant polymer floods." Journal of Petroleum Science and Engineering 109 (2013): 51-62.
[16] Siena, Martina, Alberto Guadagnini, Ernesto Della Rossa, Andrea Lamberti, Franco Masserano, and Marco Rotondi. "A new Bayesian approach for analogs evaluation in advanced EOR screening." In EUROPEC 2015. Society of Petroleum Engineers, 2015. [17] Eghbali, Sara, Shahab Ayatollahi, and Ramin Bozorgmehry Boozarjomehry. "New expert system for enhanced oil recovery screening in non-fractured oil reservoirs." Fuzzy Sets and Systems 293 (2016): 80-94.
[18] Le Van, Si, and Bo Hyun Chon. "Evaluating the critical performances of a CO2–Enhanced oil recovery process using artificial neural network models." Journal of Petroleum Science and Engineering 157 (2017): 207-222.
[19] Taber, Joseph John, F. D. Martin, and R. S. Seright. "EOR screening criteria revisited-Part 1: Introduction to screening criteria and enhanced recovery field projects." SPE Reservoir Engineering 12, no. 03 (1997): 189-198.
[20] Brooks, Royal Harvard, and Arthur Thomas Corey. "Hydraulic properties of porous media and their relation to drainage design." Transactions of the ASAE 7, no. 1 (1964): 26-0028.
[21] Minakowski, Claudia Helena Parada. An artificial neural network based tool-box for screening and designing improved oil recovery methods. The Pennsylvania State University, 2008.