TECHNICAL UNIVERSITY OF CLUJ-NAPOCA
ACTA TECHNICA NAPOCENSIS
Series: Applied Mathematics, Mechanics, and Engineering Vol. 60, Issue III, September 2017
CONSIDERATIONS ON THE OUTDOOR NOISE BARRIERS
DESIGN AND SIMULATION
Iulian LUPEA
Abstract: The article is primarily a review of the design principles and the main factors with impact in the effectiveness of noise barriers followed by considerations on the outdoor sound field simulation with sound barriers. The sound absorption spectrum characterization is the specificity of the employed sound barriers in the simulation. A new sound spectrum associated to the new class of sound absorbing structures with double micro-perforated panels is observed and added in SoundPlan simulation library.
Keywords: noise barrier, insertion loss, transmission loss, sound absorption spectrum, barrier simulation, double micro-perforated panels.
1. INTRODUCTION
The growing concern of the public and governments on the environmental noise pollution and the health effects, generates continuous interest and pressure on the noise barriers simulation and research. Sound barriers provide reduction or attenuation of the sound generated by the road and highways traffic noise, railways, airways, retail, construction
sites, mechanical & HVAC equipment or other industrial noise sources in order to fulfill local and state requirements. A noise source can be often linear like the traffic road or the railway,
volume source, area source or point source. Homes, apartments, schools, hospitals, office buildings or public parks and so on, are potential receivers. The barrier is inserted between the source and the receiver with the function to block the sound rays traveling to the receiver and hence to protect them. Sound rays bend when passing over the apex of the barrier because of the wave diffraction (Fig.1). Diffracted sound depends on the source frequency. High frequencies can be stopped easier while low frequencies turn more downward around the barrier apex because of the diffraction. Therefore sound barriers are most effective at mid and high-frequencies.
Sound barriers are made of various materials like brick and masonry, concrete, steel, plastics, wood, composites or earth (berm) and should be sufficiently dense to efficient diminish sound waves from traveling through them. Reflective barriers are low cost like those made of concrete or bricks. Absorptive barriers are more expensive being reflective and as well absorptive on one side or both sides [5], [7].
When a noise barrier is tall up to the line of sight from the road to the receiver, the reduction in sound level is of about 5 dB(A). For each one meter of barrier height increase, a 1.5dB additional noise reduction level is obtained. The barrier should be located as close as possible to either the source or the receiver in order to have maximum efficiency.
The barrier effectiveness is evaluated by the insertion loss, defined as:
(
)
2 0 10 /log
10 P P
IL= (1)
where P0 is the initial effective (rms) pressure at the receiver without the barrier and P is the sound pressure (rms value) at the receiver (same location) after the barrier insertion. The sound waves follow two paths, one is the diffracted path and the second (a small part) is transmitted through the barrier material.
Two important noise related quantities of a barrier material are: 1. the ability to absorb acoustic energy (α) valid for porous and lightweight materials and 2. the ability to reflect sound energy (STL) valid for dense and nonporous materials of minimum density of 15-20 kg/m2. Both abilities are not findable in a
unique material, therefore is common to see an absorbing layer on the source side placed in parallel and contact with a barrier structure. Common values for insertion loss are between 5 to 12 dB. In practice a noise reduction of 5dbA is easy to be obtained, 10dBA is often obtained, 15dBA is very difficult to reach and a reduction of 20dBA is almost impossible.
In terms of the shape we can distinguish flat barriers, non-flat barriers and barriers with caps.
2. SOUND BARRIER MODELING
For a known sound source power (LW), the
sound pressure (LP) at the receiver is calculated
as follows [10]:
9 . 10 ) ( log 10
) (
log 20
1 10
10
− + −
+ −
+ =
−
τ
b w
p
a
AR SA DI
L L
(2)
where DI =10log10(Q) is the directivity index of the source, Q is the directivity factor of the source (Q=2 for a point source on a plane); ab is
the barrier coefficient, τ is the sound power
transmission coefficient of the barrier wall. For a point sound source:
7 . 12 )
2 /( ) 2 (
tanh2 2 <
= N N forN
ab
π
π
7 . 12 004
.
0 ≥
= forN
ab (3)
where N is the Fresnel number:
λ δ / 2
=
N (4)
and λ is the sound wave length, δ is the difference between the diffracted path length (SAR) and the direct path length (SR).
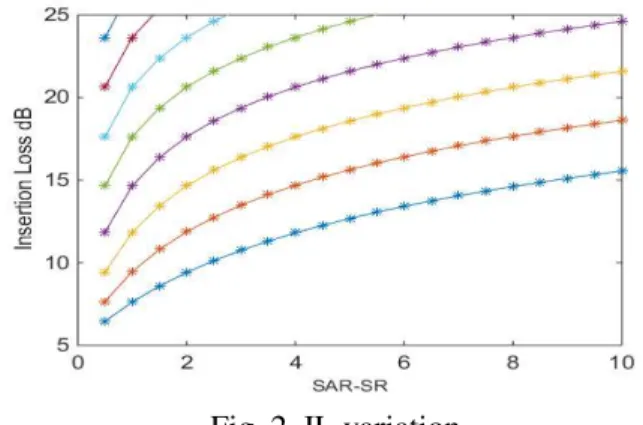
Later a formula of the insertion loss applicable for a point source (or a vehicle passing in front of the barrier) and for a sound opaque barrier material, is found [7]:
)] 2 tanh( / 2 [ log 20
5dB 10 N N
IL= +
π
π
(5)for 0.2 < N < 12.5, and tanh is the hyperbolic tangent. For N>12.5, IL=24dB (Fig.2).
A simplified and empirical formulae of the insertion loss has been developed based on Maekawa’s formula for a point source:
] [ ) 20 3 ( log
10 10 N dB
IL= + (6)
and a similar one for a linear source: ] [ ) 5 . 5 2 ( log
10 10 N dB
IL= + (7)
Sound energy because of the atmospheric absorption is gradually converted into heat and depends on air temperature and relative humidity (RH). The atmosphere attenuation coefficient (dB/100m) is rapidly increasing with the sound frequency (Table 1,@20̊ C) [19]:
Table 1
RH% 125 250 500 1000 2000 4000 20 0.07 0.15 0.27 0.62 1.9 6.7 90 0.02 0.08 0.26 0.56 0.99 2.1
Ground absorption, wind and meteorological effects have to be present in the model.
2.1. Reflection and transmission at the boundary of two elastic medium
When the absorption at the separation plane (x=0) is neglected, a boundary condition at the separation plane states that the total pressure of one medium considering the incident and the reflected waves equals the wave pressure in the second medium represented by the transmitted wave. For normal incidence one have:
) , 0 ( ) , 0 ( ) , 0
( t p t p t
pi + r = t (8)
The velocity continuity of the air vibration particles at the separation plane, states:
) , 0 ( ) , 0 ( ) , 0
( t v t v t
vi + r = t (9) The two conditions make sure that both media remain in contact. The wave frequency is constant. From the reflection factor R definition (ratio of the incident and reflected amplitudes) and some data manipulations, yields:
1 1 2 2 1 1 2 2 c c c c P P R i r ρ ρ ρ ρ + − =
= (10)
where
ρ
1c1 =Z1 andρ
2c2 =Z2 are the characteristic impedances of the two elastic media or materials, ρis the density and c is the sound speed. The transmission factorT is:1 1 2 2 2 2 2 c c c P P T i t ρ ρ ρ + =
= (11)
In terms of energy conservation Wi, Wr and
Wt are the incident, reflected and the transmitted sound powers:
t r
i W W
W = + (12)
The fraction of incident energy which is reflected is called the reflection coefficientβ:
2 2 1 1 2 2 1 1 2 2 2 2 R c c c c P P i r = + − = =
ρ
ρ
ρ
ρ
β
(13)An important parameter in selecting the barrier material for controlling sound transmission is the sound power transmission coefficient τ. It is defined as the ratio of the transmitted acoustic power (or energy) and the incident acoustic power (or energy) [2]:
2 2 1 2 1 1 1 2 2 2 2 ) ( 4 / / Z Z Z Z c P c P i t + = =
ρ
ρ
τ
(14)For materials with equal characteristic impedances (Z1=Z2), τ=1 and for very
dissimilar impedances the transmission
coefficient is small. From energy conservation results:
β+τ=1 (15)
Replacing the reflection and transmission coefficients and observing their expressions the following relation is obtained:
1
2 2
=
+T
R (16)
The barrier material and the air should be very dissimilar in terms of characteristic impedances in order the barrier to be effective and to reflect the most of sound energy.
In case the absorption/dissipation is missing one have the surface absorption coefficient:
2 1 1 R W W W W W W W i r i r i i
t = − = − = −
=
α
(17)In case Z2 is the barrier material and Z1
stands for the air, results:
2 0 2 0 2 1 c Z c Z
ρ
ρ
α
+ − − = (18)2.2. The noise barrier - three adjacent media
An outdoor barrier has two separation planes: air-barrier and barrier-air transitions. The global transmission coefficient τ (transmitted wave in the second air layer vs. incident wave energy) is function of the dissimilarity at the two separation planes and the barrier thickness l [1], [2], [4] :
) ( ) 3 / 2 2 / 1 ( ) 3 / 1 1 ( / 4 2 2 2 2 3 1 l k tg Z Z Z Z Z Z Z Z + + + = τ (19)
For outdoor barriers Z1=Z3 and Z1/Z2 can be neglected because Z2/Z1 is very large. Between 100Hz and 3150Hz, we approximate:
1 ) /
cos(ωl c2 ≈ and sin(ωl/c2)≈ωl/c2,
ρ2l=m (specific mass), resulting the transmission coefficient [2]:
1 2 1 1 ) 2 ( 1 − + = c m ρ ω
τ (20)
Sound Transmission Loss (TL) sometimes referred to as the sound reduction index (SRI or Ri) as a function of frequency, (ISO 16283, ISO 140) expressed in dB (see Table 2):
) ( log 10 ) / 1 ( log
10 10 10
t i
W W TL
Ri= = τ = (21)
or
1 1 10
2 log 20
c m Ri
ρ ω
= (22)
Table 2[19] Barrier
Material
Thickness mm
Density kg/m2
TL dB Dense concrete 100 244 40 Light concrete 100 161 36 Bricks 150 288 40 Alu sheet 3.18 8.8 25 Polycarbonate 8-12 10-14 30-33
At a particular frequency SRI (dB) is observing the so called mass law (or mass controlled frequency band situated between the stiffness controlled and damping regions):
SRI(f) = 20 log10(f·m) – 47dB (23) where f is the frequency of interest and m is the mass of the barrier per meter square. SRI is increasing by 20·log(2)=6dB for each doubling of the mass m for a given frequency (in practice a 5dB increase is more realistic) or for a double frequency when the mass is constant.
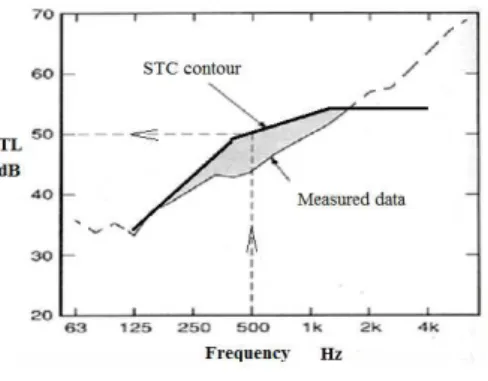
The weighted sound reduction index, Rw (similar to Sound Transmission Class, STC) is
a unique number [dB] rating the SRI following ISO 717-1, in which a standard reference curve is fitted to the laboratory measured sound reduction index curve, measured between 100 Hz and 3150 Hz in 1/3 octave bands. STC number is the ordinate at 500Hz (Fig.3).
For a better indication Rw is enriched by
using Rw(C; Ctr), where C (dB) is a correction
for sources with small content in low frequencies (high speed traffic) and Ctr(dB) is a
correction number for sources reached in low frequencies (urban traffic noise, disco music, low speed trains) [20]. C and Ctr are in general negative hence indicating a reduced performance for that type of sound source.
In general the sound energy of the source transmitted through the barrier should be much less than the energy of the source passing over the top or around the sides of the barrier and reaching the receiver. The barrier is designed so that the sound transmitted directly (SR) through the barrier is negligible comparing the energy following the diffracted path. For this purpose is recommended [2].
τ< ab/8 (24)
In case the noise level (Lp) avoiding the
barrier is 10dB larger or more than the noise level transmitted through the barrier (Lp-10),
the noise level obtained at the receiver by
summing like two (independent and
simultaneous acting) sources, is: ) 10
10 log(
10 0.1 + 0.1( −10)
= Lp Lp
ptot
L
or:
41 . 0 )
1 . 1 log(
10 = +
+
= p p
ptot L L
L (25)
Hence, the noise level generated by the sound energy transmitted through the barrier is increasing the noise level at the receiver by 0.41dB,
being negligible. In case the source is 75dB and
at the
receiver we
need 55dB the barrier IL has to be of 20dB in terms of the diffraction effect. Results that the barrier material has to offer a TL of 30dB because the transmitted source will be 75-30=44dB and adding 45dB to 55dB results a little more (0.41dB) than 55dB (Fig. 4).
2.3. The noise barrier with absorptive layer
The reflective barrier built of one dense material has two separation surfaces encountered by the sound wave, while in case an absorbing layer is attached the sound wave
Fig. 4. IL numerical values
encounter three separation planes with reflections and transmitted waves.
Walls that are made of absorptive material have defined the surface absorption coefficient which is the ratio of the acoustic energy absorbed by the surface and the acoustic energy incident or striking the surface:
i
abs W
W /
=
α
(26)The energy absorbed at the surface Wabs is composed by the transmitted energy through the material and the dissipated energy within the material and is dependent on the frequency.
From ISO
11654, 2005 we
observe a
measured (practical) coefficient αpi
for each octave frequency band
(125Hz to
4kHz) and a
unique αw coefficient indicating the absorption
at 500 Hz for a reference curve superposed on the measured αp graph. Based on αw value,
materials are categorized in classes A(most absorptive), ... , E. Each αpi is derived by
averaging three αSi values, where αSi is the
value on the ith third octave band measured on
reverberation room (ISO 354, 2004).
2.4. Roadside traffic noise barriers
An appropriate method of evaluating the performances of the road traffic noise reducing devices (barriers) by using a one digit value is to compare the Noise Insulating Index (DLr) and the Noise Absorption Index (DLα) following the testing procedure described in EN 1793: 1793-1 observes the laboratory sound absorption, 1793-2 and 1793-6 observe the laboratory and in-situ respectively barrier airborne sound insulation (transmission),
1793-4 observes the barrier diffraction in-situ test, 1793-5 in-situ test for sound absorption and barrier reflection. 1793-3 presents the normalized traffic noise spectrum.
The one digit nominal value of sound absorption index functional efficiency (in laboratory), DLα, dB (EN 1793-1) is:
0,1 1
0,1 1
10 10 log 1
10 i i
i n
L S i
n L
i DLα
α
=
=
= − −
∑
∑
, n=18 (27)where: αSi are sound absorption coefficients for each 1/3 octave wide frequency band in the frequency range from 100 Hz to 5 kHz (central frequencies fi ). Li is the normalized A-weighted
sound pressure level of traffic noise in the i-th one-third octave band [dB], as defined in EN 1793-3 (frequency range 100 Hz to 5 kHz). The normalized traffic noise spectrum comes from the average of road traffic noise spectra taken in Europe.
The traffic noise is reaching the sound barrier plane without any reflections from additional surfaces and the effects of sound diffraction on the barrier edges are not considered.
Table 3 Category DLα [dB]
A0 undetermined
A1 <4
A2 4…7
A3 8…11
A4 12...15
A5 >15
The single number rating of airborne sound insulation power (in laboratory) giving an overall indication of the performance, is the reduction index DLR (EN 1793-2):
( 0 ,1 0 ,1 )
1 0,1 1
10 10 log 1
10 Li Ri
i n
i
R n
L
i DL
−
=
=
= − −
∑
∑
, n=18. (28)Following the reduction index value (rounded to the nearest integer) one have categories/classes as follows.
For category B0: DLR[dB] is not determined;
for B1: DLR[dB]<15; for B2: DLR[dB] is
between 15 and 24; for B3: DLR[dB] is between
25 and 34; and for B4: DLR[dB] >34.
In 2012 the A5 class (EN 1793-1) has been added and the B4 class (EN 1793-2) as well.
For the same kind of barrier, a general tendency for the laboratory results to be lower than the outdoors is observed [6]. The measurement conditions in the laboratory
(scattered field in classical reverberation test chamber) and in situ (outdoor direct incident field)are not fully comparable. In situ testing of the barriers is using a pseudo-random MLS signal.
3. BARRIER SIMULATION WITH SOUNDPLAN
Commercial software for outdoor sound simulation like SoundPlan from Braunstein, CadnaA developed by Datakustik, LimA developed by Stapelfeldt Ingenieure, Odeon and many others are offered nowadays.
3.1 From pressure spectrum to power spectrum of the sound source
When the dimension of the source is small compared with the distance to the listener a point type sound source is considered. The elevations of the outdoor area of interest has been imported from Google Earth by using the Cartography module of SoundPlan. For a correct ground attenuation the ground types (grass, concrete) have to be specified in the model.
The equivalent sound pressure spectrum Lpeq [dB] (1/3 octave bands) is measured by using a calibrated
first class sound
level meter.
Proper integration time has been used in order to have a realistic description of the
point sound
source.
Based on the sound pressure spectrum constant on a hemisphere and the measuring distance r, the sound power spectrum of the sound source is derived. One can chose a feature of SoundPlan for this calculation by specifying the source position relative to ground plane in the relation below:
) 4 log(
10 2
r Q L
Lw p
π
+
= (29)
for Q=2, results:
) 2 log( 20 2
1 log
10 2 L r
r L
Lw = p + = p+ − π ⋅
π
or: LW = Lp + [20 × log10 (r)] + 8 dB (30)
The resulted source power spectrum is depicted in figure 7.
The total sound source power Lw is related to the sound energy generated and radiated in time [W=J/s] all around by the sound source through sound waves when is acting at the source spot. The sound pressure is the effect of the source at the measuring spots, in the region of interest, where the receivers are placed.
The directivity of the source is important to be found and described in SoundPlan. To complete the source
description the day histogram is to be known in order to evaluate the Lday, Levening and Lnight. These are the A weighted long term averaged sound level from ISO 1996-1, 2003, measured or simulated over the
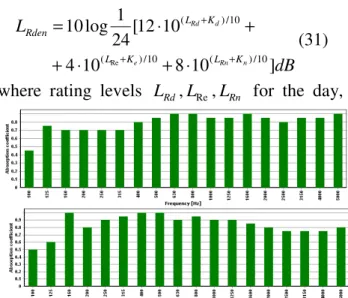
whole day, evening and night respectively. The associated time periods are 12 hours (from 7am to 7pm), four and eight hours for the day, evening and night levels. As well, the day-evening-night rating level LRden is calculated:
dB L
n Rn e
d Rd
K L K
L
K L Rden
] 10
8 10
4
10 12 [ 24
1 log 10
10 / ) ( 10
/ ) (
10 / ) (
Re+ +
+
⋅ + ⋅
+
+ ⋅
=
(31)
where rating levels LRd,LRe,LRn for the day,
Fig. 7. Source Power spectrum
Fig. 6. Ground elevation
evening, night and associated adjustments Kd, Ke, Kn have been added, if applicable.
A window like the one depicted in figure 8 is concluding the source description.
In two ways the reflection properties of the barrier can be specified: a. reflection loss as a single value and b.spectral calculations of reflection losses from the absorption coefficients specified in SoundPlan Library. In the first simplified version one can enter o single value for the entire spectrum:
the reflection loss [dB],
the absorption
coefficient or the reflection coefficient. If one parameter is entered the other two are
resulting accordingly. The second version has been used by choosing commercial barrier type Durisol [18] with a DLα=8dB, Transmission loss Rw > 30 dB and the spectrum of absorption coefficients depicted in figure 9a. In a similar manner one can chose a Forster noise protection wall Kassete Type C12 characterized by DLα= 8dB, Transmission loss Rw = 30 dB (resulted from measurement) and the absorption spectrum given in figure 9b (below).
In order to modify the diffraction (ISO
1793-6), additional elements (caps) can be added on top of the barrier like in Figure 10.
3.2 Design by using micro-perforated panels
New absorption spectra entry have been added in the project library, associated to double micro-perforated panels (MPPs) which are efficient sound absorbing structures. The absorption coefficients are known from the impedance tube measurements [9], [11] and are depicted in figure 12. These structures are
composed by two MPPs facing the sound source and backed by a rigid wall. Between the two panels and between the panels and the rigid wall one have air layers with prescribed thicknesses. The perforations diameter, relative distances and the panel thickness are well established in order to maximize the sound absorption in the frequency ranges of interest [9], [11]. When two panels are present, like in our case, two peaks of sound absorption can be observed (Fig. 12) for the entire structure.
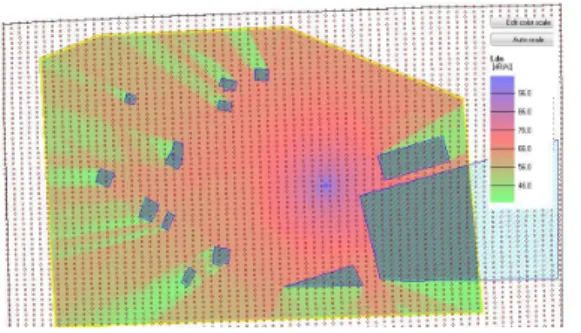
A first run is giving the outdoor sound field pressure without barriers (Fig.11).
Two separate barriers are to be placed in order to protect the receivers. One barrier is
very efficient placed. It is located close to the sound source and is intending to protect a first
group of
receivers. The second barrier is located close to the second receivers group and placed at mid distance to the third group of receivers.
Hence, the
second barrier is well placed in terms of the
second receiver group and is less efficient for the last group of receivers. The barriers
Fig. 10. Additional elements
Fig. 12. MPP absorption coeff. vs frequency
Fig. 11. Sound pressure field w/o barriers
Fig. 13. Two sound barriers
placement is according to the available space. The height of each barrier is varied and is observed the resulted overall sound pressure field and the pressure to each receiver. The barriers are sound absorbing one side only, the one facing (oriented) the sound source.
The equivalent day sound pressure level field with the barriers inserted at the mentioned locations is shown in figure 14. The sound pressure level is dropping after the barriers and after the buildings.
4. CONCLUSIONS
The basic principles of reflective and absorptive sound barrier design and proper barrier materials are presented. For the outdoor sound field simulation with absorbing barriers the source sound spectrum, the source histogram and the barrier absorption spectrum are considered. A new double micro-perforated panel absorbing structure is attached to one side of the reflective barrier and used efficiently in the outdoor sound field simulation. The simulation is performed with SoundPlan and the SoundPlan project library is enriched with the new absorption spectrum.
5. REFERENCES
[1] Bădărău, E., Grumăzescu, M., Bazele acusticii moderne, Ed. Acad. RPR, 1961. [2] Barron R., Industrial Noise Control and
Acoustics, 2003
[3] Bell,L., Industrial Noise Control, 1994 [4] Bratu, P., Acustică Interioară pentru
constructii de maşini, Editura Impuls, 2002. [5] Clairbois,J-P., Garai, M., Noise barriers
and standards for mitigating noise, CEDR Conf., Hamburg, Sept. 2015
[6] Garai,M., Guidorzi,P., European
methodology for testing the airborne sound insulation characteristics of noise barriers in situ: experimental., 2000.
[7] Kotzen, B., English, C., Environmental Noise Barriers - A guide to their acoustic and visual design, Spon Press, 2009.
[8] Kurze, U.J, Anderson, G.S., ‘Sound attenuation by barriers’, App.Ac., 4, 1971. [9] Lupea, I., Stremţan, Florina-Anca,
Considerations on the acoustic panel absorber, ATN, AMM, Vol.56, Issue II, 2013 [10] Maekawa, Z. 1968. Noise reduction by
screens. Appl. Acoust. 1: 157–173.
[11] Stremtan, Florina-Anca, Garai, M., Lupea, I., Micro-perforated panels and sound
absorption, Acta Technica Napocensis, Series: AMM, Issue. III, Vol. 55, 2012. [12] Tatge, R., Barrier wall atenuation with a
finite sized source, Journal of Acoustical Soc. of America, vol.53, p1317, 1973.
[13] ** https://www.fhwa. dot. gov/ Environment/ noise/ noise_barriers/ [14] ** SoundPlan, User's Manual, 2015 [15] **http://on-air.no/oa_uploads/4_-_
[16] **ISO 9613 /1,/2 - 2008 ISO 9613-2:1996, Acoustics - Attenuation of sound.
[17]** EN 1793-1:2012, Road traffic noise reducing devices. Test method for determining the acoustic performance.
[18] **www.leier.eu
[19] **www.epd.gov.hk/epd/sites/default/fil es/epd/english/environmentinhk/noise/guide_ ref/files/barrier_leaflet.pdf
[20] **http://ro.saint-gobain-glass.com/trade- customers/ sticla -si- izolatia-fonica.
Consideraţii cu privire la modelarea şi simularea barierelor acustice de exterior
Rezumat: Articolul este in primul rând o trecere in revistă a principiilor de proiectare a barierelor de zgomot la exterior şi observarea eficienţei lor. Sunt tratate aspecte legate de simularea acestor bariere cu SoundPlan cu accente pe spectrul de absorbţie al câtorva bariere comerciale şi în special spectrul nou al barierelor prevăzute cu panouri duble microperforate.
Iulian LUPEA, Professor Ph.D.,Technical University of Cluj-Napoca, Department of Mechanical Systems Engineering, 103-105 Muncii Blvd., 400641 Cluj-Napoca, +40-264-401691, e-mail: