International Journal of Education
in Mathematics, Science and
Technology (IJEMST)
www.ijemst.com
Transfer of Learning in Mathematics,
Science, and Reading among Students in
Turkey: A Study Using 2009 PISA Data
Mack Shelley1 , Atila Yildirim2 1Iowa State University
2Necmettin Erbakan University
To cite this article:
Shelley, M. & Yildirim, A. (2013). Transfer of learning in mathematics, science, and reading
among students in Turkey: A study using 2009 PISA data.
International Journal of
Education in Mathematics, Science and Technology, 1
(2), 83-95
This article may be used for research, teaching, and private study purposes.
Any substantial or systematic reproduction, redistribution, reselling, loan, sub-licensing,
systematic supply, or distribution in any form to anyone is expressly forbidden.
Authors alone are responsible for the contents of their articles. The journal owns the
copyright of the articles.
Volume 1, Number 2, April 2013, 83-95
ISSN: 2147-611X
Transfer of Learning in Mathematics, Science, and Reading among
Students in Turkey: A Study Using 2009 PISA Data
Mack Shelley1*, Atila Yildirim2 1
Iowa State University 2Necmettin Erbakan University
Abstract
Using Program for International Student Achievement (PISA) 2009 data we study the transfer of knowledge among reading, mathematics, and science among Turkish students. Both Science and Reading are significant predictors of Mathematics scores, although clearly Science is a much stronger predictor; the transfer from Science to Mathematics is much greater than is the transfer from Reading to Mathematics. SCHOOLID is the single strongest predictor of Mathematics outcomes, likely reflecting the importance of socioeconomic and regional or urban/rural differences in the quality of education available to students. Both Mathematics and Reading are significant predictors of Science scores, although Mathematics is a stronger predictor; the transfer from Mathematics to Science is greater than is the transfer from Reading to Science. SCHOOLID is a weaker predictor of Science outcomes than are Mathematics scores, suggesting that the importance of socioeconomic and regional or urban/rural differences in the quality of education available to students may have slightly less consequence for Science outcomes than does the transfer effect from Mathematics to Science. Both Science and Mathematics are significant predictors of Reading scores, but the transfer from Science to Reading is much more robust than the transfer from Mathematics to Reading. SCHOOLID and Science are nearly identically strong predictors of Reading outcomes, suggesting that the importance of socioeconomic and regional or urban/rural differences in the quality of education available is on a par with the Science transfer to Reading. Implications of these findings are discussed.
Keywords: Transfer of learning, Turkey, PISA
Introduction
This article reports results from a study of mechanisms of transfer of learning (e.g., Haskell, 2011; Cormier & Hagman, 1987; Thorndike & Woodworth, 1901; Thorndike, 1923) across mathematics, science, and reading for 15-year-old Turkish high school students participating in the 2009 PISA study. Interest in the transfer of learning has been heightened by concerns among the makers of education policy in many countries to provide more efficient, more effective, and longer-lasting gains in content knowledge in key areas of learning (Glewwe, 2002; Hanushek & Kimko, 2000). Our focus here in on the process of knowledge transfer as a mechanism to develop the skills required for economic, social, and cultural development. These skills are measured in a county that is classified by the International Monetary Fund (IMF, 2011) as a largely developed newly industrialized country. Turkey has the world's 15th largest gross domestic product (GDP) in terms of purchasing power parity (World Bank, 2012) and 17th largest nominal GDP (World Bank, 2011).
The transfer of learning from one academic subject area to another, or beyond the classroom, is not a novel area of research, but is evolving toward more sophisticated means of analysis. Leberman, McDonald, and Doyle (2006) address the need to understand how what is learned in the classroom can be adapted and used in the workplace. Mestre (2005) explicates the complex and sometimes confusing perspectives on this topic by distinguishing among different types of transfer: near and far, vertical and lateral, specific and nonspecific, literal and figural. Other studies (e.g., Intergovernmental Studies Program, 2005) address the modalities by which knowledge carries over in classroom learning and in training activities. Dixon and Brown (2012) have addressed the crucial role in the transfer of learning that is played by the process of connecting concepts during problem solving. They emphasize that the high school experience needs to provide sufficient authentic
*
solving and project-based activities to prepare students to deal with the types of problems they will need to solve in the real world.
Of more direct relevance to the purposes of our study is the recent research by Khishfe (2012) on the use of an explicit reflective approach to provide more effective transfer of nature of science (NOS) understandings into similar contexts. The purpose of the study was to investigate the effectiveness of explicit NOS instruction in the context of socially controversial scientific issues and explore whether it is possible to transfer acquired NOS understandings taught explicitly in one context into other similar familiar and unfamiliar contexts. The results showed no improvement in NOS understandings of participants in the non-NOS group in relation to the familiar and unfamiliar contexts. In contrast, there was general improvement in the NOS understandings of participants in the NOS group in relation to both the familiar and unfamiliar contexts.
Perkins and Salomon (1992) define transfer of learning as what happens when learning in one context enhances (positive transfer) or undermines (negative transfer) a related performance in another context, as when learning mathematics prepares students to study physics. Transfer includes near transfer (to closely related contexts and performances) and far transfer (to rather different contexts and performances). Reflexive, or low road, transfer involves the triggering of well-practiced routines by stimulus conditions similar to those in the learning context. Mindful, or high road, transfer involves deliberate abstraction and a search for connections. Most formal education aspires to transfer, either across subject areas or from the classroom into other aspects of a student’s life and/or into subsequent employment. Consequently, the ends of education are not achieved unless transfer occurs. As distinguished from ordinary learning, transfer has not occurred when a student solves problems at the end of the chapter (which would be an example of ordinary learning) but is unable to solve similar problems when they occur mixed with others at the end of the course or when related applications of the relevant concepts cannot be applied successfully in another course or in other disciplines.
Several experiments seeking to document a positive impact of learning to program on problem solving and other aspects of thinking yielded negative results (e.g., Pea & Kurland, 1984, Salomon & Perkins, 1987; Simon & Hayes, 1977). However, some research has demonstrated that positive transfer can occur (e.g., Brown, 1989; Campione et al., 1991; Clements & Gullo, 1984; Lehrer et al., 1988; Salomon et al., 1989). In general, near transfer has been found to be more likely than far transfer to succeed. Two broad instructional strategies to foster transfer can be identified: hugging and bridging (Perkins & Salomon, 1988). Hugging is based on reflexive transfer, with instruction directly engaging learners in approximations to the performances that are desired. For example, a teacher might give students trial exams rather than just talking about exam technique. The learning experience thus maximizes the likelihood of later automatic low road transfer. In contrast, bridging exploits the high road to transfer. Bridging implies instruction that encourages students to make abstractions and search for possible connections. For example, a teacher might ask students to devise an exam strategy based on their past experience, which would emphasize deliberate abstract analysis and planning.
PISA
The Program for International Student Achievement (PISA) addresses how well students can apply the knowledge and skills they have learned at school to real-life challenges. The tests are designed to assess to what extent students at the end of compulsory education can apply their knowledge to real-life situations and be equipped for full participation in society (OECD, 2012). PISA, launched by the OECD (Organization for Economic Co-operation and Development) in 1997, was designed to evaluate education systems worldwide every three years by assessing 15-year-olds’ competencies in reading, mathematics, and science. The students and their school principals also fill out background questionnaires to provide information on the students’ family background and how their schools are administered. The first PISA survey was carried out in 2000 in 43 countries, the second in 2003 in 41 countries, the third in 2006 in 57 countries, the fourth in 2009 in 74 countries, and the most recent survey was carried out in 2012 in 65 countries (OECD, 2012). Turkey, a member of the OECD, participated in the PISA exam for the first time in 2003 to identify strengths of the education system and areas in need of improvement (MONE, 2005, 2007).
As in 2000, reading literacy was the focus of the PISA 2009 survey, but the reading framework has been updated and now also includes the assessment of reading of electronic texts. The framework for assessing mathematics was fully developed for the PISA 2003 assessment and remained unchanged in 2009. Similarly, the framework for assessing science was fully developed for the PISA 2006 assessment and remained unchanged in 2009. PISA is structured to make it possible to find statistical associations between student achievement and influences from family, school, and other educational sources. Interpretation of PISA results for policy purposes must be sensitive to differences across countries and cultural contexts and must address actions taken by families, government bodies, and educational organizations to impact all levels of educational systems. The results from this study and from kindred analyses are intended to frame and facilitate decisions about education policy taken by those who occupy positions of leadership in education such as ministers and secretaries of education, those who make laws, technical staff who make operative and concrete decisions, administrators and teachers who must implement specific educational actions, as well as the implementation of mandates or guidelines that influence the behavior of students and their families.
PISA findings can be used by policymakers to gauge the knowledge and skills of students in their own country (and in comparison with those of other participating countries), establish benchmarks for education improvement compared to other countries or to enhance the capacity to foster equitable educational outcomes and opportunities, and understand the relative strengths and weaknesses of their education systems (OECD, 2007). Students are assessed at age 15 because at that age they are approaching the end of compulsory education in most OECD countries. The assessment is focused on ascertaining the extent of transfer of classroom-acquired knowledge to everyday tasks and challenges, based on a dynamic model of lifelong learning in which the new knowledge and skills that are necessary for successful adaptation to a changing world are acquired continuously throughout life.
PISA uses paper-and-pencil tests, with assessments lasting a total of two hours for each student. Test items include multiple-choice items and questions requiring students to construct their own responses, organized in groups based on written presentation establishing a real-life situation. A total of about 390 minutes of test items is covered, with different students taking different combinations of test items. Students answer a background questionnaire, which takes 30 minutes to complete, providing information about themselves and their homes. School principals are given a 20-minute questionnaire about their schools. In some countries, optional short questionnaires are administered to parents to provide further information on reading engagement at the students’ homes, and students to provide information on their access to and use of computers as well as their educational history and aspirations. Major domains have been reading in 2000, mathematics in 2003, science in 2006, reading literacy in 2009, and mathematics in 2012.
The primary aim of the PISA assessment is to determine the extent to which young people have acquired the wider knowledge and skills in reading, mathematics, and science that they will need in adult life, to assist with data-driven decision making. The application of specific school-acquired knowledge in adult life depends on the extent to which adults have acquired broader concepts and skills. In reading, the capacity to develop interpretations of written material and reflect on the content and qualities of text are central skills. In mathematics, the ability to reason quantitatively is more relevant than being able to answer familiar textbook questions for the purpose of applying mathematical skills in everyday life. In science, specific knowledge such as the names of plants and animals is less valuable than understanding broad topics such as energy consumption, biodiversity, and human health. Students also need to develop communication and information technology skills and learn to be adaptable, flexible, and oriented to solving problems.
Literacy
Appropriate uses of mathematical language, modeling, and problem-solving skills are essential for student success. A six-level performance scale is used to assess student PISA mathematics performance (Masters & Forster, 1996; Masters, Adams, & Wilson, 1999), using an item response theory-based approach
Scientific literacy is the ability to use scientific knowledge and processes to understand the natural world and participate in decisions that affect it (Koballa, Kemp, & Evans, 1997; Law, 2002). PISA’s science assessment emphasizes scientific knowledge or concepts that help with understanding life and health, Earth and the environment, and technology; describing, explaining, and predicting scientific phenomena; understanding the process of scientific investigation; interpreting scientific evidence and conclusions; and knowing how to apply scientific knowledge and processes in specific contexts. The emphasis is on a critical stance and a reflective approach to science (Millar & Osborne, 1998; Norris & Phillips, 2003) and on science education for all people (Fensham, 1985). Inevitably, scientific competencies draw upon reading and mathematical competencies (Norris & Phillips, 2003). For example, aspects of mathematical competencies are required in data interpretation contexts. Similarly, reading literacy is necessary when a student is demonstrating an understanding of scientific terminology. These synergies among reading, mathematics, and science lie at the root of this analysis. Preparation of students in reading, mathematics, and science skills is essential for economic growth and societal development.
Education and the Economy in Turkey
The Economic Policy Research Foundation of Turkey (Özenç & Arslanhan, 2010) provided an evaluation of the PISA 2009 results for Turkish students. Although Turkey achieved one of the largest improvements since 2003 in students’ scores among participating countries, Turkey’s students achieved only at OECD’s level 2, where 1 denotes the worst and 6 denotes the best performance, in all three areas of science, mathematics, and reading. The report concludes that the need remains for comprehensive reform in the Turkish education system, to establish the preconditions for Turkey to become a high-income country through improved competitiveness. Among the 40 countries that participated in both 2003 and 2009, Turkey’s rank in science and mathematics rose from 35th to 22rd place and in reading advanced from 33rd to 32nd place. Among the 65 countries evaluated in the 2009 PISA test, Turkey ranked 43rd in science and mathematics and 41st in reading proficiency. From 2003 to 2009, Turkey’s mean score in mathematics rose from 423 to 445, the mean science score increased from 434 to 454, and the reading mean score grew from 441 to 464.
The Economic Policy Research Foundation of Turkey report attributed the partial improvement in Turkey’s PISA performance on rising education expenditures, projects to enhance school enrollment for girls, free school books, reduced class size, implementation of curriculum redesign for both formal and informal education, and financial support mechanisms such as expanding elementary and secondary school scholarships to cover more students. From 2003 to 2008, schooling participation rates grew from 90% to 95% for elementary schools, and from 62% to 74% for secondary schools. The report concludes that such measures are inadequate to enhance Turkey’s relative position, and called for comprehensive curricular change and integrated education reforms. Blanchy and Şaşmaz (2011) focus on the fact that the dependency ratio (the number of children and the elderly relative to the number of working-age people) is decreasing significantly in Turkey; this condition offers an opportunity through about 2020 for the country to accelerate its socioeconomic development. Efforts to improve the quality of its education services to address this opportunity are challenged by the nation’s disappointing PISA results, with Turkey ranked 32nd among 34 OECD countries and with 40% of Turkish 15-year-old students unable to attain a basic competence level in mathematical literacy. These difficulties are compounded by a relatively high level of segregation associated with the socioeconomic background of Turkish students and their families.
disparities and the lack of adequate preschool opportunities in disadvantaging Turkish students is frustrated by the failure of Turkey to participate in the 2009 parent survey. We focus here on results from the student survey. Since its inception, many studies have analyzed and interpreted PISA results for participating OECD and non-OECD countries. Several studies also have investigated Turkey’s performance on these assessments, focused on either the mathematics or science performance of Turkish students (Alacaci & Erbas, 2010; Anil, 2009; Aypay, 2010; Demir & Kılıç, 2010; Demir, Kılıç, & Unal, 2010a, 2010b; Dincer & Uysal, 2010; EURYDICE, 2011; Grisay & Monseur, 2007; Gumus & Atalmıs, 2011; Güzel & Berberoğlu, 2005; Güzeller & Akın, 2011; Ovayolu & Kutlu, 2011; Unal & Demir, 2009; Ziya, Dogan, & Kelecioglu, 2010). In comparison to many other countries participating in PISA, particularly OECD members, Turkey is disadvantaged in cross-national comparisons on educational attainment as it has relatively large numbers of lower-socioeconomic students, a low share of the budget allocated to education and research, and lower per capita income.
Data and Analysis
Our analysis uses data from Turkish students participating in the 2009 PISA study. The overall sample size is 4,963. One student who was listed as attending a private school was deleted from the analysis; the remaining 4,962 students on whom the analysis is based therefore all represent Turkish public schools, and the policy perspectives we offer are relevant to Turkish public school students broadly. A total of 170 schools are represented. The number of students per school ranged from a minimum of 1 to a maximum of 35, with an average of 29.2 students per school. Although students were 15 years old at the time of PISA administration, they are distributed across a range of grade levels: 24 (0.5%) were in 7th grade, 113 (2.3%) were in 8th grade, 1,225 (24.7%) were in 9th grade, 3,392 (68.4%) were in 10th grade, 196 (4.0%) were in 11th grade, and 12 (0.2%) were in 12th grade. A slight majority (2,536, or 51.1%) were male; 2,426, or 48.9% were female. The data represent 751,283 weighted cases. Demographic distributions of the weighted data are very similar to what is reported here for the unweighted results. For ease of interpretation, we report results for the unweighted data. Our initial intent was to conduct a multilevel analysis of the data, with student at Level 1 and institutional characteristics at Level 2. However, the thinness of data at the school level (with sometimes only 1 student per school) made such an analysis problematic. In addition, the nature of the analysis, which is to attempt to measure the transfer across reading, mathematics, and science, controlling for a number of student-level (Level-1) characteristics, required the use of multiple regression using student-level predictor variables. Another alternative approach, structural equation modeling, is not an efficient strategy given the large number of predictor (exogenous) variables in this analysis, and is not as readily adaptable to the layered analysis we undertake here with various combinations of predictors included in alternative model specifications. To adjust for school characteristics, SCHOOLID (which identifies the school that a student attends) was added to the model as a categorical main effect following initial model estimation without the SCHOOLID model component; the discussion of model results focuses on the “full” model including SCHOOLID. The SCHOOLID main effect in the model also serves as a surrogate measure for socioeconomic and regional differences in Turkey that may precondition the likelihood of individual student success within a building.
Dependent Variables
Separate multiple regression models were estimated for each of the three dependent variables:
PVMATHMEAN—Mean of 5 plausible values in mathematics
PVSCIEMEAN—Mean of 5 plausible values in science
PVREADMEAN—Mean of 5 plausible values in reading
mental ability) can be transformed into an ordered categorical variable with possible scores of 0, 1, 2, 3, 4, 5 and 6. For purposes of our analytical approach, which is to estimate patterns of transfer across reading, mathematics, and science content areas, we use combinations of the two other plausible values to predict each outcome. That is, reading and mathematics plausible values are used to predict science plausible values, reading and science are used to predict mathematics, and science and mathematics are used to predict reading.
Independent Variables
Independent variables were selected to encompass a range of student-level predictors, in addition to the Level-2 SCHOOLID main effect addressing school-level institutional and structural differences that may affect student outcomes. Predictors also were selected with the purpose of maximizing the number of data values usable for each model, by including predictors selected from a much larger set of potential independent variables with relatively minimal amounts of missing data. The independent variables employed in our estimation equations include (with the dataset mnemonic label and a brief description for each variable):
Leel-2 (school) predictor
SCHOOLID—5-digit school ID
Level-1 (student and family) predictors
ST01Q01—grade level
ST10Q01—mother’s highest schooling attainment
ST14Q01—father’s highest schooling attainment
HISCED—highest educational level of parents
MMINS—learning time (minutes per week)-Mathematics
SMINS—learning time (minutes per week)-Science
METASUM—meta-cognition: Summarizing
UNDREM—meta-cognition: Understanding and Remembering
ATTCOMP—attitude toward computers
CSTRAT—use of control strategies
CULTPOSS—cultural possessions
DISCLIMA—disciplinary climate
ELAB—use of elaboration strategies
ENTUSE—instructional computer technology internet/entertainment use
ESCS—index of economic, social, and cultural status
HEDRES—home educational resources
HIGHCONF—self-confidence in instructional computer technology high-level tasks
HOMEPOS—home possessions
ICTHOME—instructional computer technology availability at home
JOYREAD—joy/like reading
LIBUSE—use of libraries
MEMOR—use of memorization strategies
ONLNREAD—online reading
USESCH—use of instructional computer technology at school
WEALTH—wealth
A total of 18 multiple regression models were estimated, both with and without SCHOOLID, for each of the following circumstances (with the same set of student-level predictors employed in each model):
Predicting Mathematics from Science, with and without SCHOOLID
Predicting Mathematics from Reading, with and without SCHOOLID
Predicting Science from Mathematics, with and without SCHOOLID
Predicting Science from Reading, with and without SCHOOLID
Predicting Reading from Mathematics, with and without SCHOOLID
Predicting Reading from Science, with and without SCHOOLID
Predicting Mathematics from Science and Reading, with and without SCHOOLID
Predicting Science from Mathematics and Reading, with and without SCHOOLID
The logic behind this analysis was to investigate all possible combinations of transfer among the three subject areas of Math, Science, and Reading. This process, conducted with models both including and not including the level-2 identifier of building (SCHOOLID), makes it possible to compare the effectiveness of these prediction models using student-level (Level-1) predictors adjusting for the Level-2 characteristics that make any one school different from other schools. The same set of student-level predictors was included in each model. We focus here on the results from predicting Mathematics from Science and Reading, predicting Science from Mathematics and Reading, and predicting Reading from Science and Mathematics. In all cases, we report detailed results from the models that include SCHOOLID and summarize the results of other models.
Results and Discussion
Predicting Mathematics from Science and Reading
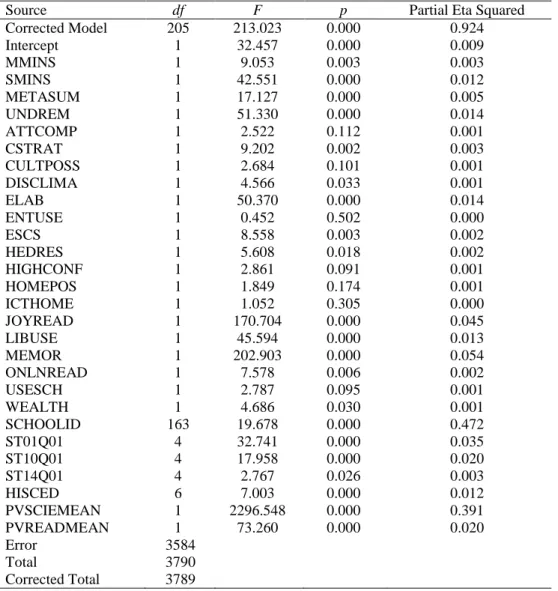
Table 1 summarizes the multiple regression model predicting Mathematics scores from Science and Reading scores, including all of the predictors listed above.
Table 1. Model results for predicting mean of 5 plausible values in mathematics from mean of 5 plausible values in science and mean of 5 plausible values in reading
Source df F p Partial Eta Squared
Corrected Model 205 213.023 0.000 0.924
Intercept 1 32.457 0.000 0.009
MMINS 1 9.053 0.003 0.003
SMINS 1 42.551 0.000 0.012
METASUM 1 17.127 0.000 0.005
UNDREM 1 51.330 0.000 0.014
ATTCOMP 1 2.522 0.112 0.001
CSTRAT 1 9.202 0.002 0.003
CULTPOSS 1 2.684 0.101 0.001
DISCLIMA 1 4.566 0.033 0.001
ELAB 1 50.370 0.000 0.014
ENTUSE 1 0.452 0.502 0.000
ESCS 1 8.558 0.003 0.002
HEDRES 1 5.608 0.018 0.002
HIGHCONF 1 2.861 0.091 0.001
HOMEPOS 1 1.849 0.174 0.001
ICTHOME 1 1.052 0.305 0.000
JOYREAD 1 170.704 0.000 0.045
LIBUSE 1 45.594 0.000 0.013
MEMOR 1 202.903 0.000 0.054
ONLNREAD 1 7.578 0.006 0.002
USESCH 1 2.787 0.095 0.001
WEALTH 1 4.686 0.030 0.001
SCHOOLID 163 19.678 0.000 0.472
ST01Q01 4 32.741 0.000 0.035
ST10Q01 4 17.958 0.000 0.020
ST14Q01 4 2.767 0.026 0.003
HISCED 6 7.003 0.000 0.012
PVSCIEMEAN 1 2296.548 0.000 0.391
PVREADMEAN 1 73.260 0.000 0.020
Error 3584
Total 3790
Corrected Total 3789
the single strongest predictor of Mathematics outcomes, likely reflecting the importance of socioeconomic and regional or urban/rural differences in the quality of education available to students. The importance of SCHOOLID is underscored by the fact that (detailed results not shown) when SCHOOLID is not included as a predictor of Mathematics R2 drops to 0.856 and adjusted R2 declines to 0.855; without SCHOOLID in the model, Science is far and away the most important predictor and Reading remains significant but far less consequential. With SCHOOLID included in the model, when Mathematics scores are predicted only by Science together with the other independent variables, R2 is 0.923 and adjusted R2 is 0.918; predicting Mathematics from Reading without SCHOOLID in the model yields weaker results, with R2 of 0.876 and adjusted R2 of 0.868. In the absence of SCHOOLID, the prediction equation for Mathematics with Science yields R2 of 0.852 and adjusted R2 of 0.850, and with Reading as the predictor R2 drops sharply to 0.774 and adjusted R2 declines to 0.772.
Predicting Science from Mathematics and Reading
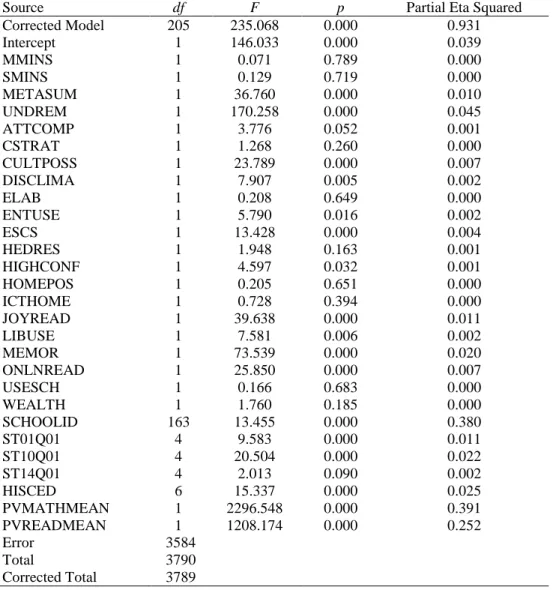
Table 2 summarizes the multiple regression model predicting Science scores from Mathematics and Reading scores, including all of the predictors listed above.
Table 2. Model results for predicting mean of 5 plausible values in science from mean of 5 plausible values in mathematics and mean of 5 plausible values in reading
Source df F p Partial Eta Squared
Corrected Model 205 235.068 0.000 0.931
Intercept 1 146.033 0.000 0.039
MMINS 1 0.071 0.789 0.000
SMINS 1 0.129 0.719 0.000
METASUM 1 36.760 0.000 0.010
UNDREM 1 170.258 0.000 0.045
ATTCOMP 1 3.776 0.052 0.001
CSTRAT 1 1.268 0.260 0.000
CULTPOSS 1 23.789 0.000 0.007
DISCLIMA 1 7.907 0.005 0.002
ELAB 1 0.208 0.649 0.000
ENTUSE 1 5.790 0.016 0.002
ESCS 1 13.428 0.000 0.004
HEDRES 1 1.948 0.163 0.001
HIGHCONF 1 4.597 0.032 0.001
HOMEPOS 1 0.205 0.651 0.000
ICTHOME 1 0.728 0.394 0.000
JOYREAD 1 39.638 0.000 0.011
LIBUSE 1 7.581 0.006 0.002
MEMOR 1 73.539 0.000 0.020
ONLNREAD 1 25.850 0.000 0.007
USESCH 1 0.166 0.683 0.000
WEALTH 1 1.760 0.185 0.000
SCHOOLID 163 13.455 0.000 0.380
ST01Q01 4 9.583 0.000 0.011
ST10Q01 4 20.504 0.000 0.022
ST14Q01 4 2.013 0.090 0.002
HISCED 6 15.337 0.000 0.025
PVMATHMEAN 1 2296.548 0.000 0.391
PVREADMEAN 1 1208.174 0.000 0.252
Error 3584
Total 3790
Corrected Total 3789
suggesting that the importance of socioeconomic and regional or urban/rural differences in the quality of education available to students may have slightly less consequence for Science outcomes than does the transfer effect from Mathematics to Science. The much less consequential role of SCHOOLID is underscored by the fact that (detailed results not shown) R2 drops just to 0.888 and adjusted R2 declines to 0.887 with SCHOOLID not included as a predictor of Science; without SCHOOLID included in the model, both Mathematics and Reading are robust predictors of Science, although transfer from Mathematics to Science is marginally more consequential than the transfer from Reading to Science. With SCHOOLID included in the model, when Science scores are predicted only by Mathematics together with the other independent variables, R2 is 0.907 and adjusted R2 is 0.902; predicting Science from Reading without SCHOOLID in the model yields somewhat weaker results, with R2 of 0.886 and adjusted R2 of 0.880. In the absence of SCHOOLID, the prediction equation for Science with Mathematics as a predictor yields R2 of .848 and adjusted R2 of 0.846, and with Reading as the predictor R2 drops somewhat to 0.825 and adjusted R2 declines to 0.823.
Predicting Reading from Science and Mathematics
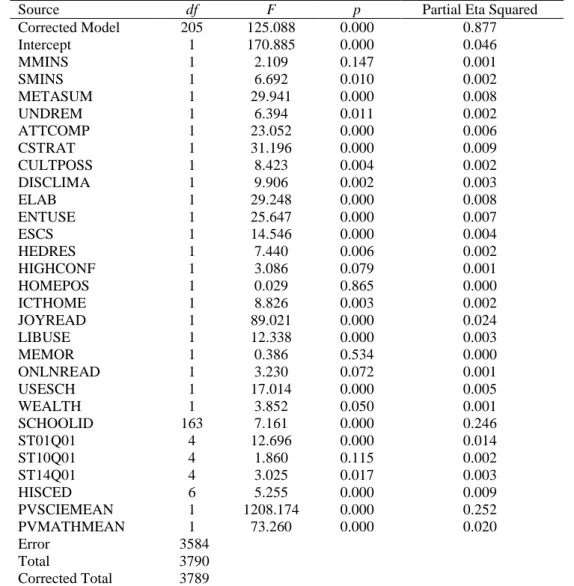
Table 3 summarizes the multiple regression model for predicting Reading scores from Science and Mathematics scores, including all of the predictors listed above.
Table 3. Model results for predicting mean of 5 plausible values in reading from mean of 5 plausible values in science and mean of 5 plausible values in mathematics
Source df F p Partial Eta Squared
Corrected Model 205 125.088 0.000 0.877
Intercept 1 170.885 0.000 0.046
MMINS 1 2.109 0.147 0.001
SMINS 1 6.692 0.010 0.002
METASUM 1 29.941 0.000 0.008
UNDREM 1 6.394 0.011 0.002
ATTCOMP 1 23.052 0.000 0.006
CSTRAT 1 31.196 0.000 0.009
CULTPOSS 1 8.423 0.004 0.002
DISCLIMA 1 9.906 0.002 0.003
ELAB 1 29.248 0.000 0.008
ENTUSE 1 25.647 0.000 0.007
ESCS 1 14.546 0.000 0.004
HEDRES 1 7.440 0.006 0.002
HIGHCONF 1 3.086 0.079 0.001
HOMEPOS 1 0.029 0.865 0.000
ICTHOME 1 8.826 0.003 0.002
JOYREAD 1 89.021 0.000 0.024
LIBUSE 1 12.338 0.000 0.003
MEMOR 1 0.386 0.534 0.000
ONLNREAD 1 3.230 0.072 0.001
USESCH 1 17.014 0.000 0.005
WEALTH 1 3.852 0.050 0.001
SCHOOLID 163 7.161 0.000 0.246
ST01Q01 4 12.696 0.000 0.014
ST10Q01 4 1.860 0.115 0.002
ST14Q01 4 3.025 0.017 0.003
HISCED 6 5.255 0.000 0.009
PVSCIEMEAN 1 1208.174 0.000 0.252
PVMATHMEAN 1 73.260 0.000 0.020
Error 3584
Total 3790
Corrected Total 3789
Measured by partial eta squared, SCHOOLID and Science are nearly identically strong predictors of Reading outcomes, suggesting that the importance of socioeconomic and regional or urban/rural differences in the quality of education available is on a par with the Science transfer to Reading. The marginal role of SCHOOLID is underscored by the fact that (detailed results not shown) R2 drops to 0.837 and adjusted R2 declines to 0.836 with SCHOOLID not included as a predictor of Reading; without SCHOOLID included in the model, Mathematics is a fairly robust predictor of Reading, and the transfer from Mathematics to Reading is trivially small. With SCHOOLID included in the model, when Reading scores are predicted only by Mathematics together with the other independent variables, R2 is 0.836 and adjusted R2 is 0.827; predicting Reading from Science with SCHOOLID included in the model results in stronger results, with R2 of 0.875 and adjusted R2 of 0.868. In the absence of SCHOOLID, the prediction equation for Reading with Mathematics yields R2 of 0.778 and adjusted R2 of 0.775, and with Science as the predictor R2 rises notably to 0.832 and adjusted R2 increases to 0.830.
Discussion
PISA data and results such as those presented in this research provide governments with a powerful tool to shape their policymaking, particularly regarding educational impacts and workforce development. Our results suggest that in the Turkish context there is convincing evidence that decisions regarding resource allocation and curriculum should take can benefit from taking into consideration the asymmetries that we have noted.
A major conclusion from our findings is that there is clear evidence of transfer from Science to Mathematics. There is reciprocal evidence of transfer from Mathematics to Science. Reading plays only a limited role in predicting either Mathematics or Science scores. Transfer from Science to Reading is much more robust than the transfer from Mathematics to Reading. This set of results emphasizes a key policy dilemma. From a policymaking and policy implementation perspective, is it better to strengthen the STEM (science, technology, engineering, and mathematics) linkages and thereby heighten the reciprocal linkages between Mathematics and Science? Or, is it better strategy to redirect resources to strengthen the thus far more limited transfer role played by Reading, thereby providing another set of stronger linkages to enhance transfer from Reading to both Mathematics and Science?
A second area of potential implications arises from the highly varied role played by the socioeconomic and regional or urban/rural differences in the quality of education available to students summarized in the SCHOOLID variable, which is the single strongest predictor of Mathematics outcomes, but is a weaker predictor of Science outcomes than are Mathematics scores, and about equal to Science as a predictor of Reading outcomes. These diverse effects of school-level characteristics provide some intriguing policy alternatives. As SCHOOLID is the strongest predictor of Mathematics outcomes, it may be an effective policy option to concentrate public expenditures and legislation on efforts to equalize the socioeconomic disparities if the “prime directive” is to enhance students’ Mathematics outcomes. Resulting higher Mathematics scores then would be expected to eventuate in positive transfer to Science. In turn, since Science and SCHOOLID are about equally important predictors of Reading outcomes, further positive effects on Reading could be anticipated from the subsequent enhancement of Science outcomes.
However, another relevant dimension to addressing transfer across reading, science, and mathematics, as measured by PISA, is that verbal acuity (writing and reading) may be thought of as a cognitive process and learning tool in science and mathematics education (e.g., Gunel, 2009). This adds a dimension to the discussion of student outcomes and the interdependence among skill sets that argues alternatively for providing a more robust resource base to enhance verbal skills. Also, within the Turkish context it seems imperative to alleviate the major regional, urban/rural, and socioeconomic disparities to increase the rate at which adolescents remain in public education. The implication of Turkey’s new 4+4+4 system (4 years of first-level primary education, 4 years of second-level primary education, and 4 years of secondary education) also must be taken into consideration.
References
Alacaci, C., & Erbas, A.K. (2010). Unpacking the inequality among Turkish schools: Findings from PISA 2006.International Journal of Educational Development, 30(2), 182-192.
Aypay, A. (2010). Information and communication technology (ict) usage and achievement of Turkish students in PISA 2006. The Turkish Online Journal of Educational Technology-TOJET, 9(2), 116-124.
Binkley, M., & Linnakylä, P. (1996). Teaching reading in the United States and Finland. In M. Binkley, K. Rust, & T. Williams (Eds.), Reading literacy in an international perspective (pp. 138-180). Washington, DC: U.S. Department of Education.
Blanchy, N. K., & Şaşmaz, A. (2011). PISA 2009: Where does Turkey stand? Istanbul: Sabanci University, Education Reform Initiative.
Brown, A. L.(1989). Analogical learning and transfer: What develops? In S. Vosniadou & A. Ortony (Eds.),Similarity and analogical reasoning (pp. 369-412). New York: Cambridge University Press. Bruner, J. (1990). Acts of meaning. Cambridge, MA: Harvard University Press.
Campione, J. C., Brown, A. L., Reeve, R. A., Ferrara, R. A., & Palincsar, A. S.(1991). Interactive learning and individual understanding: The case of reading and mathematics. In L. T. Landsmann (Ed.),Culture, schooling, and psychological development (pp. 136-170).Norwood, New Jersey: Ablex.
Clements, D. H., & Gullo, D. F.(1984). Effects of computer programming on young children’s cognition.
Journal of Educational Psychology76(6), 1051-1058.
Cormier, S. M., & Hagman, J. D. (Eds.) (1987). Transfer of learning: Contemporary research and applications. New York: Academic Press.
Demir, I., & Kılıç, S. (2010). Usıng PISA 2003, examınıng the factors affectıng students’ mathematıcs achıevement H. Ü. Eğitim Fakültesi Dergisi (H. U. Journal of Education), 38, 44-54.
Demir, I., Kılıç, S., & Unal, H. (2010a). Effects of students’ and schools’ characteristics on mathematics achievement: Findings from PISA 2006. Procedia Social and Behavioral Sciences, 2(2), 3099–3103. Demir, I., Kılıç, S., & Unal, H. (2010b). The effect of quality of educational resources on mathematics
achievement: Turkish case from PISA-2006.Procedia Social and Behavioral Sciences, 2, 1855-1859. Dincer, M.A., & Uysal, G. (2010). The determinants of student achievement in Turkey. International Journal of
Educational Development, 30, 592–598.
Dixon, R. A., & Brown, R. A. (2012). Transfer of learning: Connecting concepts during problem solving.
Journal of Technology Education, 24(1), 2-17.
Dole, J., et al. (1991). Moving from the old to the new: Research on reading comprehension instruction. Review of Educational Research, 16(2), 239-264.
EURYDICE. (2011). Mathematics education in Europe: Common challenges and national policies http://eacea.ec.europa.eu/education/eurydice
Fastrez, P. (2001). Characteristic(s) of hypermedia and how they relate to knowledge. Education Media International, 38, 101-110.
Fensham, P.J. (1985). Science for all: A reflective essay. Journal of Curriculum Studies, 17(4), 415-435. Freudenthal, H. (1983). Didactical phenomenology of mathematical structures. Dordrecht: D. Reidel.
Glewwe, P. (2002). Schools and skills in developing countries: Education policies and socioeconomic outcomes. Journal of Economic Literature, 40(2), 436–482.
Grisay, A., & Monseur, C. (2007). Measurıng the equıvalence of ıtem dıffıculty ın the varıous versıons of an ınternatıonal test. Studies in Educational Evaluation, 33, 69–86.
Gumus, S., & Atalmıs, E.H. (2011). Explorıng the relatıonshıp between purpose of computer usage and readıng skılls of Turkısh students: Evıdence from PISA 2006.The Turkish Online Journal of Educational Technology—TOJET, 10(3), 129-140.
Gunel, M. (2009). Writing as a cognitive process and learning tool in elementary science education. Elementary Education Online, 8(1), 201-211.
Güzel, I.Ç., & Berberoğlu, G. (2005). An analysis of the programme for international student assessment 2000 (PISA 2000) mathematical literacy data for Brazilian, Japanese, and Norwegian students. Studies In Educational Evaluation, 31(4), 283-314.
Güzeller, C.O., & Akın, A. (2011). An examination of the programme for international student assessment (PISA) 2003 Turkish database with the aim of exploring the relationship between homework variables and mathematics achievement. Educational Research and Reviews, 6(13), 793-803.
Hanushek, E., & Kimko, D. (2000). Schooling, labor force quality and the growth of nations. American Economic Review, 95(5), 1184–1208.
Haskell, R. E. (2001). Transfer of learning. cognition, instruction, and reasoning. San Diego: Academic Press. Hayes, J. R., & Simon, H. A. (1977). Psychological differences among problem isomorphs. In N. J. Castellan,
D. B. Pisoni, & G. R. Potts (Eds.). Cognitive theory: II (pp. 21-41). Hillsdale, NJ: Lawrence Erlbaum Associates.
International Monetary Fund (IMF). (2011, April). World economic outlook: Tensions from the two-speed recovery: Unemployment, commodities, and capital flows. Washington, DC: IMF. Khishfe, R. (2012). Transfer of nature of science understandings into similar contexts: Promises and possibilities of an explicit reflective approach. International Journal of Science Education, 34, 1-26.
Leberman, S., McDonald, L., & Doyle, S. (2006). The transfer of learning: Participants’ perspectives of adult
education and training. Farnham, UK: Gower.
Legros, D., & Crinon, J. (Eds.). (2002). Psychologie des apprentissages et multimedia. Paris: Armand Colin. Lehrer, R., Buckenberg, T., & Sancilio, L. (1988). Influences of Logo on children’s intellectual development. In
R. E. Mayer (Ed.), Teaching and learning computer programming: Multiple research perspectives (pp. 75-110). Hillsdale, NJ: Erlbaum.
Masters, G., & Forster, M. (1996). Progress maps. Melbourne: Australian Council for Educational Research. Masters, G. N., Adams, R. A., & Wilson, M. (1990). Charting student progress. In T. Husen & T. N.
Postlethwaite (Eds.), International encyclopedia of education: Research and studies. Supplementary volume 2 (pp. 628–634). Oxford, England: Pergamon Press.
Mestre, J. P. (Ed.). (2005). Transfer of learning: Research and perspectives. Charlotte, NC: Information Age Publishing.
Millar, R., & Osborne, J. (1998). Beyond 2000: Science education for the future. London: King’s College School of Education.
Norris, S., & Phillips, L. (2003). How literacy in its fundamental sense is central to scientific literacy. Science Education, 87(2), 224-240.
Organization for Economic Co-operation and Development (OECD). (2012). http://www.oecd.org/pisa/participatingcountrieseconomies/
Organization for Economic Co-operation and Development (OECD). (2009a). Take the test: Sample questıons from OECD’s PISA assessments. http://www.oecd.org/pisa/pisaproducts/pisa2006/41943106.pdf Organization for Economic Co-operation and Development (OECD). (2009b). PISA 2009 assessment
framework – Key competencies in reading, mathematics and science. Paris: OECD.http://www.google.com/url?sa=t&rct=j&q=&esrc=s&source=web&cd=2&cad=rja&ved=0CD8 QFjAB&url=http%3A%2F%2Fwww.oecd.org%2Fdataoecd%2F11%2F40%2F44455820.pdf&ei=InvX UOrhF8aK2gXp54GACA&usg=AFQjCNG7rWsLSmhjf9VkP7HAhxLCFJWB1A&sig2=EUfQkulni3 mBa7HOmopCMA&bvm=bv.1355534169,d.b2I
Organization for Economic Co-operation and Development (OECD). (2009c). PISA data analysis manual SPSS® second edition. Paris: OECD.
Organization for Economic Co-operation and Development (OECD)(2007).PISA 2006: Science competencies for tomorrow’s world, Volume I: Analysis. OECD, Paris.
Ovayolu, Ö., & Kutlu, Ö.(2011) The range of scores in competency clusters of Turkish students in mathematics sub-test according to PISA2006. Procedia Social and Behavioral Sciences, 15, 17–26.
Ministry of National Education (MONE). (2007).Pisa 2006 uluslar arası öğrenci başarılarını değerlendirme programı ulusal ön rapor. Ankara, MONE.
Ministry of National Education (MONE). (2005). PISA 2003 projesi ulusal nihai rapor. Milli Eğitim Basımevi, Ankara: MONE.
Özenç, B., & Arslanhan, S. (2010, December). An evaluation of the PISA 2009 results. Ankara: Economic Policy Research Foundation of Turkey (Türkiye Ekonomi Politikaları Araştırma Vakfı).
Pea, R. D., & Kurland, D. M. (1984). On the cognitive effects of learning computer programming. New Ideas in Psychology 2(2), 137-168.
Perkins, D. N., & Salomon, G. (1988). Teaching for transfer. Educational Leadership,46(1), 22-32.
Perkins, D. N., & Salomon, G. (1992). Transfer of learning. International encyclopedia of education, second edition. Oxford, England: Pergamon.http://learnweb.harvard.edu/alps/thinking/docs/traencyn.htm Reinking, D. (1994). Electronic literacy. Perspectives in Reading Research, 4, 1-7.
Salomon, G., Globerson, T., & Guterman, E.(1989). The computer as a zone of proximal development: Internalizing reading-related metacognitions from a reading partner. Journal of Educational Psychology 81, 620-627.
Salomon, G., & Perkins, D. N. (1987). Transfer of cognitive skills from programming: When and how? Journal of Educational Computing Research, 3, 149-169.
Thorndike, E. L. (1923). The influence of first year Latin upon the ability to read English. School Sociology 17,
165-168.
Thorndike, E. L., & Woodworth, R. S. (1901). The influence of improvement in one mental function upon the efficiency of other functions. Psychological Review 8, 247-261.
World Bank. (2011). World development indicators database. Gross domestic product 2010. Last revised on 1 July 2011. http://siteresources.worldbank.org/DATASTATISTICS/Resources/GDP.pdf
World Bank. (2012). World development indicators database. Gross domestic product 2011, PPP. Last revised on 18 September 2012. http://databank.worldbank.org/databank/download/GDP_PPP.pdf