TECHNICAL UNIVERSITY OF CLUJ-NAPOCA
ACTA TECHNICA NAPOCENSIS
Series: Applied Mathematics, Mechanics, and Engineering Vol. 61, Issue III, September, 2018
INFLUENCE OF THE TEMPERATURE GRADIENT ON THE SPEED
OF A STIRLING GAMMA ENGINE
Adrian Ioan BOTEAN
Abstract: This study aims to highlight the influence of the temperature gradient on the speed developed by
a Stirling engine of the gamma type with a total cylinder capacity of 36.796 cm3. For the experimental determination of the speed a laser digital tachometer (Fervi C067) is used and the temperature gradient at the whole thermodynamic system is determined by means of temperature transducers (Pt100) and a thermal imaging camera (Flir T400). The Stirling engine is cooled in three configurations with the aid of a cooling fluid (water) for which the flow rate is monitored. The experimentally obtained data allows the plotting of the speed variation diagrams according to the temperature gradient, thus highlighting the optimal Stirling engine cooling rate for which the maximum speeds are recorded.
Key words: gamma Stirling engine, pressure, temperature, working fluid, power, speed, thermodynamic
cycle
1. INTRODUCTION
In this study we are aiming to determine the speed developed by a Stirling engine of the gamma type having as a variable parameter the temperature gradient. The constructive variant used uses air as working fluid [1, 2, 3]. Figure 1 shows the compositions of the Stirling engine of the gamma type with a total cylinder capacity of 36.796 cm3: 1 – expansion piston (displacer); 2
– the heat exchanger (expansion cylinder); 3 – radiator / cold heat exchanger; 4 – the con – rod of the expansion piston; 5 – plate; 6 – cylinder of the working piston; 7 – working piston; 8 – the con – rod of the working piston; 9 – the crank of the working piston; 10 – flywheel; 11 – the crank of the expansion piston.
Fig. 1. Stirling engine, type gamma, longitudinal section.
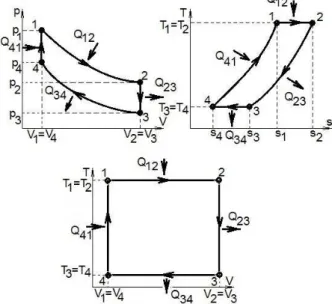
In order to understand how the temperature gradient influences the speed or
power developed by the Stirling gamma engine, its theoretical operating cycle [4, 5, 6], according to Figure 2, should be analyzed.
Simultaneously with the displacement of the expansion piston 1 (Figure 1), the displacement of the power piston 7 (Figure 1 and Figure 2) produces a migration of the working fluid to the area of the power cylinder 6 (Figure 1) which receives thermal energy by heat Q23.
Sience the movement of the two pistons is synchronized by means of the crank shaft mechanism, the transformation recorded by the working fluid is an isocorous (range 2 – 3 of Figure 2). Thus, the working fluid decreases the temperature and pressure.
In the next step the power piston 7 (Figure 1) performs isothermal compresion (range 3 – 4 of Figure 2) and the working fluid yields the Q34 thermal energy to the cold source,
represented by the radiator 3 of Figure 1.
At the next moment of the operating cycle the isocorous transformation (range 4 – 1 of Figure 2) is performed during which the working fluid accumulates the thermal energy Q41 from the hot source and the elements in the
area of the force cylinder cool down.
The mechanical work L produced by the Stirling engine is expressed by the relation:
= − =
= ∙ ∙ ∙ − ∙ =
= ∙ − ∙ − 1
Stirling’s thermal efficiency is calculated with the relation:
= = 1 − 2
Analyzing relations 1 and 2 from the perspective of the main study objective in this paper, it results that the mass, the specific heat of the working fluid and the temperature gradient between the hot and the cold source play a decisive role.
2. METHODS
Three cooling variants are considered in the present study: cooling variant 1 – the power cylinder is cooled – around a power cylinder 6 (Figure 1) is mounted a three – wire copper tube connected through a tap to the water network; cooling variant 2 – the expansion cylinder (radiator) is cooled – around the expansion cylinder 3 (Figure 1) a one – spoke copper tube is connected via a tap to the water network;
cooling variant 3 – both the power cylinder and the expansion cylinder are cooled, which are connected via a tap to the water network.
Thermal transfer depends on opening the water tap. Thus, there have been defined 5 tap openings for which the water flow rate has been measured for the case where the pressure in the mains supply is 3.6 bar.
For the 3 cases of cooling an experimental stand was designed according to Figure 4, Figure 4 and Figure 5. Five tap openings are defined, and for the three cooling variants (corresponding to each benchmark), is measure the time during which a 1.5 liters tank is filled affording the wather flow in the cooling circuit. For each cooling variant, three sets of measurements were made. Figure 6 shows the flow variation diagrams for the five valve opening points (landmark R1, R2, R3, R4 and R5).
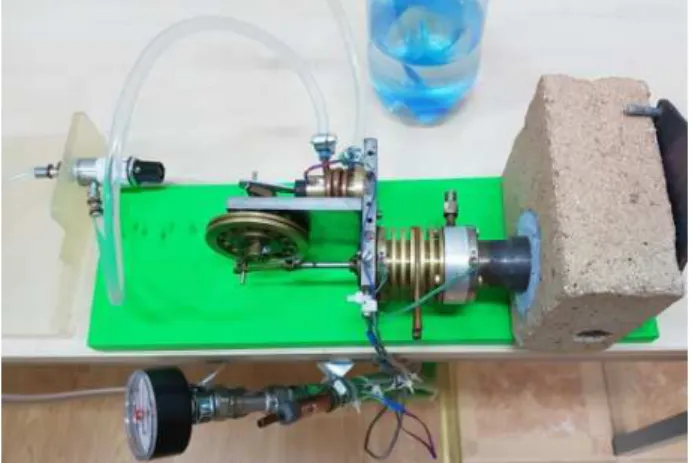
Fig. 3. Experimental installation for determining the flow of water through the cooling circuit (cooling variant 1).
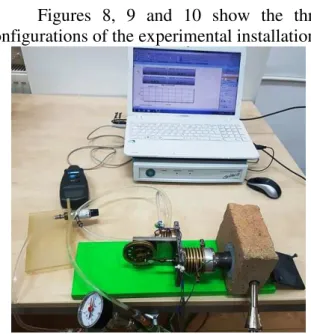
Fig. 5. Experimental installation for determining the flow of water through the cooling circuit (cooling variant 3).
Fig. 6. Water flow variation chart for the three cooling variants depending on the water tap opening.
Figure 7 shows the block diagram of the experimental installation for determining Stirling engine speed based on the temperature gradient, composed of the following elements: 1 – Stirling engine of gamma type; 2 – expansion cylinder; 3 – power cylinder; 4 – cooling coil mounted on the radiator; 5 – three cooling coils mounted on the power cylinder; 6 – temperature transducer (Pt100) mounted in the cold zone of the radiator; 7 – temperature transducer (Pt100) mounted in the hot zone of the radiator; 8 – temperature transducer (Pt100) mounted on the power cylinder; 9 – temperature transducer (Pt100) mounted on the cooling water supply circuit; 10 – FLIR T400 thermal imaging camera; 11 – cooling water supply valve; 12 – cooling water supply; 13 – laser digital tachometer Fervi C067; 14 – HBM Spyder8 data acquisition system; 15 – radiator.
Fig. 7. Block diagram of the experimental installation for determining the speed of a Stirling
engine, gamma type, depending on the temperature gradient.
Figures 8, 9 and 10 show the three configurations of the experimental installation.
Fig. 8. Experimental instalation for determining the speed in cooling version 1.
Fig. 10. Experimental instalation for determining the speed in cooling version 3.
3. RESULTS
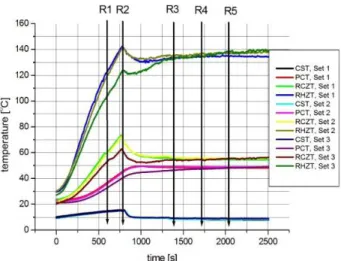
For each configuration of the experimental installation, three sets of measurements were performed, based on which a series of diagrams were drawn as follows: Figure 11 shows the variation of the temperature of the cooling water source (CST) measured with the thermoresistant transducer 9 of Figure 7, the temperature at the power cylinder (PCT) measured with the thermoresistant transducer 8 of Figure 8, the temperature of the radiator in the cold zone (RCZT) measured with the thermoresistant transducer 6 of Figure 7 and the radiator temperature in the hot zone (RHZT) measured with the thermoresistant transducer 4 of Figure 7 depending on time for the cooling variant 1 (case of cooling of the power cylinder – reference 3 in Figure 7); Figure 12 shows the temperature variation of the expansion cylinder temperature – the hot zone temperature HZT – (reference 2 in Figure 7) measured with FLIR T400 thermal imaging camera and the speed (measured using Fervi C067 laser digital tachometer – reference 13 in Figure 7) depending on time for cooling variant 1 (case of cooling the power cylinder – reference 3 in Figure 7).
Figure 13 shows the variation of the temperature of the cooling water source (CST) measured with the thermoresistant transducer 9 of Figure 7, the temperature at the power cylinder (PCT) measured with the
thermoresistant transducer 8 of Figure 8, the temperature of the radiator in the cold zone (RCZT) measured with the thermoresistant transducer 6 of Figure 7 and the radiator temperature in the hot zone (RHZT) measured with the thermoresistant transducer 4 of Figure 7 depending on time for the cooling variant 2 (case of radiator cooling – reference 15 in Figure 7); Figure 14 shows the temperature variation of the expansion cylinder temperature – the hot zone temperature HZT – (reference 2 in Figure 7) measured with FLIR T400 thermal imaging camera and the speed (measured using Fervi C067 laser digital tachometer – reference 13 in Figure 7) depending on time for cooling variant 2 (case of radiator cooling – reference 15 in Figure 7).
Fig. 11. Temperature variation chart CST, PCT, RCZT and RHZT depending on time for cooling
variant 1.
Fig. 13. Temperature variation chart CST, PCT, RCZT and RHZT depending on time for cooling variant 2.
Fig. 14. Diagram of variation of HZT temperature and speed depending on time for cooling variant 2.
Figure 15 shows the variation of the temperature of the cooling water source (CST) measured with the thermoresistant transducer 9 of Figure 7, the temperature at the power cylinder (PCT) measured with the thermoresistant transducer 8 of Figure 8, the temperature of the radiator in the cold zone (RCZT) measured with the thermoresistant transducer 6 of Figure 7 and the radiator temperature in the hot zone (RHZT) measured with the thermoresistant transducer 4 of Figure 7 depending on time for the cooling variant 3 (case of radiator and power cylinder cooling); Figure 16 shows the temperature variation of the expansion cylinder temperature – the hot zone temperature HZT – (reference 2 in Figure 7) measured with FLIR T400 thermal imaging
camera and the speed (measured using Fervi C067 laser digital tachometer – reference 13 in Figure 7) depending on time for cooling variant 3 (case of radiator and power cylinder cooling).
Fig. 15. Temperature variation chart CST, PCT, RCZT and RHZT depending on time for cooling variant 3.
Fig. 16. Diagram of variation of HZT temperature and speed depending on time for cooling variant 3.
From Figures 12, 14 and 16 by averaging multiple curves for each cooling variance, the Stirling engine’s speed comparison diagram for the three cooling cases considered in time – according to Figure 17 – is plotted.
the three sets of measurements (according to Figures 11, 12, 13, 14, 15 and 16).
Fig. 17. Comparative diagram of the variation of the speed versus time for the three cooling variants
considered.
Thus, Figure 18 and Figure 22 draws the cold source temperature (CST) comparative diagram for the three cooling variants. From this figures we can see that when the Stirling engine is put into operation, as the cooling fluid is trained in the cooling system, the temperature registers a constant value equal to that in the local water supply system.
Fig. 18. Diagram of variation of the average CST temperature versus time for the three cooling variants.
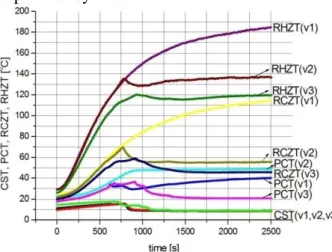
In Figure 19, Figure 20, Figure 21 and Figure 22 are plotted the comparison diagrams of power cylinder temperature (PCT), radiator temperature in the cold zone (RCZT), radiator temperature in the hot zone (RHZT) and expansion cylinder (HZT) for the three cooling variants. From these charts it is noted that cooling variant 2 (cooling radiator 15 according
to Figure 7) ensures the highest temperature gradient in the heat exchanger area (radiator).
Fig. 19. Diagram of variation of the average PCT temperature versus time for the three cooling variants.
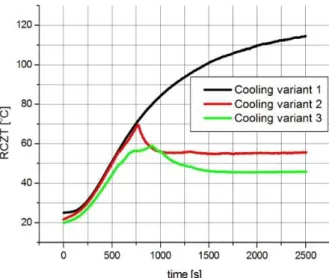
Fig. 20. Diagram of variation of the average RCZT temperature versus time for the three cooling variants.
Figure 23 shows that in cooling variant 2 the radiator takes up a higher amount of thermal energy from the heated cylinder expansion zone, an area where a lower temperature level is recorded compared to the other two cooling variants. The consequence of this may be the higher fuel consumption required to warm up the expansion cylinder.
Fig. 22. Diagram of variation of the average CST, PCT, RCZT and RHZT temperature versus time for the three
cooling variants.
Fig. 23. Diagram of variation of the average HZT temperature versus time for the three cooling variants.
Table 1 shows the fuel consumption recorded for the three cooling variants.
Table 1
Gaseous fuel consumption. Cooling
variant 1
Cooling variant 2
Cooling variant 3 Set1 43 gr 62 gr 52 gr Set2 54 gr 66 gr 58 gr Set3 47 gr 61 gr 56 gr Total/set 144 gr 189 gr 166 gr Average 48 gr 63 gr 53.3 gr
Total 499 gr
From Table 1 it can be noticed tht for fuel variant 2, fuel consumption is the highest value, thus confirming the observation made for Figure 23.
For the 9 tests performed in this study an average fuel mass of 55.4 grams was used and the duration of each test was about 42 minutes. In absolute terms for an operating period of 378 minutes, a fuel quantity of 499 grams was consumed, this being about 1.32 grams per minute.
To maintain the temperature of the expansion cylinder (reference 2 in Figure 1) at the highest temperature for cooling variant 2, consequently lower fuel consumption, it is proposed that between the expansion cylinder and the radiator (reference 3 of Figure 1) to install a gasket (reference 12 in Figure 24) of a good thermal insulating material, but also to ensure a proper sealing of the inner workspace (to avoid pressure loss which will lead to a decrease in performance the Stirling engine).
Fig. 24. Stirling engine, gamma type, update – reference 12 – gasket.
4. CONCLUSIONS
is necessary that at the level of the heat exchanger the temperature difference between the cold and the hot zone is as high as possible.
5. ACKNOWLEDGEMENTS
This study was made possible by the technical support given by: PhD. Eng. Fechete Lucian, lecturer at the Automotive Engineering and Transportations Department, Faculty of Mechanics, Technical University of Cluj-Napoca; Chiperi Ionela, student at the Management and Economic Engineering Department, Bistriţa branch, Faculty of Machine Building, Technical University of Cluj Napoca, Romania.
6. REFERENCES
[1] Botean, A.I., Florescu, M., Glogoveţan, A., Vitan, V., The functional analysis of a gamma type Stirling engine, Acta Technica Napocensis, Series: Applied Mathematics, Mechanics, and Engineering, Vol.59, Issue I, March, 2016, 53-58.
[2] Botean, A.I., Hiticaş, I., Experimental power determination of a gamma type Stirling engine, Acta Technica Napocensis, Series: Applied Mathematics, Mechanics, and Engineering, Vol.60, Issue I, March, 2017, 103-108.
[3] Botean, A.I., Influence of working fluid pressure on the power of a Stirling gamma
engine, Acta Technica Napocensis, Series: Applied Mathematics, Mechanics, and Engineering, Vol.61, Issue II, June, 2018. [4] Hell, F., Thermische Energietechnick, VDI.
Verlog, Dusseldorf, 1986.
[5] Kaltschmitt, M., Energiegewinnung aus Biomasse in kontext des deutschen Energiesystems, Energieanwendung, s19-25, No.1 Ian/Febr, 1995.
[6] Mădărăşan, T., Bazele termotehnicii, Ed. Sincron, Cluj – Napoca, 1998.
[7] Tew, R., Jefferies, K., Miao, D., A., Stirling engine computer model for performance calculations, National Aeronautics and Space Administration Lewis Research Center, 1978.
[8] Formosa, F., Despesse, G., Analytical model for Stirling cycle machine design, Energy Conversion and Management, 51 (2010) 1855-1863.
[9] Walker, G., Stirling Engines, Oxford: Clarendon Press, 1980.
[10] Schmith, G., Classical analysis of operation of Stirling engine. A report published in German Engineering. Union (Original German), vol. XV (1871), 1987, 1-12.
[11] Hirata, K., Schmidt theory for Stirling engines, National Maritime Research Institute, http://nmri.go.jp /env/khirata/ [12] www.robertstirlingengine.com/theory.php
Influența gradientului de temperatură asupra turaţiei unui motor Stirling de tip gamma
Rezumat: În acest studiu se urmăreşte evidenţierea influenţei gradientului de temperatură asupra turaţiei dezvoltate de
către un motor Stirling de tip gamma a cărei cilindree totale este de 36.796 cm3. Pentru determinarea experimentală a turaţiei se utilizează un tahometru digital cu laser (Fervi C067) iar gradientul de temperatură la nivelul intregului sistem termodinamic se determină cu ajutorul unor traductoare de temperatură (termorezistenţe Pt100) şi a unei camere de termoviziune (Flir – T400). Motorul Stirling este răcit ȋn trei configuraţii cu ajutorului unui fluid de răcire (apă) pentru care se monitorizează debitul de curgere. Datele obţinute experimental permit trasarea diagramelor de variaţie a turaţiei ȋn funcţie de gradientul de temperatură putându-se astfel evidenţia configuraţia optimă de răcire a motorului Stirling pentru care turaţia să ȋnregistreze valori maxime.
Adrian Ioan BOTEAN, Lecturer, Ph.D., Technical University of Cluj-Napoca, Department of Mechanical