Cross Flow Filtration
Method Handbook
Table of Contents
5
1
Introduction ...
6 1.1 What is cross flow filtration? ...
7 1.2 Key features of CFF ...
8 1.3 CFF application areas ...
9
2
Cross flow filtration systems ...
10 2.1 System configuration ...
12 2.2 Filters for cross flow filtration ...
14 2.3 System volumes and process capacity ...
15 2.4 Systems from GE ...
16
3
Process design and operation ...
17 3.1 Process considerations ... 19 3.2 Filter selection ... 21 3.3 Filter preparation ... 23 3.4 Operating parameters ... 26 3.5 Recovering product ... 28 3.6 Cleaning and testing filters ...
32 3.7 Scaling up processes ...
33
4
Optimizing CFF processes ...
34 4.1 Optimizing process parameters ...
40 4.2 Optimizing yield ...
42
5
Cell harvesting ...
43 5.1 Introduction ... 44 5.2 Cell harvesting process ...47 5.3 Membrane and cartridge selection ...
49 5.4 Operating parameters ...
52
6
Cell and lysate clarification ...
53 6.1 Introduction ...
56 6.2 Membrane and cartridge selection ...
58 6.3 Operating parameters ...
59 6.4 Clarification strategy examples ...
60 6.4.1 Mammalian cells ... 62 6.4.2 Bacterial cells ... 64 6.4.3 Yeast ...
66
7
Concentration and diafiltration ...
67 7.1 Introduction ...
69 7.2 Product and process considerations ...
72 7.3 Membrane selection ...
73
Appendix A
Abbreviations and glossary ...
79
Index ...
Table of Contents
1
Introduction
About this handbook
The Cross Flow Filtration Method Handbook gives a general introduction to the principles and applications of cross flow filtration using systems and filters from GE. Detailed in-structions for preparing, using, cleaning and storing particular filters are provided with each filter.
About this chapter
This chapter introduces the principles, basic terminology and applications of cross flow filtration.
In this chapter
This chapter contains the following sections:
See page Section
6 1.1 What is cross flow filtration?
7 1.2 Key features of CFF
8 1.3 CFF application areas
1.1
What is cross flow filtration?
Cross flow filtration (CFF, also known as tangential flow filtration TFF) is a filtration technique in which the starting solution passes tangentially along the surface of the filter. A pressure difference across the filter drives components that are smaller than the pores through the filter. Components larger than the filter pores are retained and pass along the membrane surface, flowing back to the feed reservoir (see Figure 1.1). CFF is simple in concept, but its proper execution requires detailed knowledge and good filtration technique.
Figure 1.1: Principle of cross flow filtration.
Solution that is directed to the membrane surface is called the feed. Solution that passes along the membrane surface and back to the feed reservoir is the retentate. This solution is usually pumped back to the feed reservoir and recirculated. Solution that passes across the membrane is the permeate.
Other terms used in CFF are explained in Appendix A Abbreviations and glossary, on page 73.
1 Introduction
1.2
Key features of CFF
Features
A key feature of CFF is the flow of fluid along the membrane surface that sweeps away the build up of material on the filter surface and reduces fouling of the filter. In addition, retentate solution can easily be recirculated, allowing thorough processing of large vol-umes of solution.
Differences between CFF and
normal flow filtration
CFF differs from normal flow filtration (where the starting material is simply passed through the filters, also known as dead-end filtration or direct flow filtration) in three main ways:
• CFF filters use membranes exclusively, while conventional filtration may use mem-branes, paper, or other materials such as glass fiber to separate components in a feed stream.
• CFF supports recirculation of the retentate solution. In normal flow filtration, the feed usually passes once through the filter.
• In a CFF system, the retentate remains as a solution and may be recovered directly. Retentate recovery is relatively uncommon in normal flow filtration and requires re-suspension of material collected on the filter.
1 Introduction
1.3
CFF application areas
CFF is used in research, product development, and production in the biopharmaceutical and medical industries.
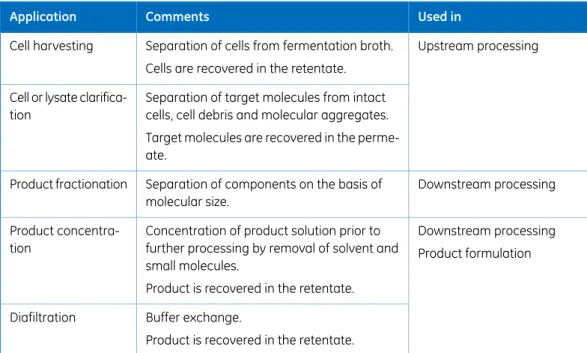
Table 1.1 summarizes the characteristics of typical CFF applications.
Table 1.1: Typical uses of cross flow filtration.
Used in Comments
Application
Upstream processing Separation of cells from fermentation broth.
Cell harvesting
Cells are recovered in the retentate. Separation of target molecules from intact cells, cell debris and molecular aggregates. Cell or lysate
clarifica-tion
Target molecules are recovered in the perme-ate.
Downstream processing Separation of components on the basis of
molecular size. Product fractionation
Downstream processing Concentration of product solution prior to
further processing by removal of solvent and small molecules.
Product
concentra-tion Product formulation
Product is recovered in the retentate. Buffer exchange.
Diafiltration
Product is recovered in the retentate.
Documents describing some examples of CFF applications are available from GE.
1 Introduction
2
Cross flow filtration systems
About this chapter
This chapter describes the essential components of CFF systems and introduces systems from GE.
In this chapter
This chapter contains the following sections:
See page Section
10 2.1 System configuration
12 2.2 Filters for cross flow filtration
14 2.3 System volumes and process capacity
15 2.4 Systems from GE
2.1
System configuration
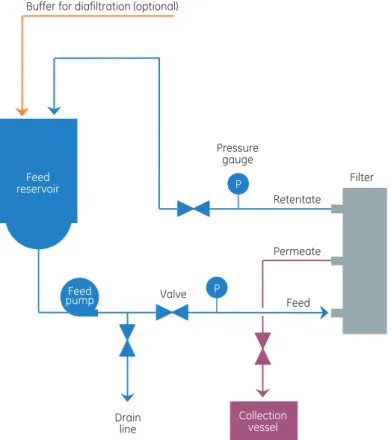
The illustration below shows a generalized scheme for the basic configuration of a CFF system. Feed reservoir Feed pump Drain
line Collectionvessel
Valve Feed Permeate Retentate Buffer for diafiltration (optional)
Pressure gauge
Filter
P
P
Figure 2.1: Basic configuration of a CFF system.
Pumps and valves
Liquid flow in the system is maintained by one or more pumps in the process lines (only the feed pump is shown in Figure 2.1) :
• A feed pump maintains the flow of feed into the filter.
• A retentate pump may be used to maintain and control flow of retentate back into the feed reservoir.
• A permeate pump may be used to control flow of permeate from the filter. The per-meate pump, if used, should not create negative pressure on the perper-meate side of
2 Cross flow filtration systems
• A transfer pump may be used in washing and diafiltration applications to add liquid (usually buffer) to the feed reservoir at a controlled rate.
Flow in the various process lines may also be regulated by valves with flow restrictors. Together, the controlled pump rates and valve restriction create the pressure across the membrane that drives the filtration process.
Pressure sensors
Pressure sensors in the feed and retentate lines are essential for monitoring and control-ling the process. A pressure sensor on the permeate side may also be used to monitor permeate pressure.
Flow sensors
Measurement of flow rates for feed solution, retentate and/or permeate and any addition of fluid to the feed reservoir is necessary for monitoring and controlling process conditions during filtration. Flow sensors are placed at strategic points in the system.
Reservoir level sensors
A level sensor in the feed reservoir monitors and controls the amount of liquid in the reservoir.
Air sensors
An air sensor located in the feed stream allows continuous monitoring for air bubbles in the feed prevents the introduction of air into the filter. An air sensor can also be used in the transfer line to detect when the transfer reservoir is empty.
Additional sensors
Temperature, pH, UV absorbance and conductivity sensors may be included in the system according to the requirements of the specific process.
2 Cross flow filtration systems
2.2
Filters for cross flow filtration
Filters for CFF may be classified according to filter configuration or filter pore size.
Filter configuration
Two basic filter configurations are generally used (see Figure 2.2):
Membrane Membrane Feed Feed Permeate Permeate Permeate Permeate Permeate Screen Cassette Cartridge (hollow fiber) Retentate Retentate
Figure 2.2: Configuration of hollow fiber cartridges and flat sheet cassettes.
• In cartridge filters (often called hollow fiber filters), the membrane forms a set of parallel hollow fibers. The feed stream passes through the lumen of the fibers and the permeate is collected from outside the fibers. Cartridges are characterized in terms of fiber length, lumen diameter and number of fibers, as well as filter pore size. Cartridges from GE have lengths of 30 to 110 cm and lumen diameters of 0.5 to 1.75 mm.
• In cassette filters, several flat sheets of membrane are held apart from each other and from the cassette housing by support screens. The feed stream passes into the space between two sheets and permeate is collected from the opposite side of the sheets. Cassettes are characterized in terms of flow path length and channel height, as well as membrane pore size. The channel height is determined by the thickness of the support screen.
Both cartridges and cassettes are constructed from materials chosen for mechanical strength, chemical and physical compatibility, and low levels of extractable and/or toxic compounds.
The total membrane surface area is one of the factors determining how much feed can be handled in a process run. Typical values for the selection of filters by membrane surface area are as follows:
2 Cross flow filtration systems
• For ultrafiltration, 100 to 200 liters of feed per m2of membrane surface area
Filter pore size
Two classes of filters are distinguished on the basis of filter pore size, which also distin-guishes between application areas. In both cases, the pore size is expressed as an aver-age value. The range of actual pore sizes in a given filter determines the selectivity of the filter.
Microfiltration filters
Filters with pore sizes of 0.1 μm and larger are classified as microfilters. In CFF applications the pore size is usually in the range 0.1 to 1 μm. These membranes are used for separation of cultured cells from the growth medium (broth), as well as for removal of particulate material in numerous biopharmaceutical processes.
Ultrafiltration filters
Ultrafiltration membranes have pore sizes in the range 20 to 100 nm, and are generally characterized in terms of the nominal molecular weight cutoff (NMWC), which is the molecular weight of the largest globular protein that can pass through the membrane. NMWC values range from 1 to 100 kD (kiloDalton). These filters are used for concentrating and fractionating protein streams, virus concentration, desalting and buffer exchange. The objective of most ultrafiltration processes is to retain soluble macromolecules such as proteins above a certain size, while allowing smaller molecules such as salts, amino acids, and mono- or disaccharides to pass through the membrane.
Filters from GE
GE supplies cartridges for both microfiltration and ultrafiltration, and cassettes for ultra-filtration. The choice of filter type to use for a given application is made in the first place on the filtration requirements: thus cartridges may be used for all applications, while cassettes are suitable for handling proteins.
See Section 3.2 Filter selection, on page 19 for more detailed guidelines concerning filter selection. Additional information is available from GE.
2 Cross flow filtration systems
2.3
System volumes and process capacity
Minimum working volume
The minimum working volume of a CFF system represents the amount of feed/retentate fluid required to operate the system at the desired cross flow rate without drawing air into the feed pump. The minimum working volume is determined by the design of the system (feed and retentate tubing volume, reservoir bottom design), the filter hold-up volume, and the cross flow rate. It is important to consider the minimum working volume of a system in the design of a CFF process and in particular to confirm that the final target retentate volume is not less than the system's minimum working volume.
Hold-up volume
The term hold-up volume refers to the volume of liquid in the filtration system. For some purposes it is useful to distinguish between the filter hold-up volume (the volume in the filter itself) and the system hold-up volume (the volume in the system tubing and pumps). The filter and system should be chosen with the smallest hold-up volume that is compat-ible with other performance requirements in the process.
Process capacity
The system process capacity (the volume of starting material that can be processed in one run) should be chosen in relation to the planned volume of starting material. Process capacity is partly a function of system size and design, but also varies according to the tendency of starting material to foul the filter. Using a high capacity system for a small sample volume will lead to unnecessary loss of material in the system dead volume. For processes that will be scaled up for production, it will be necessary to switch between different systems one or more times during process development (see Table 2.1). CFF processes using systems from GE are scalable, making transitions between systems straightforward.
2 Cross flow filtration systems
2.4
Systems from GE
CFF systems from GE cover a full range of filtration capacity from laboratory research to production, and offer different levels of monitoring and control from manual to fully automated systems. Customized systems can also be provided.
Table 2.1 summarizes the characteristics of the available systems. Additional information including system application matrix and selection guides is available from GE.
Table 2.1: Cross flow filtration systems from GE.
Applications Scale System Research Process development Laboratory ÄKTACrossflow™ Research Process development Small-scale production Laboratory to pilot ÄKTA™ flux Manufacturing Pilot to production UniFlux™
2 Cross flow filtration systems
3
Process design and operation
About this chapter
This chapter describes design and operation of a CFF process.
In this chapter
This chapter contains the following sections:
See page Section 17 3.1 Process considerations 19 3.2 Filter selection 21 3.3 Filter preparation 23 3.4 Operating parameters 26 3.5 Recovering product 28 3.6 Cleaning and testing filters
32 3.7 Scaling up processes
3.1
Process considerations
Several factors influence the design of a process. Among the foremost are properties of the starting material (feed) and product, and the total time required for the process. Other factors such as product yield and concentration may also be critical. Sometimes, factors may be mutually exclusive and a compromise must be reached: for example, it may not be possible to combine maximum yield with maximum product concentration.
Feed and product properties
The table below lists some of the main properties of feed and product that must be considered.
Significance Property
The composition of the feed affects the tendency for filter fouling (see Filter pore size, on page 20), which in turn influ-ences the processing capacity of the system.
Feed composition
Make sure that the chosen process design can handle the initial feed volume as well as the target volume.
Feed and product volume
Increased viscosity at lower temperatures may limit the pro-cess flow conditions.
Temperature sensi-tivity
Shear stress may be considerable at high flow rates, and sensitivity to shear stress may limit the usable flow rates. Sensitivity to shear
stress
Bear in mind that concentrations close to the membrane may be significantly higher than the feed or target concentrations (see Concentration gradient and gel layer, on page 34). Solubility
Make sure that the process design can handle the viscosity of the feed, retentate and permeate streams, as well as any increase in viscosity resulting from locally increased concen-tration of material at the membrane surface.
Viscosity
Time requirements
The time requirements for completing a CFF run will vary widely according to the appli-cation and requirements and system characteristics, and may be a crucial factor for the economics of the process as well as the stability of the product. As a general indication, the total time required for a typical run ranges typically from 3 to 8 hours, including system preparation and clean-up.
• preparing the filter and system for processing (up to 2 h)
3 Process design and operation
• conducting the filtration process (dependent on application) • cleaning and flushing the system and filter for storage (up to 2 h)
Other considerations
Other important factors in designing a CFF process include:
• Product yield - how important is it to maximize yield of the product?
• Product concentration - how important is it to obtain product at a high concentration? • Selectivity - how important is the purity of the product?
• Long-term filter stability - what is the working life of the filter under process condi-tions?
• Downstream processing - how will the product be used in the next processing step?
3 Process design and operation
3.2
Filter selection
The choice of filter between microfiltration and ultrafiltration and between cartridges and cassettes is governed by the nature of the application.
Technique and filter Separation principle Application Microfiltration (cartridge) Cells are separated from soluble
molecules. Cell harvesting
Cells and cell debris are separated from soluble molecules.
Cell or lysate clarifica-tion
Ultrafiltration (cartridge or cassette) Macromolecules are separated on the
basis of size. Protein fractionation
Macromlecules are separated from low molecular weight buffer components. Concentration and
diafil-tration
Within that framework, filters are chosen from consideration of selectivity, filter pore size and protein binding.
Filter selectivity
Filter selectivity describes the ability of a filter to separate particles or molecular species on the basis of size. Filters with a narrow pore size distribution will be highly selective, while a broader pore size distribution will give a less selective filter.
Harvesting and cell clarification applications involve separation of relatively large particles (cells and/or cell debris) from macromolecules, so that high selectivity is generally not required. Lysate clarification on the other hand may make more stringent demands, since the lysate will contain a wide range of proteins and other macromolecules. The most important factor is that the target protein can pass freely through the filter so that yields are not compromised.
Filter selectivity is also not critical for diafiltration, where a macromolecular product is separated from buffer components. The controlling factor here is that the target protein is completely retained by the filter, so that product is not lost in the permeate. An ultra-filtration filter with a nominal molecular weight cut-off (NMWC) that is 3× to 5× less than the molecular weight of the target molecule is generally recommended.
3 Process design and operation
Filter pore size
All filters will tend to become fouled (blocked by particulate material accumulating in the filter pores), especially during applications such as lysate clarification involving par-ticulate starting material. Fouling will shorten the time for which a filter can be used before it must be cleaned, and therefore restrict the maximum processing capacity per run. The choice of filter pore size is important for minimizing filter fouling. In general, filters with smaller pores will show less tendency to fouling, because particulate material cannot penetrate and block the pores.
Use the guidelines in the table below for selecting filters for harvesting and clarification applications:
Filter pore size Application
0.2 to 0.65 µm Mammalian cell harvesting
0.1 µm Yeast and bacterial cell harvesting
NMWC about 10× target molecule size Cell and lysate clarification
Protein binding
The level of protein binding depends upon the material in the filter and the protein characteristics, and increases with increasing hydrophobicity. Protein binding is seen as a reduction in yield that is not accounted for by product remaining in the retentate. Normally, protein binding remains insignificant at the laboratory scale, but for low NMWC ultrafiltration membranes it can be an indicator of a propensity towards filter fouling. For both clarification and diafiltration applications, protein binding to the filter usually becomes an issue when attempting to process small amounts of protein. In such cases it is important to select a filter with low binding tendency for the target protein, and to choose buffer conditions that minimize binding.
3 Process design and operation
3.3
Filter preparation
Preparation of filters for a process involves rinsing to remove storage solution and con-ditioning the filter with process buffer. For some processes the filter may need to be sanitized and depyrogenated before use. This section gives a brief overview of preparation procedures. More details are provided in the instructions accompanying eeach filter.
Sanitization and depyrogenation
Follow the steps below to sanitize and depyrogenate the filter if necessary.
Action Step
Clean and rinse the filter thoroughly. 1
Recirculate a solution of 0.1 to 0.5 M NaOH (pH 13) for 30 to 60 minutes at 30°C to 50°C.
2
Drain the system thoroughly. 3
Rinse the filter with clean water for 30 minutes. 4
Rinsing
New ultrafiltration filters are supplied filled with a glycerol solution which must be removed from the filter before use. Soaking the filter in 25% ethanol or isopropyl alcohol for 1 hour before rinsing will enhance glycerol removal. Complete removal of glycerol is important for filters that will be autoclaved or sterilized by steam-in-place procedures.
Rinsing is also recommended for used filters to remove storage solution. Rinsing steps are outlined below. Detailed instructions are provided with the filters.
Action Step
Fill the feed reservoir with deionized water or water for injection (WFI). Use room temperature or temperatures up to 50°C. Cold water will be less effec-tive. Addition of 100 ppm sodium hypochlorite (NaOCl) to the rinse water will enhance glycerol removal.
1
Start the pump at a low speed and adjust the TMP to 2
• 1 bar (15 psi) for 1,000 to 3,000 NMWC filters • 0.7 bar (10 psi) for 5,000 to 50,000 NMWC filters • 0.3 bar (4 psi) for larger pore sizes
3 Process design and operation
Action Step
To reduce water consumption, adjust the pump speed and retentate back pressure so that the retentate flow is approximately one tenth of the perme-ate flow.
3
Rinse with 50 L water per m2membrane surface area, adding more water as required.
4
If NaOCl is used, rinse the filter thoroughly before introducing the process solution.
5
Conditioning
Before processing samples, it is recommended to precondition the system with a buffer similar in pH and ionic strength to that of the sample to avoid denaturation and precipi-tation of proteins. Conditioning the system also helps to remove trapped air.
Conditioning steps are outlined below. Detailed instructions are provided with the filters.
Action Step
Circulate buffer through the system with approximately 0.3 to 1 bar (4 to 15 psi) retentate pressure. Run until no bubbles appear in the permeate stream. 1
To ensure removal of trapped air, increase the retentate flow rate and run for several minutes until no bubbles appear in the retentate stream. 2
Circulate the buffer through the retentate and permeate at a feed pressure of 1.6 to 2.8 bar (25 to 40 psi) for four minutes to condition the system for pH and ionic stability.
3
Remove the buffer from the feed reservoir. Keep buffer in other parts of the system to prevent air from entering the system.
4
3 Process design and operation
3.4
Operating parameters
A CFF process may be controlled by an interplay of several operating parameters accord-ing to the specific process requirements. The most important parameters are
• Pressure at various points in the system • Flow rate at various points in the system • Process time
Pressure and flow rates
Liquid pressure and flow rates are essential factors for controlling and monitoring a CFF process.
Pressure
Pressure may be monitored in the feed stream, the retentate stream or the permeate stream. Two differential pressure measurements are generally used, ΔP and transmem-brane pressure (TMP).
• ΔP is the difference in pressure between the feed and retentate streams, and can be used to control cross flow.
∆P = Feed pressure – Retentate pressure
TMP =
• TMP represents the driving force for transfer of material across the filter, and is cal-culated as shown below. TMP can be used to control flux.
∆P = Feed pressure – Retentate pressure
TMP = Feed pressure Retentate pressure2 – Permeate pressure
Flow rates
Flow rates may be monitored at various points. The sum of the flow rates out of the filter on the retentate and permeate sides is equal to the flow rate of feed into the filter. The retentate flow rate is also known as the cross flow rate or recirculation rate. The per-meate flow rate (the rate of liquid flow through the filter membrane) is known as the flux.
Flux is commonly expressed in units of liters per m2of membrane per hour (LMH). This value is scalable, meaning that it can be kept constant when the process is scaled up. For hollow fiber filters, the cross flow rate through the fiber lumen is often expressed as the shear rate1in units of s-1, which is a function of the flow rate per fiber and the di-ameter of the fiber lumen.
Shear rate is calculated as:
1 Do not confuse shear rate with shear stress. Shear stress is the force that can disrupt cells or denature
proteins under conditions of rapid flow. Shear rate is a liquid flow rate that influences but is not equivalent to shear stress.
3 Process design and operation
Equation (1) y = 4q/πR3 Description Vari-able shear rate (s-1) y
volume flow through the fiber lumen, cm3/s per fiber q
fiber radius (cm) R
Expressing cross flow rate as shear rate makes it possible to scale up or down between cartridges. By using a shear reference chart, it is possible to approximate the flow rate that will yield the same shear rate at the new scale.
Shear rates are not commonly used for cassettes since calculation is complicated by of the influence of the support screen. Calculation of shear rates for cassettes is beyond the scope of this handbook.
Process control modes
CFF systems from GE that run under UNICORN™ software support the process control modes commonly used in microfiltration and ultrafiltration/diafiltration applications, such as TMP control and flux control. These control modes can be combined with se-lectable feed pump instructions such as feed flow rate, feed pressure, ΔP, retentate flow rate or shear rate.
TMP control mode
In this mode, the TMP is mainly controlled by the retentate control valve, adjusting the valve to maintain a constant TMP. The flux is allowed to vary, usually within specified limits.
TMP control is usually used in ultrafiltration where the system forces retentate through the relatively small pores of the membrane. The TMP control mode is mostly used at constant feed flow, constant retentate flow or constant ΔP.
Flux control mode
In this mode, the flux is maintained at a controlled rate by regulating feed or retentate and permeate flow. The TMP is allowed to vary if necessary, usually within specified limits.
3 Process design and operation
Flux control is usually used in microfiltration where the system limits the permeate flow through the relatively large pores of the membrane. The control mode is used at constant feed flow, constant retentate flow, constant shear rate or constant ΔP. In this mode the TMP value is a function of the permeate flux.
During flux control it is common that the feed pressure is so low that the permeate pump creates a negative pressure in the permeate stream. An automated system should include control procedures to handle this situation, for example by temporarily reducing the re-tentate flow to increase the rere-tentate and permeate pressure.
Process time
Process time from start to finish (including system preparation and clean-up) may be of crucial importance for the economics of a process, or for the quality of a product that displays limited stability (for example, cell lysates often contain enzymes that may degrade the product, and it is important to work fast in the early separation stages). Practical considerations, such as being able to complete the process in one working day, may also be relevant.
Process time requirements may influence the choice of control mode as well as the choice of system and filter.
3 Process design and operation
3.5
Recovering product
Product is recovered either from the retentate or the permeate according to the type of application. Recovery in the permeate can be maximized at the expense of product concentration by washing the retentate with buffer as a final step in the filtration. Recov-ery in the retentate is affected by accumulation of material (including product) in a high concentration layer on the membrane surface and by liquid remaining on wetted surfaces of tubing and reservoirs.
Recovering product from the
membrane surface
Product may be recovered from the membrane surface without adding buffer or permeate to the system. This enables the most highly concentrated product to be obtained at the expense of some yield loss.
Typically, product recovery from the membrane surface involves the following steps:
Action Step
At the end of the process of harvesting cells or concentrating a protein, close the permeate valve or reduce the feed pressure to 0.3 bar (5 psi).
1
Reduce the cross flow rate to 1/10 of the recommended processing cross flow rate and reduce the mixer speed.
2
Circulate the feed for 15 minutes. This will help to recover product that has accumulated on the surface of the membrane.
3
Pump the product to the collection vessel. 4
Flushing out product with buffer
Flushing product out of the filtration system with buffer enables the highest yield to be obtained at the expense of concentration. In this technique, the product is first collected from the system, then a small volume of buffer or permeate is added to the system to flush out the residual product from the feed retentate loop.
This approach can be combined with recovery of product from the membrane surface. Typically, product flushing involves the following steps:
Action Step
As the CFF process nears completion, decrease the pump speed and mixer speed to minimize flow rate, vortexing in the feed tank, and the possibility for product foaming.
1
3 Process design and operation
Action Step
When the slightly over concentrated volume is reached, pump the concen-trated product to the collection vessel.
2
Add an appropriate volume of buffer to the reservoir. The buffer should be circulated for two to three minutes with the permeate valve closed to help bring the residual product into suspension.
3
Pump the buffer solution from the system into the collection vessel. 4
3 Process design and operation
3.6
Cleaning and testing filters
Filter life cycle
Many laboratory filters are designed for single use, but cleaning and re-use of filters is an important economic consideration at process development, pilot and production scales. Figure 3.1 illustrates the typical life cycle of a CFF filter.
Typically the performance of the filter is checked both before and after use by measuring the rate of water flow through the membrane under controlled conditions. The filter should be replaced when the water flux drops to unacceptable levels. Additionally, air diffusion and/or bubble point tests may be included to ensure filter integrity.
CFF filter (new or used)
Air diffusion or bubble point test
Water flux test
Use and clean filter Water flux test
Storage
Fail test: Fail test:
Clean and test again or dispose of filter.
Fail test: Dispose of filter. Air diffusion and bubble point tests are normally only completed when using pilot- and production-scale equipment.
Clean and test again or dispose of filter.
Figure 3.1: Operational cycle of membrane filters.
3 Process design and operation
Cleaning procedures
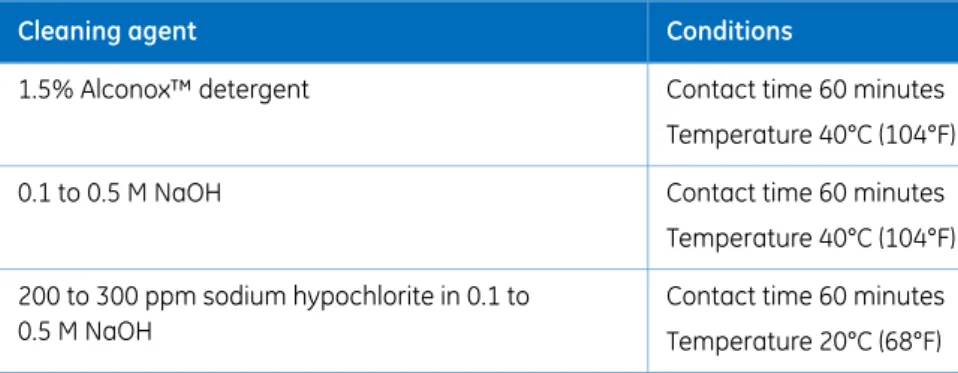
Recommended cleaning agents for CFF filters are listed in Table 3.1. More detailed infor-mation is provided with the filters.
Table 3.1: Recommended cleaning agents for Kvick cassettes.
Conditions Cleaning agent
Contact time 60 minutes 1.5% Alconox™ detergent
Temperature 40°C (104°F) Contact time 60 minutes 0.1 to 0.5 M NaOH
Temperature 40°C (104°F) Contact time 60 minutes 200 to 300 ppm sodium hypochlorite in 0.1 to
0.5 M NaOH Temperature 20°C (68°F)
Water flux test
The water flux test measures the flow rate of water through the membrane under con-trolled conditions. The flow rate provides an indication of the performance capability of the membrane. By tracking the water flux measurements over time, it is possible to de-termine when a filter reaches the end of its service life. Water flux will normally drop by up to 20% of its starting value the first use and cleaning cycle. The performance level should remain stable from that time forward. Water flux testing is usually carried out when the filter is new and after each use or cleaning cycle.
Details of how to perform and evaluate a water flux test are provided with filters supplied by GE.
Air diffusion and bubble point
tests
Air diffusion and bubble point tests are supported in some CFF systems from GE to check filter integrity. Details of these tests are provided in the respective system documentation.
3 Process design and operation
Troubleshooting filter
performance
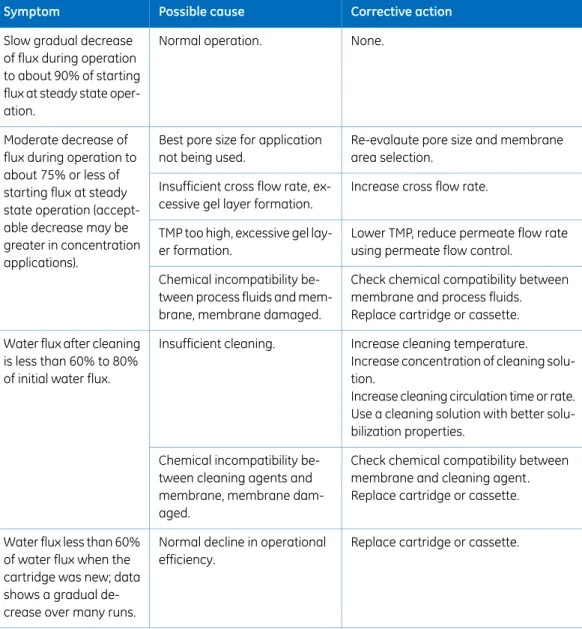
The table below lists possible causes and corrective actions for problems when flux de-teriorates.
Table 3.2: Troubleshooting cross flow filtration processes.
Corrective action Possible cause
Symptom
None. Normal operation.
Slow gradual decrease of flux during operation to about 90% of starting flux at steady state oper-ation.
Re-evalaute pore size and membrane area selection.
Best pore size for application not being used.
Moderate decrease of flux during operation to about 75% or less of starting flux at steady state operation (accept-able decrease may be greater in concentration applications).
Increase cross flow rate. Insufficient cross flow rate,
ex-cessive gel layer formation.
Lower TMP, reduce permeate flow rate using permeate flow control.
TMP too high, excessive gel lay-er formation.
Check chemical compatibility between membrane and process fluids. Replace cartridge or cassette. Chemical incompatibility
be-tween process fluids and mem-brane, membrane damaged.
Increase cleaning temperature. Increase concentration of cleaning solu-tion.
Increase cleaning circulation time or rate. Use a cleaning solution with better solu-bilization properties.
Insufficient cleaning. Water flux after cleaning
is less than 60% to 80% of initial water flux.
Check chemical compatibility between membrane and cleaning agent. Replace cartridge or cassette. Chemical incompatibility
be-tween cleaning agents and membrane, membrane dam-aged.
Replace cartridge or cassette. Normal decline in operational
efficiency. Water flux less than 60%
of water flux when the cartridge was new; data shows a gradual de-crease over many runs.
3 Process design and operation
Corrective action Possible cause
Symptom
Check chemical compatibility between membrane and cleaning agents and/or process fluids.
Replace cartridge or cassette. Chemical incompatibility
be-tween cleaning agents and/or process fluids and membrane, membrane damaged Water flux less than 60%
of water flux when the cartridge was new; data shows decrease was sudden.
Increase cleaning temperature. Increase concentration of cleaning solu-tion.
Increase cleaning circulation time or rate. Use a cleaning solution with better solu-bilization properties.
Insufficient cleaning.
3 Process design and operation
3.7
Scaling up processes
The ability to scale a process from the laboratory to manufacturing is a key factor in process development. Normally, the scale-up sequence is completed in multiple steps: lab scale to pilot scale, and pilot scale to production scale. Reasonable scale-up incre-ments are typically 5 to 20 times.
Scaling up a process involves increasing the filter area in order to handle larger volumes of starting material without significantly changing process conditions. The following parameters should be kept constant where possible:
• Ratio of filter area to feed volume • Fiber or cassette path length
• Channel height (cassettes) or lumen size (hollow fiber cartridges) • Membrane characteristics (pore size, selectivity, materials) • Cross flow rate per unit filter area
• TMP
• Temperature • Feed concentration • Process steps and sequence
3 Process design and operation
4
Optimizing CFF processes
About this chapter
This chapter considers optimization of CFF processes.
In this chapter
This chapter contains the following sections:
See page Section
34 4.1 Optimizing process parameters
40 4.2 Optimizing yield
Process parameters may be optimized with respect to several factors, such as capacity, total process time, product yield and purity and so on.
4.1
Optimizing process parameters
Recommendations in this section apply mainly to concentration and diafiltration appli-cations. While similar principles apply to process optimization for other applications, details will differ depending on the starting material and on whether the product is re-covered in the permeate or retentate.
Concentration gradient and gel
layer
One factor that influences the optimization of process parameters is the tendency to form a concentration gradient of material (and in extreme cases a compact gel-like layer) on the surface of the filter membrane.
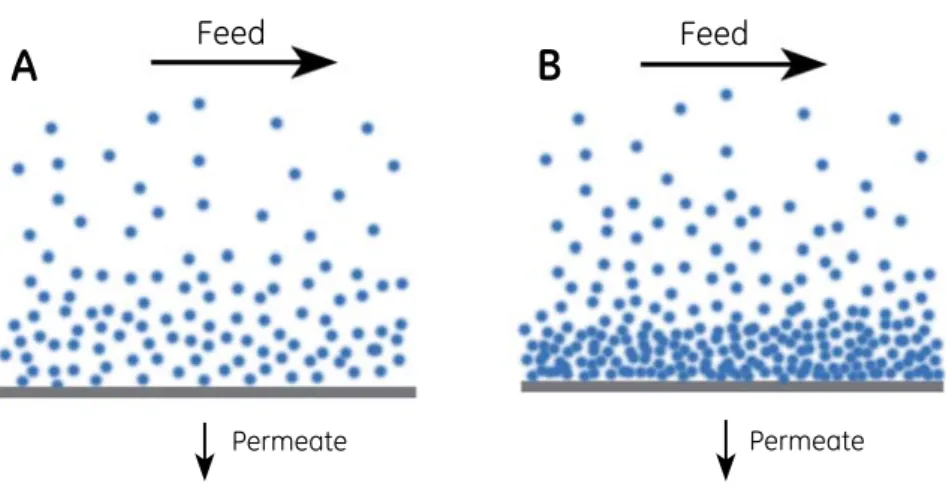
During filtration, molecules and particles that do not pass through the membrane accu-mulate to some extent at the membrane surface, forming a concentration gradient (Figure 4.1A). The concentration gradient layer reduces the flux compared to water or buffer flux. Turbulent liquid flow across the membrane surface helps to wash the con-centrated material back into the retentate, reducing but not eliminating the accumulation effect. Decreasing TMP can lower the concentration gradient layer and its effects on flux. Increasing the cross flow rate helps to redistribute concentrated solutes back into the bulk feed stream and maintain flux.
As the concentration gradient becomes more pronounced, the highest concentration of material at the surface of the membrane will tend to form a gel-like layer, markedly impeding permeate flow (Figure 4.1B). Formation of a gel layer is seen as a reduction in the rate of increase of flux as the TMP is increased. The gel layer also has a considerable effect on the filtration process, influencing both filter efficiency and selectivity. To control the filtration process, steps must be taken to minimize the formation of a gel layer. The following operating conditions reduce the risk of gel layer formation:
• Low TMP
• High cross flow rate • Low feed concentration
Optimization of a CFF process should include determination of the combination of TMP and cross flow rate that gives the highest flux rate without forming a gel layer.
4 Optimizing CFF processes
Feed
Feed
A
B
Permeate Permeate
Figure 4.1: During processing, a gradient of increasing concentration of solutes forms between the bulk feed flow and the membrane surface (A). If the permeate flow is too high in relation to the cross flow, the concentration at the membrane surface may become high enough to form a gel-like layer (B).
Flux versus TMP
In CFF, the key optimization parameter is the flux rate as a function of TMP. For a given cross flow rate, TMP controls flux at the beginning of a run. If a gel layer forms, increases in TMP will not result in increases in flux and will provide little if any performance gain. The optimal TMP range for efficient and economic operation is just before the gel layer starts influencing the flux (Figure 4.2).
Gel layer control region
Optimal TMP range 1 F C r e t a W TMP Per m ea te fl ux
Figure 4.2: Optimal TMP range under a constant cross flow rate.
4 Optimizing CFF processes
TMP and cross flow
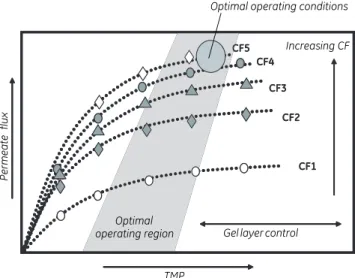
At a given TMP, increasing the cross flow rate helps to reduce the concentration gradient layer and increase flux. Cross flow rates may be increased until process yield, product quality or process economics are adversely affected through, for example, shear stress effects. Optimization of a CFF process such as protein concentration must include an examination of the interaction of the two most important variables: cross flow and TMP. At the optimum combination of the highest cross flow and TMP, just before gel layer accumulation, the highest flux rate will be achieved (Figure 4.3).
CF2 CF1 CF5 CF4 CF3 Optimal operating region CF2 CF1 CF5 CF4 CF3
Optimal operating conditions
Increasing CF
Gel layer control Optimal operating region TMP Pe rm ea te fl ux
Figure 4.3: Relationship between flux and TMP at different cross flow rates.
4 Optimizing CFF processes
TMP scouting
TMP scouting (sometimes known as TMP excursions) is an important part of process optimization. Increasing TMP when ultrafiltering pure water results in a proportional in-crease in flux. With a process fluid that contains solutes the rate of inin-crease in flux drops as the TMP increases and the concentration gradient restricts passage of liquid through the filter. At high TMP values, formation of a gel layer effectively blocks the filter and no further increase in flux is seen. Higher cross flow rates help to prevent the formation of a gel layer, allowing higher flux rates to be achieved before the flux becomes independent of TMP.
TMP scouting involves measuring the interdependence of cross flow rate, TMP and flux in order to determine the optimum conditions for filtration, where flux is high but is still dependent on TMP. The standard procedure is to perform a TMP scouting experiment in which a series of TMP setpoints is measured at different cross flow rates. From these experiments the effect on flux is evaluated, and optimal cross flow and TMP may be identified.
As an example, Figure 4.4 shows the results of TMP scouting for a solution of BSA at a concentration of 30 g/L and 150 g/L (representing the initial and target concentrations respectively). Flux is measured at 6 TMP points and 3 cross flow rates with permeate recycled to the feed reservoir to maintain a steady state.
At the low protein concentration, flux increases with TMP at all cross flow rates and there is no clear optimal setting. At the high protein concentration, however, the curves flatten out at high TMP values, indicating that the formation of a concentration gradient is be-ginning to restrict flux across the membrane. With this information, it is possible to design a process control scheme that maintains a high flux value for a reasonable process time and stable process conditions.
75 100 125 150 175 200 225 250 0,75 1,00 1,25 1,50 1,75 2,00 2,25 2,50 2,75 3,00 TMP excursions BSA 30 g/L Fl u x [ LM H ] TMP [ bar]
CF 42ml/min CF 33 ml/min CF 25 ml/min
30 40 50 60 70 80 90 0,75 1,00 1,25 1,50 1,75 2,00 2,25 2,50 2,75 TMP excursions BSA 150g/L F lu x [ L M H ] TMP [ bar]
CF 42 ml/min CF 33 ml/min CF 25 ml/min
optimal
Figure 4.4: TMP scouting results at two concentrations of BSA (left 30 g/L, right 150 g/L). Note the difference in flux rate scale at the different protein concentrations.
4 Optimizing CFF processes
Process time
In a concentration process, the optimized cross flow and TMP conditions established above can be used to identify the diafiltration point (the point which provides the fastest buffer exchange), and optimal buffer consumption. A typical result file for diafiltration time optimization is shown in Figure 4.5.
Concentration factor Flux
Figure 4.5: Result file for diafiltration time optimization.
Plotting flux*concentration factor against concentration factor enables the optimization of diafiltration time (Figure 4.6). The highest value on the y axis at the highest concentra-tion represents the fastest diafiltraconcentra-tion with the lowest buffer consumpconcentra-tion. In this exam-ple, diafiltration takes the same time if performed at four times or five times concentration, because the decrease in retentate volume at five times concentration is offset by the decrease in flux.
4 Optimizing CFF processes
Figure 4.6: Diafiltration time optimization.
4 Optimizing CFF processes
4.2
Optimizing yield
Optimizing a laboratory filtration process for product yield ensures efficient use of lab resources as well as accurate projections for scaling to pilot equipment. In production contexts, optimizing yield can have a major impact on process economics.
In addition to filter selection, the key factors that influence product yield are: • Non-recoverable product
• Product losses through denaturation and degradation
Non-recoverable product
The system design can affect product yield if it impedes recovery of the product. Poorly designed systems include long tubing runs, unnecessarily wide tubing, poor tank drainage, and other non-recoverable volume such as poorly positioned drain valves. Even in well-designed systems, some retentate product remains on the wetted surfaces of the tubing and reservoir unless the system is flushed with buffer. The choice of recovery option depends on the relative importance of total yield and final product concentration: • Draining the system without flushing leaves some process fluid in the system but
recovers product at the highest concentration.
• Flushing the retentate side of the system maximizes product recovery at the expense of concentration.
Denaturation and degradation
Loss of product through denaturation and/or degradation may occur as a result of ex-cessive shear stress, unsuitable temperature or enzymatic action during the filtration and recovery process.
Shear stress
The sensitivity of biomolecules to shear stress generally increases with molecular size. Most proteins are relatively resistant to denaturation through shear stress. If the shear sensitivity of the product is not known, a quick feasibility study may be performed by circulating the product through the feed-retentate path and monitoring the bioactivity as a function of process time. Where feasible, low pressures and low pump speeds should be used to minimize shear stresses in the flow path.
Temperature
For heat sensitive proteins the process solution temperature can be modified in a number of ways during processing to optimize product yield:
• Precondition the system with cooled buffer before starting
4 Optimizing CFF processes
• Use chilled buffer during diafiltration
• Use low pressure and low pump speed to reduce heat generation in the flow path • Use a low ratio of feed volume to filter surface area to shorten process time • Place the system in a cold room
• Use a heat exchanger or tank jacket
Enzymatic action
Proteolytic enzymes released during cell culture or lysis may follow the target protein through the filtration process and cause degradation and loss of yield. The effect may be more pronounced in ultrafiltration or diafiltration applications, where both enzymes and target proteins may be concentrated together in the concentration layer at the filter surface or in the retentate.
Enzymatic activity may be reduced by: • Including enzyme inhibitors in the sample
• Using a low ratio of feed volume to filter surface area to shorten process time • Lowering the temperature of the process
• Adjusting buffer conditions (ionic strength, pH, metal ions, etc.) to minimize enzyme activity
4 Optimizing CFF processes
5
Cell harvesting
About this chapter
This chapter considers the use of CFF for harvesting cultured cells.
In this chapter
This chapter contains the following sections:
See page Section
43 5.1 Introduction
44 5.2 Cell harvesting process
47 5.3 Membrane and cartridge selection
49 5.4 Operating parameters
5.1
Introduction
Cell harvesting is the process of separating cells from the fermentation broth in which the cells are grown. Hollow fiber microfiltration or higher NMWC ultrafiltration cartridges may be used effectively for cell harvesting. The harvested cells are recovered in the re-tentate.
Successful cell harvesting relies on knowledge of parameters such as: • Robustness of the cultured cells
• Starting volume and concentration of cells • Desired finished concentration and volume • Desired yield and integrity of the cells
5 Cell harvesting
5.2
Cell harvesting process
The cell harvesting process involves both concentration and washing of the cells.
Concentration
Cells are concentrated as part of the harvesting process (Figure 5.1).
Feed contains cells and unwanted broth components Filter Permeate collection vessel Feed reservoir contains concentrated
cells and residual broth components
Filter
Permeate contains unwanted broth
components Start of concentration step End of concentration step
Figure 5.1: Concentration is the first step in cell harvesting.
The concentration factor that can be achieved depends on the starting concentration, and is usually limited by the fluidity of the concentrated cell suspension. Typical concen-tration factors are shown in Table 5.1.
Table 5.1: Typical concentration factors for different cell types. Typical concentration factor Cell type 5× E.coli 2× Yeast 7 to 10× Mammalian
5 Cell harvesting
Washing
Cell harvesting usually includes a washing step to ensure effective removal of broth components from the cells (Figure 5.2).
Buffer Filter Feed reservoir contains cells and buffer Filter Permeate contains buffer and unwanted
components Start of washing step End of washing step
Feed reservoir contains concentrated
cells and residual broth components
Figure 5.2: Washing harvested cells after concentration.
After washing, the ideal end product would consist of the concentrated cells suspended in the buffer used to wash the cells. However, in practice the harvested cells in buffer can contain varying levels of unwanted elements such as precipitated proteins, enzymes, and cell debris.
The washing process is commonly a constant volume diafiltration process, in which buffer is added to the cell suspension at the same rate as the permeate flows across the membrane. Unlike centrifugal techniques where cells are packed in a dense cake or pellet, washing the cells in a buoyant state enables effective removal of contaminants.
5 Cell harvesting
Typical process steps
Typical steps in a cell harvesting method are outlined in Table 5.2:
Table 5.2: Typical steps in a cell harvesting method. Purpose Operation
Step
Rinse storage solution from filter. Rinsing
Preparation
Flush cleaning solution from system. Water flush
Determine performance of filter before processing. Water flux test
Condition filter and system components before adding product. Buffer condition-ing Concentrate cells. Cell harvesting (concentration) Harvesting
Remove unwanted components. Cell washing
(diafiltration)
Recover harvested cells. Product recovery
Flush residual product from system. Buffer flush
Finishing
Recirculate cleaning solution. CIP
Flush cleaning solution from system. Water flush
Determine the performance of filter after use and cleaning.
Water flux test
Flush filter with storage solution to prevent bacte-rial growth in storage.
Storage
5 Cell harvesting
5.3
Membrane and cartridge selection
In cell harvesting, microfiltration membranes will easily retain all cells. The key to mem-brane selection is based on process optimization rather than retention. For example, smaller pore size membranes often show less tendency to fouling and provide the highest permeate flux once the system in a steady state (Figure 5.3). The 500,000 NMWC ultrafiltration membrane is often the cartridge of choice for harvesting E. coli, even though it has a relative small pore size compared to the size of the cells.
Figure 5.3: Flux of three membranes with all parameters held constant except pore size. Membrane A has a larger pore size than membrane B, which has a larger pore size than membrane C. Shorter cartridges allow a low pressure drop for difficult separations using low TMP. Longer cartridges have a similar membrane area, but will require less circulation flow per unit area. Longer cartridges are therefore preferred for applications in which higher TMP does not adversely affect the separation (Table 5.3).
Suitable fiber lumen diameters for cell harvesting are 0.75 to 1.0 mm. Larger diameter fibers should be used for solutions with high suspended solids, high cell densities, and high viscosity.
Table 5.3: Recommended cartridges for cell harvesting.
Nominal pore size/NMWC Fiber lumen diameter (mm) Path length (cm) Suspended solids/viscosity Cell type 0.1 µm 500 kD 750 kD 1.0 30 or 60 Moderate E. coli 0.1 µm 0.2 µm 750 kD 1.0 30 High Yeast
5 Cell harvesting
Nominal pore size/NMWC Fiber lumen diameter (mm) Path length (cm) Suspended solids/viscosity Cell type 0.2 µm 0.45 µm 0.65 µm 0.75 or 1.0 30 or 60 Low to moder-ate Mam-malian
5 Cell harvesting
5.4
Operating parameters
Permeate flow control
In most cell harvesting applications, the permeate flow is often high even at low TMP, and the process is run under flux control to prevent premature fouling of the membrane. Restricting permeate flow generates back pressure on the permeate side of the filter. which effectively lowers the TMP and reduces fouling (Figure 5.4).
Unrestricted permeate flow
Permeate flow control
Time Per m ea te flow
Figure 5.4: Using permeate flow control results in more stable flux.
Typical starting conditions
Table 5.4: Recommended starting point for developing process conditions for harvesting applications. Virus particle concentra-tion Mammalian cells Bacterial cells 5× concentration followed by 3× diafiltration 10× concentration followed by 3× diafiltration 10× concentration fol-lowed by 3× diafiltration Low TMP and 6,000 s-1 shear, 20-50 LMH. Permeate flow control at
30 LMH, no retentate back pressure
Average flux 25 LMH with high cell density starting material and unrestricted permeate.
This process description is for purification of virus particles with gentle pro-cess conditions only. This process description is
for removal of cells and optimal recovery of ex-pressed target protein only. This process description
is for removal of cells.
5 Cell harvesting
Operating parameters
The table below summarizes the main aspects of process design for cell harvesting.
Table 5.5: The influence of process variables and feed solution on the CFF process. Selection considerations
Variable
Process variables
Use microfiltration cartridges for cell harvesting. Select mem-brane pore size based on the specific application to achieve a stable flux rate.
Cell harvesting
Solution variables
Determine wet cell percent to anticipate the degree of concen-tration that may be used. A highly concentrated cell mass may seem efficient but may also result in high inlet pressures: a shorter, less efficient path length (30 cm) may be preferable. Cell concentration
For whole cells, it is not uncommon to reach 70% wet cell weight while maintaining steady state conditions. However, lysates tend to need a lower solids level to promote passage of the target material. Start with solids in the 5 to 10% range and monitor transmission as well as TMP during the concentra-tion phase.
Solids loading
If the feed stream is particularly shear sensitive and the recir-culation flow rate is reduced, it may be necessary to lower the permeate flow rate (when using permeate flow control) to opti-mize throughput.
Shear sensitivity
When scaling a process, cartridge housing diameter is increased in order to maintain constant volume to area ratio. Estimate the flux rate so that the starting volume is suitable for the target process time.
Volume
As temperature decreases, the filtration time often increases due to viscosity effects, and larger cartridges might be appro-priate. For example, cold-room processing at 4°C can take twice as long as room-temperature processing.
Temperature
Other variables
Increased membrane area and larger housing size shorten process time.
Time constraints
5 Cell harvesting
Selection considerations Variable
Choose autoclavable or steam-in-place models for processes that will be scaled up for production.
Heat sterilization
When working with cells which may still be partially active, rapid methods may be impor-tant. This can be achieved by increasing the ratio of membrane area to process volume. Using more membrane area not only allows higher permeate flow rate, but it also reduces the risk of fouling by spreading material over a larger area.
Flux is dependent on the concentration of particles. With the high particle load typical of cell harvesting, low to moderate transmembrane pressures should be used (<1 bar, 15 psi).
Process temperature
Room temperature is recommended, but only if process components are stable at this temperature. Otherwise operate at 4° to 12°C but with lower flux.
5 Cell harvesting
6
Cell and lysate clarification
About this chapter
This chapter considers the use of CFF for clarification of cell cultures and lysates.
In this chapter
This chapter contains the following sections:
See page Section
53 6.1 Introduction
56 6.2 Membrane and cartridge selection
58 6.3 Operating parameters
59 6.4 Clarification strategy examples
6.1
Introduction
Clarification processes are used in two contexts: • Cell clarification
• Lysate clarification
In both cases the product is recovered in the permeate, while cell debris and larger particles remain in the retentate and are discarded (Figure 6.1). A wash step following the initial clarification is commonly used to maximize product recovery (Figure 6.2). The permeate will usually include unwanted components from the culture medium or cell lysate, and additional downstream steps are needed to purify the product.
Protein of interest with cells or cell debris and broth or lysate components
Permeate collection
vessel Permeate contains protein of interest and
broth or clarified lysate components Feed reservoir
contains mostly cells or cell debris and some protein of interest
Start of initial clarification End of initial clarification
Filter Filter
Figure 6.1: The initial clarification step recovers most of the product in the permeate and leaves unwanted particulate material in the retentate.
6 Cell and lysate clarification
Feed reservoir contains mostly cells or cell debris and buffer
Permeate contains protein of interest and buffer
Filter Filter
Feed reservoir contains mostly cells or cell debris and some protein of interest
Start of washing step End of washing step
Figure 6.2: A washing step followng the initial clarification maximizes product recovery.
Successful clarification of feed streams to recover target proteins requires knowledge of the starting product and the finished product specifications such as:
• Target molecule molecular weight, morphology, and robustness • Starting volume and concentration of the target protein • Desired finished protein concentration and volume • Desired yield and quality (activity) of the protein • Level of suspended solids
As with cell harvesting, rapid processing times may reduce the exposure of the target protein to shear forces, enzymatic action and elevated temperature.
6 Cell and lysate clarification
Cell clarification
Cell clarification is used to recover target protein that is expressed in the culture medium during cell culture. The cells are filtered and remain in the feed/retentate loop, while the permeate contains the protein or molecule of interest. Separating a protein from a cell culture is similar to cell harvesting except that the product of interest is the protein in the permeate. An effective cell clarification process enables the passage of the greatest amount of target molecules. To optimize recovery of the target protein, a wash step is often added to the cell clarification process to help flush the target molecules through the membrane (Figure 6.2).
The cells are concentrated as liquid is removed in the permeate. The level to which cells can be concentrated during cell clarification varies according to cell types. For typical concentration factors, see Table 5.1.
Lysate clarification
Lysate clarification is used after lysis of harvested cells to recover the target molecule from the cell contents. Components in lysates often tend to foul membrane pores. To minimize pore fouling, and to enable the filter to operate under equilibrium conditions, initial lysate clarification trials often include a constant volume wash with little or no concentration. A large wash volume (typically 5× the starting volume of lysate) is used to ensure efficient recovery of the target protein.
6 Cell and lysate clarification
6.2
Membrane and cartridge selection
For cell and lysate clarification, microfiltration membranes will easily retain all cells and cell debris. The key to selection is based on passage of the target molecule rather than retention of unwanted components.
Membrane selection
Smaller pore size filters resist fouling more than filters with larger pore sizes. A general guideline is to select the smallest pore size ratings that is at least 10× larger than the size of the target protein in it largest state or longest dimension.
For clarification of mammalian cell cultures, microfilters (pore size 0.2 to 0.65 µm) are generally suitable. Clarfication of bacterial cultures typically use ultrafilters with NMWC 500 or 750 kD. Both 750 kD ultrafilters and 0.1 µm microfilters have been found suitable for yeast cultures.
When working with lysates, which can contain a wide range of particle sizes and many types of proteins and sticky cell components, choosing a small pore size can help prevent fouling of the membrane pores.
Table 6.1 presents typical cartridge and membrane characteristics for common clarifica-tion applicaclarifica-tions.
Cartridge selection
The presence of particles in the feed stream requires the selection of short path length cartridges (30 to 60 cm) with large lumen diameters (0.75 to 1.0 mm). See Table 6.1 for cartridge specifications.
Table 6.1: Recommended cartridges for cell culture and lysate clarification.
Nominal pore size/NMWC Fiber lumen diameter (mm) Path length (cm) Suspended solids/viscosity Clarification type 0.2 µm 0.45 µm 0.65 µm 1.0 30 or 60 Low to moderate
Monoclonal antibody from hybridoma cell culture
0.65 µm 0.75
30 Low
Clarification of adenovirus from 293 cell culture
0.1 µm 500 kD 1.0 30 or 60 High Clarification of protein (<60 kD) from E. coli whole