www.rsc.org/
advances
RSC Advances
This is an
Accepted Manuscript
, which has been through the
Royal Society of Chemistry peer review process and has been
accepted for publication.
Accepted Manuscripts
are published online shortly after
acceptance, before technical editing, formatting and proof reading.
Using this free service, authors can make their results available
to the community, in citable form, before we publish the edited
article. This
Accepted Manuscript
will be replaced by the edited,
formatted and paginated article as soon as this is available.
You can find more information about
Accepted Manuscripts
in the
Information for Authors
.
Please note that technical editing may introduce minor changes
to the text and/or graphics, which may alter content. The journal’s
standard
Terms & Conditions
and the
Ethical guidelines
still
apply. In no event shall the Royal Society of Chemistry be held
responsible for any errors or omissions in this
Accepted Manuscript
or any consequences arising from the use of any information it
contains.
Cite this: DOI: 10.1039/c0xx00000x
www.rsc.org/xxxxxx
ARTICLE TYPE
Rodamine-based lysosome-targeted fluorescence probes: high pH
sensitivity and their imaging application in living cells†
Kang-Kang Yu,
aKun Li,*
a,bJi-Ting Hou,
aHui-Huan Qin,
aYong-Mei Xie,
bChen-Hui Qian
aand Xiao-Qi
Yu*
aReceived (in XXX, XXX) Xth XXXXXXXXX 20XX, Accepted Xth XXXXXXXXX 20XX 5
DOI: 10.1039/b000000x
Two rhodamine-based pH probes (RhP and RhPA) were synthesized via click reaction. The probes exhibited high pH sensitivity and selectivity with significant fluorescence intensity enhancement. Cell imaging experiments 10
demonstrated RhPA was a good lysosomes targeting probe in living cells with low cytotoxicity and excellent photostability. In recent years, owing to the abnormal changes of cells may cause various disease, researchers are becoming more concerned about the health state and death of living cells. As far as we know, 15
there are plenty of ways to defined cell death, take practical microscopy approach for instance,1 including: membrane
integrity detection by DNA intercalating probes, protein expression by GFP (Green Fluorescent Protein), dielectric measurements and intracellular pH value measurements.2,3
20
Among others, intracellular pH value is widely used as an indicator for the general health of cells, and it really plays an important role in cells, such as enzyme and tissue activities, cell growth (including proliferation and apoptosis), endocytosis, multidrug resistance, calcium regulation (ion transport) and other 25
cellular processes.4-9 The pH value of certain tumor tissues and
organs (pH 6.0 - 6.5) possess lower compared to normal ones (pH 7.2-7.4).10,11 Moreover, at the cellular level, proton concentrations
are not uniformly distributed: the cytoplasma is slightly alkaline (pH ~7.2), whereas the pH value of some intracellular organelles 30
(lysosomes, endosomes and autophagosome) is in the range of 4.0 - 6.0.6,12-19 As the endpoint of the endocytic pathway,
Lysosomes were found to be linked with the three major morphologically distinct pathways of cell death: apoptosis, type II programmed cell death and necrosis.20, 21 Hence, the study of
35
sensing intracellular weakly acidic pH value, especially in lysosomes, has attracted increasing attention of researchers.
Recently, some fluorescent indicators have been developed to measure pH changes of environment or in living cells,5, 9 but only
a few of them are suitable for pH detection in weakly acidic 40
environments, and most of them exhibited poor membrane permeability and bad water solubility. Therefore, designing pH fluorescent probes with weakly acidic pKa and excellent
membrane permeability are still desirable. Considering that fluorescent dyes could be used for visual imaging, we intend to 45
choose a suitable dye and prepare some lysosome-targeted pH probes. According to previous studies of other researchers, rhodamine dyes not only have excellent photostability,
photophysical properties and suitable water-solubility, but also have the potential for targeting lysosomes without introducing 50
any other lysosome-located groups.15, 22-26 Since the cyclisation
equilibrium in rhodamine derivates were widely used,27, 28 we
believe that probes based on rhodamine dyes are still of high interest, particularly for pH sensing.10, 29-31
55
Scheme 1 Synthesis of RhP and RhPA
Scheme 2 The spirolactam ring-opening mechanism of RhP and RhPA Herein, two rhodamine B based probes were synthesized via
click reaction (Scheme 1). 1,2,3-triazole was introduced as an 60
ideal bridge to improve the biocompatibility as well as water-solubility,32 moreover to avoid “alkalizing effect” we adopted
benzene rather than any other aliphatic amines33. The pH
sensitive spirolactam structure of probes (RhP and RhPA) remains closed and non-fluorescent in the neutral environment; 65
whereas weakly acidic condition leads to the ring-opening of spirolactam and the probes exhibit strong emission spectra (Scheme 2). In addition, the difference between RhP and RhPA is that RhPA comprises one more amide bond, which might serve as additional protonate groups under acid conditions. The 70
structures of probes and intermediates were confirmed by 1H
RSC
Advances
Accepted
2 | Journal Name, [year], [vol], 00–00 This journal is © The Royal Society of Chemistry [year] NMR, 13C NMR and ESI-MS.
Fig. 1 A) Fluorescence spectral changes of RhP (5 μM ) in B-R buffer
5
solution at different pH values ( λex = 540 nm), and maximum emission intensity was measured at 583 nm. Inset: Plot of the emission fluorescence intensity at 583 nm. pH 3.60, 4.00, 4.19, 4.40, 4.62, 4.80, 5.01, 5.21, 5.41, 5.59, 5.82, 6.00, 6.21, 6.42, 7.01, 7.61. B) Fluorescence spectral changes of RhPA (5 μM ) in B-R buffer solution at different pH 10
values ( λex = 540 nm), and maximum emission intensity was measured at 583 nm. Inset: Plot of the emission fluorescence intensity at 583 nm. pH 3.60, 4.00, 4.19, 4.40, 4.62, 4.80, 5.01, 5.21, 5.41, 5.59, 5.82, 6.00,
6.21, 6.42, 7.01, 7.61, 8.05.
With the targeted probes in hand, we firstly investigated the 15
fluorescent response of RhP and RhPA (5 μM ) to pH at room temperature, and Britton-Robinson buffer solution is used for turning pH values. As shown in Fig. 1, when exciting RhP and RhPA at 540 nm, non-fluorescent were found under neutral condition, while with the pH decreasing, the fluorescent intensity 20
of the two probes increased significantly at 583 nm. RhP increased about 35 fold from pH 7.6 to 4.0 (Fig. 1A), and the quantum yield increased from 0.01 to 0.16; while RhPA increased about 75 fold from pH 8.0 to 4.4 (Fig. 1 B), and the quantum yield increased from 0.03 to 0.45. The results were 25
definite attribute to the transformation of the ring-opened tautomer of the rhodamine fluorophore. According to the pH titration, the highly sensitive pH range of RhP and RhPA could be found to be from 4.0 to 6.0 and from 4.4 to 6.5, respectively. Moreover, the pKa values of the two probes were calculated as
30
4.79 for RhP and 5.23 for RhPA (via the
Henderson-Hasselbach-type mass action equation,34 as shown in Figure S1 and Figure S2). The weak acidic pKa was exactly suitable for the application
of imaging of lysosomes (intracellular acidic organelles) in living cells.
35
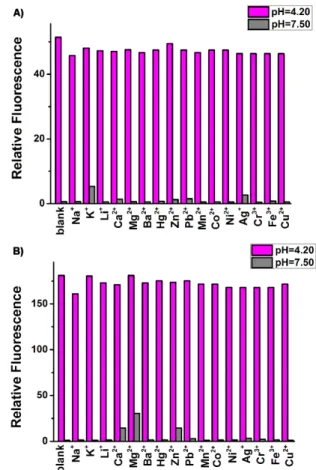
Fig. 2 A) Pink bars: Fluorescence response of RhP (5 μM) at 583 nm toward other competitive ions in B-R buffer solution (pH 4.20). Grey bars:
selectivity of RhP (5 μM) for pH at 583 nm toward other selected 40
interferences in B-R buffer solution (pH 7.50). B) Pink bars: Fluorescence response of RhPA (5 μM) at 583 nm toward other competitive ions in
B-R buffer solution (pH 4.20). Grey bars: selectivity of RhPA (5 μM) for
pH at 583 nm toward other selected interferences in B-R buffer solution (pH 7.50). Na+: 150 mM; K+: 75 mM; Mg2+, Ca2+, Zn2+: 5 mM; other ions: 45
0.1 mM.
Subsequently, to further verify the selectivity and anti-interference of our probes, we examined the fluorescent response of RhP and RhPA for H+ in the presence of other cations at
different pH. As shown in Fig. 2, at pH = 7.50, with the addition 50
of Na+ (150 mM), K+(75 mM), Li+, which are plentiful in living
cells; heavy and transition- metal cations such as Hg2+ , Pb2+,
Mn2+, Co2+, Ni2+, Ag+, Cr3+, Fe3+, Cu2+, no fluorescence
enhancement were found for RhP and RhPA. Mg2+, Ca2+, Zn2+
(5 mM) led to feeblish fluorescence enhancement of RhPA, 55
however the concentration of Mg2+, Ca2+, Zn2+ in
vivo was much
lower than 5 mM, thus the effect of these ions could be neglected. Meanwhile, the influence of these metal cations was also studied at pH = 4.20, and the fluorescence intensity of RhP and RhPA in the presence of these cations were almost the same as the 60
intensity at pH = 4.20. These results demonstrated that RhP and RhPA had high specific fluorescent response to acidic pH without any effects of the complicated intracellular condition and were suitable for imaging of living cells. Additionally, the reversibility of the sensor was also of great importance to the 65
practical application, so we detected the reversible transformation
Page 2 of 5
RSC Advances
RSC
Advances
Accepted
Manuscript
of our probes by pH titration. As shown in Fig. 3, an apparent decline of the fluorescence intensity of the two probes were found with the addition of OH- (NaOH), when H+ (HCl) was added to
the solution and the pH value transferred to the original value again, the fluorescence intensity of the two probes was also 5
recovered. This circulation could be repeated for at least ten times, and the reversible pH response would also be benefit for fluorescent intracellular pH imaging.
10
Fig. 3 A) pH reversibility research of RhP (5 μM) between pH ~4.30 and ~10.40. B) pH reversibility research of RhPA (5 μM) between pH ~4.20
and ~10.40.
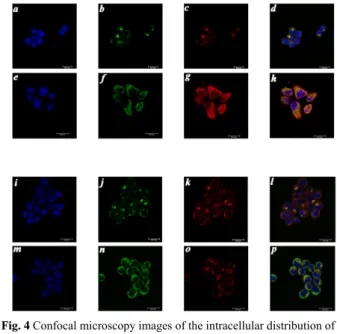
Fig. 4 Confocal microscopy images of the intracellular distribution of 15
lysosomes (incubation 30 min). a ~ d: Hela cells was stained with one drop NucBlue (blue channel), 1 μM LysoTracker Green (green channel) and 5 μM RhP (red channel). e ~ h: Hela cells was stained with one drop
NucBlue (blue channel), 1 μM MitoTracker Green (green channel) and 5
μM RhP (red channel). i ~ l: Hela cells was stained with one drop
20
NucBlue (blue channel), 1 μM LysoTracker Green (green channel) and 5
μM RhPA (red channel). m ~ p: Hela cells was stained with one drop
NucBlue (blue channel), 1 μM MitoTracker Green (green channel) and 5
μM RhPA (red channel). Blue channel: λex = 405 nm, λem = 420 ~ 470 nm;
green channel: λex = 488 nm, λem = 500 ~ 540 nm; red channel: λex = 552 25
nm, λem = 565 ~ 620nm.
Finally, RhP and RhPA were applied to imaging and sensing of the pH in living cells (Hela cells) by confocal laser scanning microscopy analysis. To determine the distribution of the probes in living cells, Hela cells were co-stained with commercially 30
available nucleus-specific, lysosome-specific and mitochondrion-specific staining probes, NucBlue® Live Cell Stain (one drop per milliliter), LysoTracker Green DND-26 (1 μM) and MitoTracker Green FM (1 μM). As shown in Fig. 4, the bright red emission which mainly distributed in cytoplasm indicating that RhP and 35
RhPA could get into cells (Fig. 4 c, g, k and o). More interestingly, we noticed that the subcellular regions stained with RhP not only matched those stained with LysoTracker Green very well, but also matched well with MitoTracker Green staining (Fig. 4 d and h), and the subcellular regions stained with RhPA 40
only matched well with LysoTracker Green staining (especially contrast l with p of Fig. 4). These preliminary results proved that RhP and RhPA had different locations in living cells.
Fig. 5 a ~ d:confocal microscopy images of Hela cells co-stained with
45
RhP (5 μM), LysoTracker Green ( 1 μM ) and NucBlue (one drop). e ~ i: confocal microscopy images of Hela cells co-stained with with RhP (5
μM), MitoTracker Green ( 1 μM ) and NucBlue (one drop). i ~ l:confocal microscopy images of Hela cells co-stained with RhPA (5 μM), LysoTracker Green ( 1 μM ) and NucBlue (one drop). m ~ p: confocal
50
microscopy images of Hela cells co-stained with with RhPA (5 μM),
MitoTracker Green ( 1 μM ) and NucBlue (one drop). A) ~ D): Intensity profile of regions of interest (ROI) across Hela cells(green line – green
channel, red line – red channel)
Furthermore, in order to substantiate whether only RhPA 55
really could be used for lysosome (acidic compartment) specific staining, a qualitative co-localization index was measured by choosing a Region of Interest (ROI) in one cell. As Fig. 5 illustrated, the green line means the signal of LysoTracker Green and MitoTracker Green from the region we chose and the red line 60
represents the signal of RhP or RhPA from the same region. The two coordinate graphs A) and B) of RhP in Fig. 5 elucidate that no matter the green line or the red line the peaks were all in the
RSC
Advances
Accepted
4 | Journal Name, [year], [vol], 00–00 This journal is © The Royal Society of Chemistry [year] same position, suggesting that this probe not only located in
lysosomes, but also existed in mitochondria. The other two coordinate graphs C) and D) of in Fig. 5 illustrated that RhPA only co-stained with LysoTracker Green (the peaks of the green line and the red line were in the same position). However, 5
although the signal from cells which co-stained with MitoTracker Green were in the same position, it is obvious that RhPA had strong signal intensity while MitoTracker Green exhibited weak signal intensity.
10
Fig. 6 Cytotoxicity of LysoTracker Green, MitoTracker Green, RhP and
RhPA on Hela cells. The concentration of LysoTracker Green and
MitoTracker Green: 0 μM, 0.156 μM, 0.312 μM, 0.625 μM, 1.250 μM, 2.500 μM, 5.000 μM (from left to right). The concentration of RhP and
RhPA: 0 μM, 0.625 μM, 1.250 μM, 2.500 μM, 5.000 μM, 10.000 μM,
15
20.000 μM, 40.000 μM (from left to right).
Besides intracellular pH imaging, the cytotoxicities of RhP, RhPA and the two commercial dyes (LysoTracker Green and MitoTracker Green) were also detected. As illustrated in Fig. 6, no obvious toxicities were found for RhP in cells even at the 20
concentration of 40 μM, and no obvious toxicities were found for RhPA at the concentration of 10 μM. However, the two commercial dyes were more toxic. These results suggested that compared with the two commercial dyes, our probes were much less toxic, it also suggested that our probes were more beneficial 25
for biological applications.
Conclusions
In summary, two rhodamine-based pH-sensitive probes have prepared via click reaction. They both have excellent selectivity
and sensitivity in aqueous solution, moreover metal cations have 30
no significant interference on pH sensing and the two probes were fully reversible mainly within the pH range from 4.2 to 10.4. RhP and RhPA exbibited low cytotoxicities and excellent photostability. The confocal co-localization imaging experiment of the two probes indicated that RhP and RhPA had good 35
biocompatibility, and suitable for detecting the acidic region of living cells. Especially, RhPA could be successfully used for lysosomes targeting.
This work was financially supported by the National Program on Key Basic Research Project of China (973 Program, 40
2012CB720603 and 2013CB328900), the National Science
Foundation of China (Nos. 21232005, 21321061, J1310008 and J1103315), and the Specialized Research Fund for the Doctoral Program of Higher Education in China (20120181130006). We also thank the Analytical & Testing Center of Sichuan University 45
for NMR analysis.
Notes and references
aKey Laboratory of Green Chemistry and Technology, Ministry of
Education, College of Chemistry, Sichuan University, Chengdu, 610064, P. R. China.Fax: (0)86-28-85415886
50
E-mail addresses: [email protected]; [email protected]
b State Key Laboratory of Biotherapy, West China Hospital, West China
Medical School, Sichuan University, Chengdu 610041, China
†Electronic Supplementary Information (ESI) available: [spectra of target probes and intermediates, detail experimental procedures]. See
55
DOI: 10.1039/b000000x/
1 C. Fink, F. Morgan and L. M. Loew, Biophys. J., 1998, 75, 1648– 1658.
2 T. Aabo, J. Gluckstad, H. Siegumfeldt and N. Arneborg, J. R. Soc. Interface, 2011, 8, 1635-1643.
60
3 P. Patel and G. H. Markx, Enzyme. Microb. Tech., 2008, 43, 463-470.
4 Z. Diwu, C. S. Chen, C. Zhang, D. H. Klaubert and R. P. Haugland,
Chem. Biol., 1999, 6, 411-418.
5 J. Han and K. Burgess, Chem. Rev. , 2010, 110, 2709-2728.
6 J. R. Casey, S. Grinstein and J. Orlowski, Nat. Rev. Mol. Cell Biol.,
65
2009, 11, 50-61.
7 M. Tantama, Y. P. Hung and G. Yellen, J. Am. Chem. Soc., 2011, 133, 10034-10037.
8 S. Chang, X. Wu, Y. Li, D. Niu, Y. Gao, Z. Ma, J. Gu, W. Zhao, W. Zhu, H. Tian and J. Shi, Biomaterials, 2013, 34, 10182-10190. 70
9 R. Wang, C. Yu, F. Yu and L. Chen, Trac-Trend Anal. Chem., 2010, 29, 1004-1013.
10 J. Hu, X. Zhang, D. Wang, X. Hu, T. Liu, G. Zhang and S. Liu, J. Mater. Chem., 2011, 21, 19030.
11 X. Wan and S. Liu, J. Mater. Chem., 2011, 21, 10321. 75
12 M. I. Burguete, F. Galindo, M. A. Izquierdo, J. E. O'Connor, G. Herrera, S. V. Luis and L. Vigara, Eur. J. Org. Chem., 2010, 2010,
5967-5979.
13 Z. Li, S. Wu, J. Han and S. Han, Analyst, 2011, 136, 3698.
14 H. Zhu, J. Fan, Q. Xu, H. Li, J. Wang, P. Gao and X. Peng, Chem.
80
Commun., 2012, 48, 11766.
15 H. Lv, S. Huang, B. Zhao and J. Miao, Anal. Chim. Acta., 2013, 788,
177-182.
16 F. Miao, G. Song, Y. Sun, Y. Liu, F. Guo, W. Zhang, M. Tian and X. Yu, Biosens. Bioelectron., 2013, 50, 42-49.
85
17 G. Li, D. Zhu, L. Xue and H. Jiang, Org. Lett., 2013, 15, 5020–5023.
18 L. Q. Ying and B. P. Branchaud, Bioorg. Med. Chem. Lett., 2011, 21,
3546-3549.
19 P. Song, X. Chen, Y. Xiang, L. Huang, Z. Zhou, R. Wei and A. Tong,
J. Mater. Chem., 2011, 21, 13470. 90
20 J. Stinchcombe, G. Bossi and G. M. Griffiths, Science, 2004, 305.
21 B. Turk and V. Turk, J. Biol. Chem., 2009, 284, 21783-21787.
22 Z. Li, Y. Song, Y. Yang, L. Yang, X. Huang, J. Han and S. Han,
Cheml. Sci., 2012, 3, 2941.
23 X. Wang, R. J. Meier and O. S. Wolfbeis, Angew. Chem. Int. Ed. ,
95
2013, 52, 406-409.
24 M. H. Lee, J. H. Han, J. H. Lee, N. Park, R. Kumar, C. Kang and J. S. Kim, Angew. Chem. Int. Ed. , 2013, 52, 6206-6209.
Page 4 of 5
RSC Advances
RSC
Advances
Accepted
Manuscript
25 J. Fan, C. Lin, H. Li, P. Zhan, J. Wang, S. Cui, M. Hu, G. Cheng and X. Peng, Dyes Pigments, 2013, 99, 620-626.
26 X. Wu, Y. Tian, M. Yu, J. Han and S. Han, Biomaterials Science,
2014.
27 H. N. Kim, M. H. Lee, H. J. Kim, J. S. Kim and J. Yoon, Chem. Soc.
5
Rev., 2008, 37, 1465.
28 M. Beija, C. A. M. Afonso and J. M. G. Martinho, Chem. Soc. Rev.,
2009, 38, 2410.
29 X. Wang, J. A. Stolwijk, T. Lang, M. Sperber, R. J. Meier, J. Wegener and O.S. Wolfbeis, J. Am. Chem. Soc., 2012, 134, 17011-10
17014.
30 H. Sun, K. Almdal and T. L. Andresen, Chem. Commun., 2011, 47,
5268.
31 W. Zhang, B. Tang, X. Liu, Y. Liu, K. Xu, J. Ma, L. Tong and G. Yang, Analyst, 2009, 134, 367.
15
32 S. K. Mamidyala and M. G. Finn, Chem. Soc. Rev., 2010, 39, 1252.
33 H. S. Lv, J. Liu, B. X. Zhao, J. Y. Miao, Sensor. Actust. B,
2013,177,956-963.
34 M. Tian, X. Peng, J. Fan, J. Wang and S. Sun, Dyes Pigments, 2012, 95, 112-115. 20