STATE-OF-CHARGE MONITORING AND ELECTROLYTE
REBALANCING METHODS FOR THE VANADIUM REDOX
FLOW BATTERY
Sara Corcuera
[a]and Maria Skyllas-Kazacos
[a]*
Keywords: vanadium redox flow battery; state-of-charge monitor; capacity loss; cell rebalancing
A major issue with all flow batteries is the control of the imbalance between the two half-cell electrolytes that arises as a result of the differential transfer of ions across the membrane and the inevitable gassing side reactions that can occur during charging. While a number of methods are available to rebalance electrolyte state of charge and restore capacity, reliable methods are needed to monitor the state-of-charge of each individual half-cell solution in order to determine the appropriate action to be taken by the battery control system. In this study different methods of state-of-charge monitoring have been considered for application in the All-Vanadium Redox Flow Battery (VRB). Half-cell potentials and electrolyte conductivities were calibrated as a function of state-of-charge and evaluated for state-of-charge monitoring of individual half-cell electrolytes for the purpose of capacity restoration and control. An empirical model based on experimental conductivity data has been shown to provide accurate predictions, with an average error of 0.77%, of the conductivity of the positive half-cell electrolyte as a potential state-of-charge detection tool. Separate monitoring of the two half-cell electrolyte potentials has also been used to determine the state-of-charge of each half-cell solution in order to detect system imbalance. This was used in small laboratory cell tests to determine necessary actions to restore capacity by either remixing the two solutions, or by using chemical rebalancing methods, depending on the cause of the solution imbalance.
Corresponding Authors
E-Mail: [email protected]
[a] School of Chemical Engineering,
University of New South Wales,
Sydney, New South Wales, 2052, AUSTRALIA
Introduction
Redox flow batteries are a form of energy storage currently receiving considerable attention owing to their favourable properties. The main benefits that make these batteries such a viable alternative are their long operating life and the fact that the power and energy rating can be independently varied to meet the requirements of different applications. Additionally, they have the potential to offer very low capital and operating costs compared with other energy storage technologies for applications requiring more than 4 hours of storage.
The Vanadium Redox Battery (VRB), pioneeredat the University of New South Wales (Australia) in the early 80’s, employs V(II)/V(III) and V(IV)/V(V) redox couples in sulphuric acid as the negative and positive half-cell
electrolytes respectively.1-5 In contrast to other redox flow
batteries, the VRB makes use of the same elements in both
half-cell solutions, eliminating cross contamination
problems. The VRB also shows high energy efficiency of over 80%, very low maintenance costs and an indefinite
electrolyte life.3
Apart from the simplified set of half-cell reactions displayed below
Positive half-cell:
VO2+ + 2H+ + e- = VO2+ + H2O (1)
Negative half-cell:
V3+ + e- = V2+ (2)
Other relevant side reactions take place within the cell which lead to imbalance and loss of capacity. Firstly, the differential rates of diffusion of vanadium ions across the cell membrane will lead to a build-up of vanadium ions in
one half-cell and a depletion in the other,6 leading to
capacity loss. This is further exacerbated by water and solution transfer from one half-cell to the other, the direction and magnitude of which depends on the type of membrane used. While these processes can be reversed and capacity resorted by simply remixing the two half-cell solutions periodically, other side reactions can occur that cannot be reversed by remixing. These include hydrogen evolution at the negative electrode and to a lesser extent, the evolution of
oxygen at the positive electrode during charging.7
The higher rate of hydrogen evolution at the negative electrode will inevitably lead to an imbalance between the oxidation states of the two solutions since a portion of the current is consumed by hydrogen ion reduction rather than the V(III) oxidation reaction. Furthermore, when the system is not perfectly sealed, the oxidation of V(II) to V(III) in the negative half-cell solution will also reduce the V(II):V(V) ratio in the two electrolytes, causing a further loss in capacity that requires chemical or electrochemical rebalancing for capacity restoration.
Taking into account the effect of these side reactions, it becomes essential to provide a method for accurately determining the state of charge (SOC) of each individual half-cell solution of a redox flow cell during charge-discharge operation. Different alternatives have been considered including the use of the variation in solution
absorbance as a function of state-of-charge.2 The
A very common method for measuring the SOC of a redox flow cell is the installation of open-circuit cell at the entry or exit ports of the electrolytes in the cell stack. By using the Nernst equation, the SOC can be readily obtained from the measured open circuit voltage (OCV). However, as the OCV gives an overall value of the two half-cells, it is assumed that the two half-cells are balanced. Thus, whenever the system becomes unbalanced, this procedure would not accurately indicate the SOC, since it is not possible to determine the imbalance from the cell open circuit potential. Ideally, a method that allows independent monitoring of each half-cell electrolyte should be employed so as to achieve both the determination of the system balance and the state of charge.
In this study, different alternatives have been evaluated for this purpose. Earlier studies showed that the conductivity of both the positive and negative half-cell electrolytes varies in
a linear manner as a function of state-of-charge.2
Conductivity measurement was thus selected as a possible technique for use in the development of a SOC monitoring system for the VRB. In addition, the use of an indicator and reference electrode to measure the potential of each of the half-cell electrolytes was also evaluated to determine the suitability of this approach for SOC monitoring during charge-discharge cycling.
Initial experiments were conducted to first calibrate both conductivities and solution potentials as a function of SOC for commonly used VRB electrolyte compositions. The potentiometric method was further evaluated during a series of charge-discharge experiments to monitor any imbalance arising between the two half-cell solutions during continuous cycling. Once imbalances in the system can be determined, both chemical and electrochemical rebalancing measures can be introduced to ensure the optimum performance of the whole battery. In the present study, a chemical reductant was added to the positive half-cell electrolyte in order to balance the oxidation states of the two half-cell solutions and thereby restore capacity. Such a technique could be readily integrated into a battery management and control system along with other sensors, in order to instigate appropriate actions such as automated electrolyte remixing and rebalancing procedures that would be able to maintain optimal condition of the VRB during
extended operation with minimal human interaction.9
Experimental
Two solutions were first prepared with compositions of 1.6 M vanadium in sulphuric acid supporting electrolytes with total sulphate levels of 4 M and 4.2 M. These solutions
were prepared by mixing V2O3 and V2O5 powders in the
required ratio in order to produce a 50:50 mixture of V(III) and V(IV), referred to as V(3.5+). Inductively Coupled Plasma (ICP) analysis was performed to verify the concentrations of both V and S in the final solutions and adjustments were made as required.
The V(3.5+) solution was subsequently placed in a flow cell and fully charged to 2.4 V so as to obtain a yellow V(V) solution in the positive half-cell and a violet V(II) solution in the negative half-cell, corresponding to the desired 100% SOC catholyte and anolyte solutions
in the appropriate ratios to obtain the V(III) and V(IV) oxidation states. The four solutions were subsequently used to produce a series of solutions with different oxidation states corresponding to states-of-charge of 0%, 5%,10%, 25%, 50%, 75%, 90%, 95% and 100% for both the positive and negative half-cells. Argon was used for sealing the containers to ensure that no air oxidation occurred during storage. Conductivity measurements were taken at three different temperatures : room temperature (25ºC), 10ºC and 40ºC. The sample solutions were allowed to equilibrate in a water bath set at 10 and 40oC with a temperature deviation
of
1
º
C
. In the case of the room temperaturemeasurements, since the tests took place over a few different days, some variation in room temperature contributed to a discrepancy in the temperature ranges for the negative and positive half-cell electrolytes samples. The equipment used for the conductivity measures was a SCHOTT Conductivity Meter CG-856 with SCHOTT Instruments Electrode LF-613T. It has to be noted that a previous calibration was done using a KCl 0.01M solution to fix the cell constant and the temperature compensation, activated by default, was defused.
For the potentiometric measurements, a carbon rod (indicator electrode) and a saturated calomel electrode (SCE) were immersed in each of the two half-cell electrolyte reservoirs of a flow cell containing the vanadium electrolyte to be used in the calibration. The electrodes were then connected to two separate digital multimeters and the measured solution potential values were automatically recorded in two separate text files. Around 70ml of the1.6M V solution was placed in each half-cell reservoir and the cell was fully charged at a constant current of 1 A to an upper voltage limit of 2.4V until the distinctive violet (V(II)) and yellow (V(V)) colours were observed in the
negative and positive half-cell solution reservoirs
respectively. The cell was then cycled between 0.8 and 1.8 V. In order to magnify the effects of air oxidation of V(II) on capacity loss, no effort was made to seal the negative half-cell reservoir, nor was any inert gas used to blanket the V(II) solution during cycling.
During charge-discharge cycling of the cell, half-cell potential values were monitored and the values converted to half-cell solution SOC values using the Nernst Equation. Once a substantial capacity loss was observed, different measures were employed to try to rebalance the electrolytes and restore capacity. These involved (i) remixing the two half-cell solutions and (ii) adding a fixed volume of a proprietary chemical reductant to the positive half-cell solution to determine the cause of the capacity loss and to restore capacity as appropriate.
Results and discussion
Electrolyte conductivity as a function of state of charge
Previous studies with 2 M vanadium electrolytes8 have
In this study, the total concentration of vanadium was fixed at 1.6M (being a commonly used composition for VRB systems)while the SOC and temperature were varied in order to reproduce an empirical model which could be employed in aVRB control system for SOC monitoring and electrolyte maintenance.
Tables 1 and 2 summarise the conductivity values obtained at the three different temperatures for the positive and negative half-cell solutions respectively at different SOCs.
Table 1. Conductivities of 1.6 M V solutions in 4.2 M total sulphate corresponding to different states-of-charge of the VRB positive half-cell electrolyte
Positive half cell
room temp. hot bath ice bath SOC T,ºC k,
mS cm-1
T,ºC k, mS cm-1
T,ºC k, mS cm-1
100% 22.3 410 11 338
95% 22.3 401 10.8 328
90% 22.5 401 10.6 321
75% 22.3 375 10.6 302
50% 22.2 345 42.7 465 10.5 277
25% 22.2 308 42.8 411 10.5 248
10% 22.2 293 43.5 403 10.5 234
5%
0% 22.4 275 43.6 374 10.7 222
Table 2. Conductivities of 1.6 M V solutions in 4.2 M total sulphate corresponding to different states-of-charge of the VRB negative half-cell electrolyte
Negative half cell
room temp. hot bath ice bath
SOC T,ºC k, mS cm-1
T,ºC k, mS cm-1
T,ºC k, mS cm-1
100 %
95% 22.2 250 44 321 10 197
90% 22.3 241 44.6 321 10 190
75% 22.3 237 44.8 311 9.7 186
50% 22.4 215 44.5 282 9.5 169
25% 22.3 190 44.7 264 9.6 149
10% 22.3 181 44.8 252 9.5 142
5% 22.3 181 44.5 254 9.2 141
0% 22.3 183 44 238 9.1 146
The above data was used to develop an empirical model based on the linearity of the electrolyte conductivity (k) with the state of charge of both the negative and positive half-cell
electrolytes. In addition to SOC, temperature (T) is also
introduced as a variable.
Briefly, the following equations are the basis of the model:
( ) * ( ) a T SOC b T
(3)
where
1 2
( ) *
a T a Ta (4)
1 2
( ) *
b T b Tb (5)
(A T B) SOC (C T D)
(6)
where k is the solution conductivity in mS cm-1, T is the
temperature and A, B, C and D are empirical coefficients
that are determined by fitting the experimental data to the model. Table 3 presents the model coefficients for both the positive and negative half-cell solution conductivities.
Table 3. Conductivity model coefficients
Positive half-cell electrolyte
Negative half-cell electrolyte
A 1.8000 0.7050
B 93.5030 55.0420
C 4.6713 2.6176
D 172.07 122.37
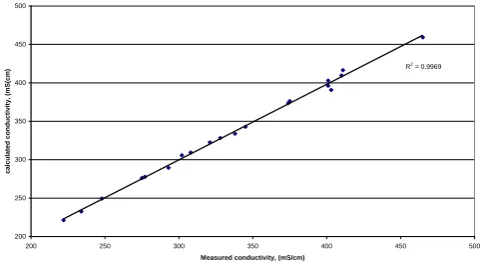
In order to test the accuracy of the empirical model, calculated conductivity values were compared with experimental values as illustrated in Figures1 and 2.The good correlation shows that the empirical model should provide an accurate prediction of the conductivities of the vanadium electrolytes over the SOC range 0 to 100 % and
temperature range 10 to 40 oC for the solution composition
used in this study.
Figure 1. Correlation measure vs. calculated positive half-cell electrolytes conductivity
Figure 2. Correlation measure vs. calculated negative half-cell electrolytes conductivity
Correlation measure vs calculated positive half-cell electrolytes conductivity
R2
= 0.9969
200 250 300 350 400 450 500
200 250 300 350 400 450 500
Measured conductivity, (mS/cm)
ca
lculated
con
d
u
ctivit
y,
(mS(cm
)
Correlation measure vs calculated negative half-cell electrolytes conductivity
R2 = 0.9714
125 175 225 275 325 375
125 175 225 275 325 375
Measured conductivity, (mS/cm)
ca
lculated
con
d
u
ctivit
y,
(mS(cm
The above results thus suggest that the solution state of charge for each half-cell electrolyte could be directly indicated by simply measuring the conductivity of each solution provided that no changes in the total vanadium and
total sulphate concentrations occur during battery
operation.It has previously been shown however, that diffusion processes across the cell membrane will give rise to a transfer of each of these ions from one half-cell to the other, leading to a build-up in one half-cell and a dilution in
the other.8 These processes will have a significant effect on
solution conductivity that will not be predicted by the empirical model and will give an erroneous value of SOC. By regularly remixing the two half-cell solutions however, solution composition could be restored, so that recalibration of the SOC monitor would be possible. A second independent monitoring method would therefore be needed for calibration purposes in order to provide the most accurate measure of SOC.
Half-cell solution potentials as a function of state of charge
As previously mentioned, the continuous independent measurement of the potential of each half-cell solution could provide a relatively accurate quantitative measure of the state-of-charge of each half-cell and give an additional indication of any imbalance arising as a result of side reactions during operation of the VRB.
The Nernst potentials for the two reduction reactions (Equations 1 and 2) that take place in each half-cell of the VRB can be represented as follows:
Positive half-cell:
Negative half-cell:
where
R (the Universal Gas Constant) = 8.314472
J K−1mol−1
F (Faraday’s constant) = 96485.3399 C mol−1
T temperature, K
[V] are the concentrations of the different vanadium
species in solution
[H+] is the hydrogen-ion concentration in the positive
half-cell electrolyte
Eo+ and Eo- are the standard half-cell potentials for the
positive and negative half-cell reactions,
respectively.
The concentration of the ions that take part in the reactions is directly proportional to the state of charge and the total vanadium concentration of the electrolyte. In the
however, this is more difficult to calculate accurately. A large number of ion pairing equilibria between vanadium ions, sulphate and bisulphate ions in the solutions will also affect the equilibrium proton concentrations and since their
equilibrium constants are not accurately known, the true H+
ion concentration cannot be accurately calculated.
Commonly, the hydrogen ion concentration in the catholyte is considered as 1M so as to eliminate its influence on the Nernst potential. Alternately, many researchers assume that the hydrogen ion concentration remains constant during cell cycling, so that its value can be incorporated into the formal potential that can be experimentally determined for a particular solution composition. In fact, the standard cell potential Eº is often replaced in the Nernst Equation by the formal potential,
which includes corrections to incorporate activity
coefficients of the ions and is the potential that is more readily measured in an electrochemical cell. In this study, both possibilities will be considered in order to develop an empirical relationship between solution potential and SOC.
In order to estimate the formal potential of the positive half-cell electrolyte, the vanadium solution was placed into a flow cell and charged to 100% SOC as evidenced by the distinct yellow colour of the resultant V(V) solution. Assuming that the potential at this point represented a state of charge of 99% (since 100% would correspond to a V(IV) concentration of zero that cannot be used into the Nernst equation), the formal potential, Eº’, was determined from the Nernst Equation as -0.207 V and 1.182 V for the negative and the positive half-cell, respectively. This value was then used as the calibration constant to calculate the SOC values at different times during cycling. In our case, this parameter was defined for the positive half-cell as follows:
where
E0+ standard reduction potential for the positive half-
cell
γx activity coefficient for species x
Assuming that the hydrogen-ion concentrations and the activity coefficients remain constant, it is possible to incorporate these terms into the new formal potential term as follow: 2 º 2 2 [ ] ln (7) [ ][ ] RT VO E E
F VO H
2 º 3 [ ] ln (8) [ ] V RT E E F V 2 2 2 º 2 2 2 [ ] ln (9) [ VO
H VO H
VO RT
E E
F VO c
2 2 2 2 2 º 2 [ ]ln ln [ ]
[ ] (10) ln VO VO H VO H VO RT E E F 2 º 2 [ ]
' ln (11)
2 3
2 º
3
2 º
3
[ ]
ln ln (15)
[ ]
[ ]
' ln (16)
[ ] V
V
RT RT V
E E
F F V
RT V
E E
F V
and since
2
[VO] (1 SOC) [ ]V (12)
2
[VO]SOC V[ ] (13)
where
E0+’ formal potential for the positive half-cell
SOC state of charge (%)
Equation 14 above thus shows that with the use of the formal potential, in which value the hydrogen ion is included, a simple relationship between solution potential and state of charge can be obtained for the positive half-cell.
In a similar way the negative half-cell formal potential was also defined as follows.
Since
where,
E0- standard reduction potential for the negative
half-cell
E0-‘ formal potential for the negative half-cell
The formal cell potential for the VRB can also be calculated using the formal half-cell potentials measured above. Using values of Eº’=1.182V and Eº’=-0.207 for the positive and negative half-cells respectively, a formal cell potential of 1.39 V was calculated for the vanadium cell under the current electrolyte composition. This agrees well with formal cell potential values of 1.4 V (measured from
the open circuit potential at 50% SOC) previously determined in the laboratory with operating cells at 50%
SOC.10
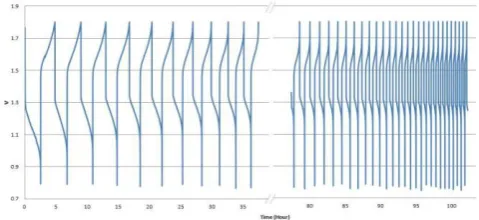
Figure 3. Vanadium redox flow cell voltage vs time over 100 hours cycling (1.8-0.8V) at constant current (1Amp)
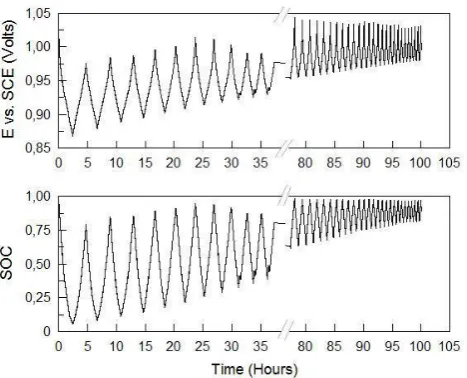
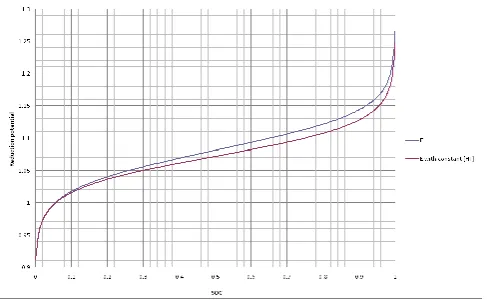
Having calibrated potential as a function of SOC for each half-cell, a small flow cell was subjected to continuous charge-discharge cycling while monitoring the potential of two carbon indicator electrodes vs and SCE reference electrode immersed in each electrolyte reservoir. Figures 3 and 4 depict the cell voltage and charge/discharge current capacity variation during the 100 hour cycling period. A significant drop in capacity is observed and its cause can be understood from Figures 5 and 6 that show the potential values vs. SCE (standard calomel electrode) and SOC for the positive and negative half-cells respectively during the duration of the experiment, around 100 hours and 40 cycles.
Figure4. Charge (blue)/discharge (red) capacity (mAh) vs. cycle number for vanadium cell cycling of Figure 3.
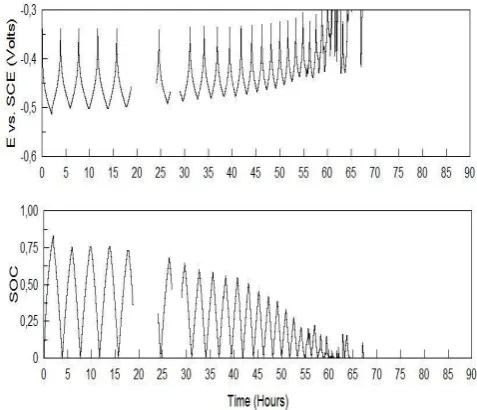
The presented results show very interesting phenomena. Firstly, the SOC limits in the positive half-cell are steadily increasing with each cycle so that after 80 hours, the positive side of the cell is only cycling between 50 and 100% SOC. The reverse is seen in the negative half-cell where the solution is only cycling between 50 and 100% after 80 hours of operation. The SOC imbalance continues further over the next 2 hours until the capacity eventually falls to 250 mAh from the initial 1900 mAh.
State-of-Charge Rebalancing
In order to understand the cause of the above capacity loss and to demonstrate the practical value of the SOC monitor, a series of additional experiments were performed. In the first instance, the solutions from the above cell were remixed to
º 1
' RT ln SOC (14)
E E
F SOC
2
3
º
[ ] [ ] (17)
[ ] (1 ) [ ] (18)
' ln (19)
1
V SOC V
V SOC V
RT SOC
E E
F SOC
see whether the capacity could be restored. In the second instance, chemical rebalance was performed using a proprietary reducing additive and the half-cell potential monitoring was used to observe any changes in the half-cell solution balance.
Figure 5. Positive half-cell potential vs. SCE (V)/SOC vs. time(hour) for vanadium cell cycling of Figure 3
Figure 6. Negative half-cell potentialvs. SCE (V)/SOC vs. time(hour) for vanadium cell cycling of Figure 3
As mentioned previously, capacity loss in all flow batteries will arise as a result of side reactions and the differential transfer of active ions and solution from one half-cell to the other during charge-discharge cycling, this leading to a limiting active material concentration in one half-cell. Capacity losses from solution and ion transfer can be readily restored by simple periodic electrolyte remixing, but this is not the case for losses due to side reactions such as hydrogen evolution and air oxidation in the negative half-cell that requires chemical restoration of the V(II);V(V) ratio in the cell.
Skyllas-Kazacos and co-workers reported 0 that rebalance
in the VRB cells can be obtained by adding certain organic compounds to the positive electrolyte that allow the partial
and ethanol have been suggested to be good rebalancing agents since carbon dioxide and water are the products of the reactions, introducing no impurities in the electrolyte.
This part of the study focusses on the use of the half-cell potential SOC monitoring as part of an electrolyte maintenance regime that would involve a simple electrolyte remixing followed by chemical rebalancing to restore capacity in a redox flow battery. In this study, a proprietary chemical reductant was added to the positive electrolyte of a vanadium redox flow cell in order to equalise the states of charge of both half-cell electrolytes. The electrolyte used in the cell comprised 1.6M vanadium in 4M sulphuric acid, while other parameters were as follows:
Voltage limits: 0.7-1.9V
Current: 1A
As in the earlier experiment, the negative electrolyte reservoir was exposed to atmosphere in order to speed up the air oxidation of the V(II) ions, while a higher voltage limit was used for charging to permit some hydrogen evolution at the negative electrode. The cell was initially subjected to a 100 hour charge-discharge cycling regime during which the capacity decreased from above 2,000 mAh after the first charge cycle to 300 mAh after 50 cycles, representing a loss of 70%. The 2 half-cell electrolytes were then remixed and the cell cycling resumed.
Figure 7 shows the charge-discharge curves obtained after the remix, while the variation in capacity is illustrated in Figure 8.
Figure 7. Charge-discharge curves for cell of Figure 3 after electrolyte remixing
A chemical rebalancing procedure was therefore conducted, this involving the addition of 2 ml of a proprietary chemical reductant to the fully charge positive half-cell electrolyte. The electrolyte was allowed to circulate through the cell stack overnight to allow reaction to occur and cell cycling was resumed using the same conditions as before.
Figure 8. Capacity versus cycle number for cell of Figure 7 after electrolyte remixing.
As seen in Figures 9 and 10, the chemical rebalance had the effect of almost completely restoring the cell capacity to its original value. The slight increase observed during the first few cycles in Figure 10 is due to the on-going chemical reaction by the reductant and the V(V) ions in the positive half-cell electrolyte, this being due to the relatively slow kinetics of the reduction reaction in the solution.
Figure 9. Cell potential vs. time/hour for cell of figure 7 after chemical rebalance.
Figure 10. Charge (blue)/discharge (red) capacity (mAh) vs. cycle number for cell of Figure 9 after chemical rebalance.
As with the previous cycling experiments however, the cell capacity steadily declines as the solutions continue to get out of balance, as illustrated in Figures 11 and 12 that show the changes in state-of-charge ranges for the positive
and negative half-cell electrolytes during cycling
respectively.
Figure 11. Positive half-cell potentialvs. SCE (V)//SOC vs. time for cell of Figure 9.
Figure12. Negative half-cell potential/SOC vs. timefor cell of Figure 9 (irregularities due to equipment connection errors)
Simple electrolyte remixing could not this time restore capacity, but on addition of a further 2ml of reducing agent to the fully charged positive solution, the cell capacity was once again restored to its original value as shown in Figure 13.
exists between the oxidation states of the two half-cells, so independent SOC monitoring is desirable.
Figure 13. Cell capacity versus cycle number after second addition of ethanol. Charge (blue)/discharge (red) capacity (mAh).
In this study the potentials of the two half-cell electrolytes have been applied to the Nernst Equation in order to calculate the SOC of each half-cell. While a distinct trend in SOC is seen as a function of time, this relationship is not linear as would be expected if there were no interferences in the application of the Nernst Equation in the determination of SOC.
Considering separately the displayed SOC vs time plots of Figures 5 and 6 and focusing on the negative half-cell values, a considerably large curvature is observed. This would suggest that two things may be happening during the charge cycle: air oxidation of the V(II) and hydrogen evolution during charging, which gets larger at higher states of charge. Additionally, also at higher SOCs a higher rate of self-discharge would be expected since the rate of self self-discharge is a function of the concentration gradient of the V(II) and V(V) ions across the membrane, which increase at higher SOCs. The above processes do not however explain the curvature observed during the discharge cycle.
Some unusual characteristics are also observed in relation to the curvature in the positive half-cell SOC plots; the curvature is surprising in the lower SOC region. Although the curves in the discharge part are understandable since the rate of self-discharge would be higher at higher SOCs, this would not explain the observed curvature during the charging cycle. One possible explanation for the curvature in the positive half-cell potentials vs. time plots may to be associated with the assumption that the proton concentration remains constant over the entire SOC range. This would affect the theoretical potential calculated from the Nernst Equation and the SOC value thereby determined. Further modelling of the solution potentials was therefore conducted in order the determine any errors introduced by the assumption of constant proton concentration in the Nernst Equation.
Effect of varying hydrogen ion concentration on SOC determination
It is readily seen from the positive half-cell reaction, that protons are produced and consumed during the
charge-balance the charge. While the complex ion equilibria in the electrolyte makes it difficult to determine the precise hydrogen-ion concentration, it is known, it should be possible to estimate changes in the hydrogen-ion concentration with time during charge-discharge cycling of
the VRB. It is known that the H+ quantity in the positive
half-cell electrolyte will increase by 1M when 1M of vanadium V(V) is produced during charging. A direct
relationship should therefore exist between the H+ and V(V)
concentrations in the solution, from which changes in the hydrogen-ion concentration can be obtained. Therefore, at
any state of charge the hydrogen-ion concentration in the
catholyte becomes:
[H+]
x = [H2SO4]0 + [VO2+] (20)
where
[H2SO4]0 is the acid concentration at 0% SOC and
[VO2+] is the concentration of V(V) in the positive
half-cell solution at any time.
But since [VO2+] is directly proportional to SOC,
[H+]
x = [H2SO4]0 + [VT]. SOC (21)
where
[VT] is the total V electrolyte in the solution
Substituting this into the Nernst Equation (Equations 11 and 14) for the reduction potential equation for the positive half-cell,
Assuming values of [H2SO4]o = 4 mol L-1 and [VT]= 1.6
mol L-1, the cell potential vs. SOC plot of Figure 14 is
obtained.
Figure 14. Positive half-cell potential (V) vs. SOC with constant
º
2 2 4 0
1 1
ln
(22) T
RT SOC
E E
F SOC H SO V SOC
As can be seen the difference between both scenarios for the 1.6M V in 4M sulphuric acid solution is considerable, specially, from states-of-charge values above 20%, reaching for the same positive half-cell potential values a SOC difference up to 8%. This would explain some of the curvature observed in the SOC vs time plots presented previously. Despite this curvature however, the independent plots of SOC vs time for each of the two half-cell solutions provides an excellent indication of the imbalance between the two half-cells that gives rise to a loss of capacity with each cycle.
Conclusions
Different methodologies have been discussed on small laboratory scale for obtaining an accurate technique for state-of-charge monitoring. A first method focused on the linear variability of the conductivity of each electrolyte with state of charge that allowed the derivation of an empirical model that could be employed for SOC monitoring and rebalancing in a VRB control system.
Moreover, in order to solve inaccurate predictions of the open circuit voltage, each of the half-cell electrolyte potentials were also monitored and system imbalance was readily detected, allowing the introduction of cell rebalancing measures such as electrolyte remixing or chemical reduction to equalize the state-of-charge levels on both half-cells and thereby restore capacity in an operating VRB system.
References
1Skyllas-Kazacos, M. Robins, R., US 4,786,567; 1986.
2Skyllas-Kazacos, M., Kasherman, D., Hong, R., M. Kazacos, J.
Power Sources, 1991, 35, 399–404.
3Skyllas-Kazacos, M., Chakrabarti, M. H., Hajimolana, S. A.,
Mjalli, F. S., and Saleem, M., Crit. Rev. Electrochem. Solid-State Sci. Technol. J. Electrochem. Soc., 2011, 158(8) R55-R79.
4Skyllas-Kazacos, M. Chapter on “Secondary Batteries: Redox
Flow Battery – Vanadium Redox” in: Encyclopedia of Electrochemical Power Sources, Ed.: J. Garche, P. Moseley, Z. Ogumi, D. Rand & B. Scrosati, Elsevier, 2009, 444-453, 2009.
5Skyllas-Kazacos, M., Chapter on “Energy storage for
stand-alone/hybrid systems: Electro-chemical Energy Storage Technologies”, in: Stand-alone and Hybrid Wind Systems: Technology, Energy Storage and Applications, Ed Kaldellis, J. K., Woodhead Publishing, 2010.
6Skyllas-Kazacos, M., Goh, L., J. Membrane Sci., 2012, 399– 400,
43– 48.
7Tang, A., Skyllas-Kazacos, M., Bao, J., J. Power Sources, 2011,
196, 10737– 10747.
8Skyllas-Kazacos, M. Kazacos, M., J. Power Sources, 2011, 196,
8822– 8827
9Kazacos, C., Kazacos, M., WO 2006/135958 A1.
10Skyllas-Kazacos, M. Kazacos, M. Wegner, R. Burford, R. Lin,
G., Final Report NSW,, Dept. of Minerals & Energy, 1991, pp. 200.