CONCENTRATION OF CADMIUM IN VEGETABLES GROWN
ON CONTAMINATED GARDENS AND IN PURCHASED
VEGETABLES
Petra Karo Bešter
[a]*, Franc Lobnik
[b], Ivan Eržen
[c], Marko Zupan
[b]Paper was presented at the 4th International Symposium on Trace Elements in the Food Chain, Friends or Foes, 15-17 November, 2012, Visegrád, Hungary
Keywords: cadmium, contamination, soil, vegetables, garden, market.
Self-supply with home-produced vegetables is very common in urban areas, where cadmium is a characteristic pollutant due to its anthropogenic origin. It has a harmful effect on human health. People are exposed to cadmium in different ways. One of the most common is through consumption of contaminated food, such as home-produced vegetables. However, different vegetables accumulate cadmium in different concentrations and as such pose different risk to human health. In this research 6 species of vegetables were sampled: endive, chicory, courgettes, tomato, onion and carrot. Vegetables (edible parts) were sampled in gardens of the Municipality of Celje, which is the third largest city in Slovenia. In some areas soils in the city and its vicinity are polluted with heavy metals (e.g. cadmium, lead, zinc) due to past industrial activities. Sampling area was stratified into 6 zones according to Slovenian legislation and the level of soil pollution with cadmium (mg/kg DW): <0.99, 1.00 - 1.99; 2.00 – 3.99; 4 – 7.99; 8 – 11.99; >12. Additionally, vegetables were purchased in local shops, markets and supermarkets in order to compare concentrations of cadmium in vegetables grown in gardens and in purchased vegetables. The main goal of this research was to determine whether purchased vegetables contain significantly lower concentration of cadmium than vegetables produced on gardens of the Municipality of Celje. Results showed that the significant difference between the average concentrations of cadmium in purchased and garden vegetables was observed in vegetables produced in gardens with soil cadmium content above 2 mg/kg DW. Therefore, the recommendation to purchase vegetable rather than to produce it at home garden is justified in areas where the contamination of soil with cadmium is above 2 mg/kg DW when producing carrot, chicory and endive or above 4 mg/kg DW when producing courgettes, tomato and onion.
* Corresponding Author
E-Mail: [email protected]
[a] OIKOS Development Consulting Ltd, Glavni trg 19, 1241 Kamnik, Slovenia
[b] University of Ljubljana, Biotechnical Faculty, Jamnikarjeva 101, 1000 Ljubljana, Slovenia.
[c] University of Ljubljana, Faculty of Medicine, Vrazov trg 2, 1104 Ljubljana, Slovenia
Introduction
Cadmium is a very toxic metal and has a harmful effect on human health, including promotion of osteoporosis, kidney damage, and lung cancer13. It occurs naturally in ores
together with zinc, lead, copper and phosphorous. Cadmium compounds are used as stabilizers in PVC products, colour pigment, re-chargeable nickel–cadmium batteries and several alloys8. Due to its wide application in industry,
cadmium is a characteristic pollutant in urban areas, where self-supply with home-produced vegetables is very common. Therefore, home gardeners are unknowingly exposed to cadmium through consumption of contaminated home-produced vegetables. However, different vegetables accumulate cadmium in different concentrations and as such pose different risk to human health. According to Pettersson11 the order for accumulation of cadmium in
vegetables was lettuce > carrot, tomato > rape, kale, radish > cucumber, peas, bean. Alexander et al.2 reported the
following order: lettuce > spinach > onion > carrot > pea >french bean. Zupan et al.16 observed slightly different
order: spinach > endive > carrot > red beet > lettuce > radish > tomato > potato > pea > Brussels sprouts > cabbage > kohlrabi.
The research area was the Municipality of Celje which is the third largest city in Slovenia. The population of the city is 37.834 people 14. In some areas soils in the city and its
vicinity are polluted with metals (e.g. cadmium, lead, zinc) due to past industrial activities (e.g. zinc smelters, brickworks, enamelware industry, heavy traffic and steel mills)9,15. Eržen et al.4 concluded that increased
concentrations of cadmium in soil in two areas of Municipality of Celje (Medlog and Teharje) presented a problem because surpluses of yields are sold on a market.
This research was conducted in the context of main research “Risk assessment of cadmium intake from home grown vegetables on the local population of the Municipality of Celje”. The main goal was to determine whether purchased vegetables contained significantly lower concentration of cadmium than vegetables produced on gardens of the Municipality of Celje. Moreover, we wanted to determine if recommendation to buy vegetable is justified?
Materials and Methods
Sampling garden area was stratified into 6 zones according to the level of soil pollution with cadmium (mg/kg DW): <0.99, 1.00 - 1.99; 2.00 – 3.99; 4 – 7.99; 8 – 11.99; >12. Slovenian legislation3 determines three
normative values of Cd concentration in soil (mg/kg DW after aqua regia dissolution): 1 - limit, 2 - warning and 12 - critical. However, the interval between warning and critical value of Cd in soil is quite wide, therefore we divided it to get more gradual transition from moderate to heavy polluted gardens in the sampling area.
The following 6 species of vegetables were included in research: endive, chicory, courgettes, tomato, onion and carrot. Samples of vegetables from gardens and markets were brought to the laboratory of the “Centre for Soil and Environmental Science”, where they were cleaned with deionised water and cut with a stainless steel knife. Samples were than lyophilised and crushed in mill "Retsch ZM 100". The concentration of cadmium in vegetables was determined in “Acme Analytical Laboratories Ltd”, Canada, after aqua regia dissolution by inductively coupled plasma mass spectrometry. Blanks, duplicates and standard reference materials were inserted in the sequences of analysed samples. As data of concentration of cadmium in vegetable was expressed in dry weight (DW), conversion to fresh weight (FW) was made based on literature data (Table 1).
Table 1. The water content of selected vegetables (bolded number refers to the number of reference)
Vegetables The water content (%) 10 7 12 6 1 Average
Courgettes 94,7 91 91,3 94 91,6 92,5 Tomato 93,4 94 94,2 93,8 94,5 94,0 Onion 92,8 88 87,6 89 89,11 89,3 Carrot 89,9 90 89,7 89,2 88,29 89,4 Edive 93,7 94 94,3 93,8 93,79 93,9 Chicory 96,2 94 94,4 94,7 94,52 94,8
Allowed maximum levels of cadmium in vegetables according to European legislation5 are set for tomato, onion
and courgettes at 0.05 mg/kg FW; for carrot at 0.10 mg/kg FW; and for endive and chicory at 0.20 mg/kg FW.
Results and Discussion
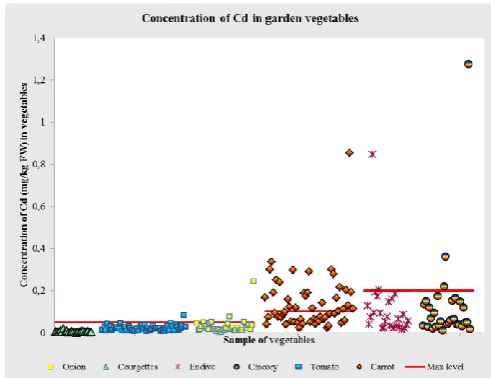
The concentration of cadmium in garden vegetables exceeded the regulatory allowed maximum level in 39 samples (Figure 1). The most frequently exceeded concentration of cadmium was in carrot (27-times), followed by onion (4-times), chicory (3-times), endive (2-times) and once in tomato. However, bear in mind that the number of sampled vegetable species was different.
The concentration of cadmium in purchased vegetables was exceeded in two samples, in carrot (0,157 mg/kg FW) and chicory (1,203 mg/kg FW) (Figure 2). Both two samples were produced locally and bought in city market.
Figure 3 illustrates the response of garden vegetables to increase concentrations of cadmium in soil. The lowest response was noticed in courgette and the moderate
(Table 2). The first main increase of cadmium concentration in carrot, chicory and endive occurs at the level of garden pollution between 2.00-3.99 mg/kg DW of cadmium in soil and in courgette, tomato and onion at the level between 4.00-7.99 mg/kg DW.
Figure 1. The concentrations of cadmium in a garden vegetable samples with maximum levels (mg/kg FW)5
Figure 2. The concentration of cadmium in purchased vegetable sample, with maximum levels (mg/kg FW)5
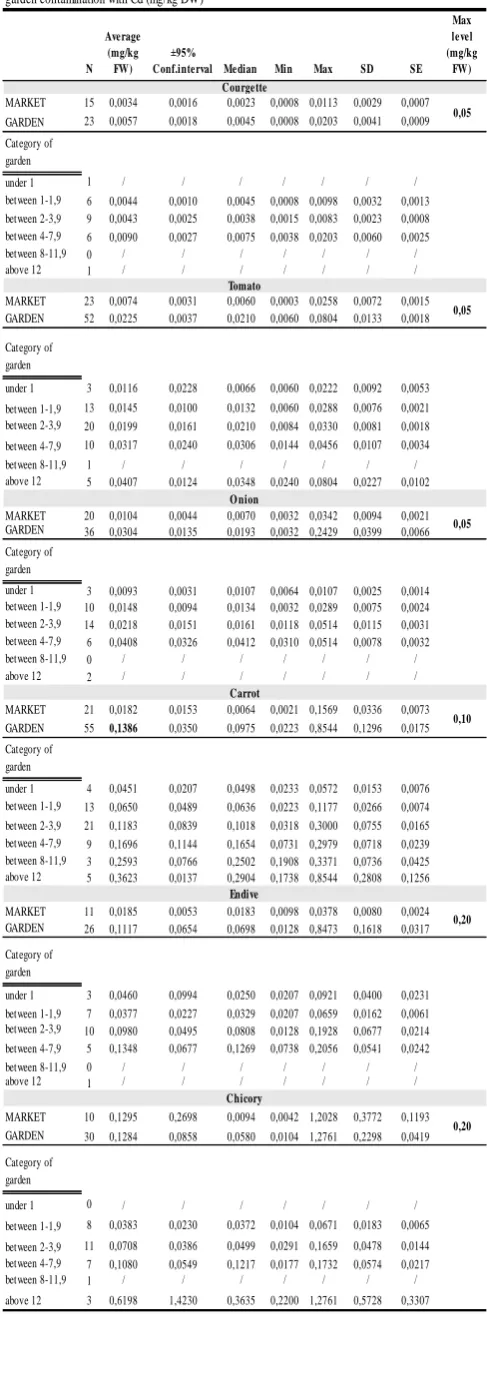
Table 2 depicts the basic descriptive statistics for garden and purchased vegetables. The concentrations of cadmium in garden vegetables mostly varied in endive, chicory and carrot. The latter two also varied the most in purchased vegetables.
Figure 3. The average concentration of cadmium in vegetables grown on gardens with different soil cadmium content and regulatory allowed maximum levels of cadmium in vegetables. Dotted line refers to the lack of data of the average concentration of cadmium in chicory and tomato at level of soil pollution between 8.00 and 11,99 mg/kg DW of cadmium in garden.
The lowest concentration of cadmium in a sample was detected in fruit vegetables: in courgettes (0,0008 mg/kg FW) in garden vegetables and in tomato (0,0003 mg/kg FW) in purchased vegetables. The highest concentration of cadmium in a sample was detected in purchased and garden chicory (1,2028 mg/kg FW and 1,2761 mg/kg FW, respectively). Moreover, the highest difference between average value and median was noticed in chicory, but average values between purchased and garden chicory were similar (0,1295 and 0,1284 mg/kg FW, respectively).
Generally, the average concentrations of cadmium were lower in purchased vegetables than in garden vegetables. The average concentration of cadmium in courgettes was 1,7 times higher than in purchased, 3-times higher in tomato and onion, 6-times higher in endive and 7,6-times higher in carrot than in purchased ones. Likewise, the average concentration of cadmium in purchased vegetables was lower than average concentration of cadmium in garden vegetables, which were stratified in 6 garden categories, with the exception of chicory. In general, the significant difference between average concentrations of cadmium in purchased and garden carrot, chicory and endive were detected in gardens with soil cadmium content more than 2 mg/kg DW and in courgette, tomato and onion at gardens with soil cadmium content above 4 mg/kg DW.
The ratio between medians of garden and purchased courgettes, tomato and onion was similar compared to the ratio between average values of garden and purchased vegetables. However, the median of garden endive was 3,8-times higher compared to purchased, the median of chicory was 6,2-times higher and the median of carrot was 15,3-times higher compared to purchased ones.
Table 2.Descriptive statistics for vegetable samples from markets, gardens and according to category of
garden contamination with Cd (mg/kg DW)
N Average
(mg/kg FW)
±95%
Conf.interval Median Min Max SD SE Max level (mg/kg
FW)
MARKET 15 0,0034 0,0016 0,0023 0,0008 0,0113 0,0029 0,0007 GARDEN 23 0,0057 0,0018 0,0045 0,0008 0,0203 0,0041 0,0009 Category of
garden
under 1 1 / / / / / / /
between 1-1,9 6 0,0044 0,0010 0,0045 0,0008 0,0098 0,0032 0,0013 between 2-3,9 9 0,0043 0,0025 0,0038 0,0015 0,0083 0,0023 0,0008 between 4-7,9 6 0,0090 0,0027 0,0075 0,0038 0,0203 0,0060 0,0025 between 8-11,9 0 / / / / / / /
above 12 1 / / / / / / /
MARKET 23 0,0074 0,0031 0,0060 0,0003 0,0258 0,0072 0,0015 GARDEN 52 0,0225 0,0037 0,0210 0,0060 0,0804 0,0133 0,0018 Category of
garden
under 1 3 0,0116 0,0228 0,0066 0,0060 0,0222 0,0092 0,0053 between 1-1,9 13 0,0145 0,0100 0,0132 0,0060 0,0288 0,0076 0,0021 between 2-3,9 20 0,0199 0,0161 0,0210 0,0084 0,0330 0,0081 0,0018 between 4-7,9 10 0,0317 0,0240 0,0306 0,0144 0,0456 0,0107 0,0034 between 8-11,9 1 / / / / / / / above 12 5 0,0407 0,0124 0,0348 0,0240 0,0804 0,0227 0,0102
MARKET 20 0,0104 0,0044 0,0070 0,0032 0,0342 0,0094 0,0021 GARDEN 36 0,0304 0,0135 0,0193 0,0032 0,2429 0,0399 0,0066 Category of
garden
under 1 3 0,0093 0,0031 0,0107 0,0064 0,0107 0,0025 0,0014 between 1-1,9 10 0,0148 0,0094 0,0134 0,0032 0,0289 0,0075 0,0024 between 2-3,9 14 0,0218 0,0151 0,0161 0,0118 0,0514 0,0115 0,0031 between 4-7,9 6 0,0408 0,0326 0,0412 0,0310 0,0514 0,0078 0,0032 between 8-11,9 0 / / / / / / /
above 12 2 / / / / / / /
MARKET 21 0,0182 0,0153 0,0064 0,0021 0,1569 0,0336 0,0073 GARDEN 55 0,1386 0,0350 0,0975 0,0223 0,8544 0,1296 0,0175 Category of
garden
under 1 4 0,0451 0,0207 0,0498 0,0233 0,0572 0,0153 0,0076 between 1-1,9 13 0,0650 0,0489 0,0636 0,0223 0,1177 0,0266 0,0074 between 2-3,9 21 0,1183 0,0839 0,1018 0,0318 0,3000 0,0755 0,0165 between 4-7,9 9 0,1696 0,1144 0,1654 0,0731 0,2979 0,0718 0,0239 between 8-11,9 3 0,2593 0,0766 0,2502 0,1908 0,3371 0,0736 0,0425 above 12 5 0,3623 0,0137 0,2904 0,1738 0,8544 0,2808 0,1256
MARKET 11 0,0185 0,0053 0,0183 0,0098 0,0378 0,0080 0,0024 GARDEN 26 0,1117 0,0654 0,0698 0,0128 0,8473 0,1618 0,0317 Category of
garden
under 1 3 0,0460 0,0994 0,0250 0,0207 0,0921 0,0400 0,0231 between 1-1,9 7 0,0377 0,0227 0,0329 0,0207 0,0659 0,0162 0,0061 between 2-3,9 10 0,0980 0,0495 0,0808 0,0128 0,1928 0,0677 0,0214 between 4-7,9 5 0,1348 0,0677 0,1269 0,0738 0,2056 0,0541 0,0242 between 8-11,9 0 / / / / / / /
above 12 1 / / / / / / /
MARKET 10 0,1295 0,2698 0,0094 0,0042 1,2028 0,3772 0,1193 GARDEN 30 0,1284 0,0858 0,0580 0,0104 1,2761 0,2298 0,0419 Category of
garden
under 1 0 / / / / / / /
between 1-1,9 8 0,0383 0,0230 0,0372 0,0104 0,0671 0,0183 0,0065 between 2-3,9 11 0,0708 0,0386 0,0499 0,0291 0,1659 0,0478 0,0144 between 4-7,9 7 0,1080 0,0549 0,1217 0,0177 0,1732 0,0574 0,0217 between 8-11,9 1 / / / / / / / above 12 3 0,6198 1,4230 0,3635 0,2200 1,2761 0,5728 0,3307
Conclusion
Due to basic statistics parameters and the fact that the average concentration of cadmium in garden vegetables was at least two times higher than in purchased vegetables, with the exception of chicory, the purchased vegetable contribute less cadmium in food chain than garden vegetables. However, the significant difference between the average concentrations of cadmium in purchased and garden vegetables was observed in vegetables produced in gardens with soil cadmium content above 2 mg/kg DW. Therefore, the recommendation to purchase vegetable rather than to produce it at home garden in contaminated areas is justified in areas where the contamination of soil with cadmium is above 2 mg/kg DW when producing carrot, chicory and endive or above 4 mg/kg DW when producing courgettes, tomato and onion.
Acknowledgements
This research was financed by the European Union, the European Social Fund. The operation is being implemented in the framework of the Operational Programme for Human Resources Development for the Period 2007-2013, Priority axis 1: Promoting entrepreneurship and adaptability, Main type of activity 1.1.: Experts and researchers for competitive enterprises. The authors would also like to thank Ms. Barbara Kruhar for her technical assistance.
References
1Agricultural Research Service, National Agricultural Library,
National Nutrient Database for Standard Reference,
http://www.nal.usda.gov/fnic/foodcomp/search/ (Accessed 22th October 2012)
2Alexander, P. D., Alloway, B. J., Dourado, A. M.. Environ.
Pollut. 2006, 144, 736–745.
3Decree on The Limit Values, Alert Thresholds and Critical Levels
of Dangerous Substances Into the Soil. Official J. Rep. Slovenia, 1996, No.68
4Eržen, I., Bošnjak, K., Uršič, S. Zdrav. varst., 2005, 44, 85-92 5European Community.. Commission Regulation (EC) No
1881/2006 setting maximum levels for certain contaminants in foodstuffs. Official J..Eur. Commun., 2006, L364, 19–20.
6Favier J.C., Ireland-Ripert J.,Toque C., Feinberg M. Repertoire
gegeral des aliments. 1995. 477-551
7Haenel. H. Energie und Nahrstoffgehalt von Lebensmitteln.
Lebensmittel-tabellen.1979. 492-567
8Järup, L. Brit. Med. Bull., 2003, 68, 167 - 182.
9Lobnik, F., Zupan, M., Hudnik, V., Vidic. N. J. Environ.
Geochem. and Health .199416, 287-299
10Paul, A.A. and Southgate, D.A.T. McCance and Widdowson’s
The composition of foods.1978,..1-229
11Pettersson, O. Swed. J. Agric. Res.. 1977. 7, 21–24.
12Souci S.W., Fachmann W., Kraut H. Die Zusammensetzung der
Lebensmittel. .1981. 1-1352
13Staessen, J. A., Roels, H. A., Emelianov, D., Kuznetsova, T.,
Thijs, L., Vangronsveld, J., Fagard, R. The Lancet1999. 353, 1140–1144.
14Statistical office of Republic of Slovenia. Data on the
Municipality of Celje. http://www.stat.si/eng/KrajevnaImena/ default.asp?txtIme=CELJE&selNacin=celo&selTip=naselja &ID=309 (accessed 10th October 2012).
15Vrščaj, B., Lobnik, F., Zupan, M. Data on soil pollution for
urban planning. Ljubljana, Biotechnical Faculty, Department
of Agronomy, Centre for Soil and Environmental Sciences,
2002, 1–11.
16Zupan, M., Hudnik, V., Lobnik, F., Grčman, H. 1st Slovenian
congress on Food and Nutrition. 1996.