NOVEL SELECTIVE SPECTROPHOTOMETRIC METHOD FOR
HYDROSULFIDE (HS
-) IONS ASSESSMENT USING VITAMIN
B12 PRECURSOR, AQUACYANOCOBYRINIC ACID
HEPTAMETHYL ESTER
Hadeel H. El-Shalakany
[a],
M. S. A. Hamza
[a]and Ayman H. Kamel
[a]*
Keywords: Aquacyanocobyrinic acid heptamethylester (aquacyanocobester), spectrophotometry, hydrosulfide determination.
A simple spectrophotometric method with good selectivity and high sensitivity towards sulfide ions has been introduced. The method is based on the replacement of the axial water molecule of the aquacyanocobyrinic acid heptamethyl ester (ACCbs) reagent after the reaction with HS- ions, and forming stable complex. ACCbs reagent is characterized with three distinguishable absorption bands with absorption
maxima at 353, 497 and 527 nm. After adding HS-, a new absorption band at 582 nm has been obtained. The decrease of the absorption
bands of the reaction product at 353, 497 and 527 nm and the enhancement of the band at 582 nm are quantitatively linear to HS
-concentration over the -concentration range 0.02-1.543 µg mL-1 with lower limit of detection 0.019 µg mL-1. No noticeable interferences are
caused by most common ions. Suitability for the assessment of HS- in complex matrices without prior treatment was shown after validation
of the method according to the standards of quality assurance. The results compare fairly well with data obtained using the standard method.
* Corresponding Authors Fax:
E-Mail: [email protected]
[a] Chemistry Department, Faculty of Science, Ain Shams University, Cairo, Egypt
Introduction
Sulfides (H2S, HS-, and S2-) have been found in anoxic
environments including natural water, wastewater, crude petroleum, natural gas and volcanic gases.1 Hydrogen
sulfide is a colorless gas that can exist naturally in groundwater. It is corrosive and can leach metals from plumbing systems into the water. Corrosion of metals by hydrogen sulfide forms a black precipitate that can stain laundry and bathroom fixtures, darken silverware, and discolor copper and brass utensils. Water that is giving off a distinctive smell is most likely contaminated with hydrogen sulfide.2 It is also can enter a groundwater through
sulfur-reducing bacteria present in groundwater well. These bacteria use sulfur as an energy source to chemically change sulfates to hydrogen sulfide. They can also use sulfur from decaying plants and other organic matter in oxygen-deficient environments. They can occur in deep or shallow wells, and reside in plumbing systems.3 In the human body, mercaptans
are readily oxidized to their respective sulfides and, consequently, sulfide can be founded in animal halite. Animals showing signs of liver cirrhosis produce more sulfides in their bloodstream and halite. Thus, determination of sulfide could be used as a marker of liver diseases.4
Environmental sulfide concentration has been usually found in concentrations of μmol L-1. For example, the recognition
threshold range which hydrogen sulfide odor can be detected by humans is 0.30-90 μmol L-1.5 Thus, the
determination of sulfide is necessary in different human activities, but continues to present challenges due to the complexity of samples, and the necessity to determine low concentrations of sulfide. In addition to the above, sulfides
can be also present in hydrogen sulfide pretreated fruits and vegetables. Therefore, rapid detection of hydrogen sulfide and its existing forms in aqueous media (total sulfides) has been gaining a great interest from researchers. In addition, to assure the quality control of manufactured products, a sensitive and selective method for sulfide determination is required.
Various analytical methods for hydrogen sulfide quantification and monitoring have been reported. These include simple titremitry.6,7 However, this method is not
useful for measurement of low concentrations, not selective and requires sample pre-treatment. Other techniques and methods have been developed including electrochemistry, 8-10 chromatography,11-13 inductively coupled plasma-atomic
emission spectroscopy,14,15 fluorimetry,16-18 and capillary
electrophoresis.19
Many spectrophotometric methods have been reported in the literature for monitoring sulfide. Some of these methods are based on the inhibitory effect of sulfide ion on the reactions of peroxidase/pyrogallol and H2O2 system,20
reducing effect on Fe3+/phenthroline complex,21
2,6-dichlorophenolindophenol (DCPI),22 N,N-dimethyl-p
-phenylenediamine/Fe3+,23,24 production of phenothiazine
dyes,25 nitroprusside,261, 2-naphthoquinone-4-sulfonate,27
and phenylseleno-nitrobenzoxadiazole derivative.28
Experimental
Apparatus
All absorbance measurements were carried out using Shimadzu UV-vis spectrophotometer (Model UV-1601) with 1.0 cm light path length matched quartz cells. For all pH measurements, Orion digital pH/mV meter (Model SA 720) and an Orion combined glass pH electrode (Model 80-02) were used.
Reagents
All Chemicals and reagents used were of analytical grade and deionized water was used throughout. Sodium sulfide, Na2S.9H2O, was purchased from Sigma-Aldrich. Phosphoric
acid 85%, acetic acid (glacial) and boric acid were obtained from Fluka. Aquacyanocobester (ACCbs) was prepared as described previously.29,30 In brief, vitamin B
12 was dissolved
in methanol solution containing 1 mol L-1 H
2SO4 and was
refluxed under nitrogen atmosphere for 4 days. The reaction mixture was then diluted with deionized water, neutralized with NaHCO3 and treated with solid NaCN to produce
dicyanocobester (DCCbs; violet color). The product is then extracted firstly with CCl4 followed by CH2Cl2. The solid is
then collected after solvent removal. The purity of DCCbs was checked with HPLC using 4.6 mm x 256 mm column filled with TSK-Gel silica-60 stationary phase, dichloromethane (97.3 %) as a mobile phase and a 1 mL min-1 elution rate. Aquacyanocobester (ACCbs) was
prepared by adding CH3COOH to methanolic solution of
DCCbs and adjusting the pH at 3. Formation of ACCbs was detected by the appearance of a characteristic absorption band at 353 nm. Universal buffer solutions were prepared by mixing 0.04 mol L-1 phosphoric, acetic and boric acids as
reported31 followed by pH adjustment with 0.2 mol L-1
NaOH.
Calibration curve and analytical procedure
A 2.5 mL of ACCbs (3.5 x 10⁻⁵ mol L-1) working reagent
solution, buffered with 0.04 mol L-1 universal buffer of pH 9,
was transferred into 1.0 cm path light length spectrophotometer quartz cell (4 mL total capacity) then titrated with small aliquots of HS- solution to obtain series
of solutions containing 0.02-1.55 µg mL-1 of HS- ion and the
absorbance was measured after 1 min at 353, 497, 527 and 582 nm, against a blank containing universal buffer adjusted to the same pH. The calibration plots between the absorbance changes at each wavelength against the sulfide concentration were constructed. All spectrophotometric measurements were in triplicate.
Determination of sulfide in wastewater samples
Domestic sewage water samples were collected and were filtered through Whatman filter paper no. 41 prior to analysis. A 2.5 mL portion of ACCbs reagent buffered with 0.04 mol L-1 of universal buffer (pH 9) was introduced in a
1.00 cm light path length cuvette and placed in the thermo-stated cell block of the spectrophotometer. A100 µL of the test sample was introduced to the cuvette, shaken and the absorbances at 353, 497, 528 and 582 nm were recorded.
Sulfide concentration was calculated from the calibration graph.
Wastewater samples were collected from sugarcane refinery factory, power plant and petrochemical industry, and filtered prior to analysis. A known volume, 1 mL of the effluent was introduced to a 10 mL volumetric flask and diluted to the mark with buffer at pH 9. For Power plant and petrochemical industry samples, 0.5 mL of the sample was diluted to 1 L with buffer at pH 9.
Results and Discussion
Characteristics of the absorption spectra
As previously reported,32 aqueous solution of ACCbs
exhibits three distinct absorption bands with absorption maxima at 353, 497 and 527 nm. After the addition of HS-, a
new absorption band at 582 nm and three isobestic points at 365, 440 and 554 nm have been also obtained as shown in figure 1. In alkaline solutions (pH 9), the reaction of ACCbs with hydrogen sulfide is not straightforward. HS- can act as
both ligands and reducing agents in which coordination (thermodynamic factor) and reduction (kinetic factor) can occur.33 It reacts with ACCbs in three consecutive and rapid
steps at pH 9.0. The first is the formation of (HS)(CN)Cbs(III) complex between aquocyanocobester and
hydrogen sulfide ion. The second step is a short-lived intermediate via inner-sphere electron transfer with to form reduced cobester [(H)S]Cbs(II)or even super reduced
cobester (+1 oxidation state). The third is the addition of a second HS- ion to the already reduced cobester. Kinetics and
mechanism of the reaction of hydrogen sulfide with cobalamin in aqueous solution have been previously described.34The equilibrium established between HS- ion and
ACCbs can be simplified and represented as shown in figure 2.
Figure 1. Absorption spectra of [ACCbs ]+ reagent (3.5 x 10⁻⁵ mol
L-1) of pH 9 with different concentrations of HS- ion (0.02-5.5 µg
mL-1).
Optimum reaction conditions
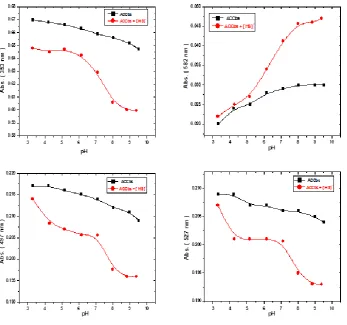
The effect of pH on the stability of HS/ACCbs system was investigated by measuring the decrease of the absorbances at 353, 497 and 527 nm and the increase of the absorbance at 582 nm for a series of solutions containing 0.5 µg mL-1 HS
Figure 2. Schematic representation of the interaction of hydrosulphide ion with ACCbs.
Figure 3. Effect of pH on the absorbance of (2.6 x 10⁻⁵mol L-1) [ACCbs]+ reagent in absence and presence of 0.5µg mL-1 hydrosulphide
ion at different wavelengths.
The pH of each solution was adjusted at values ranging from pH 3-9.5 using 0.04 mol L-1 universal buffer. The
absorbance-pH profiles reveal good response of the system at pH 9 as shown in figure 3. At pH > 9, OH- interference
takes place due to the formation of cyanohydroxocobester [HO(CN)Cbs] species. All subsequent measurements were made at pH 9.0.
Selectivity measurements
The selectivity of [ACCbs]+ reagent towards HS- ion was studied
by measuring the absorbance of solutions containing fixed concentration of HS- concentration (0.72 µg mL-1), in the presence
of a series of varied concentrations of different anions such as SCN-, I-, Br-, Cl-, NO
3-, NO2-, HSO3-, SO42-, HPO42-, CN-, oxalate,
citrate and tartrate. The tolerance limit was taken as the amount CoIII
CN
CoIII
CN pH 9.5
OH H2O
HS
-HS
-CoIII
CN HS
-CN
HS -e
CoII S
.-CN CoII
.
SSH
2-Step I
formation of (HS)(CN)Cbs(III) complexe
Step II inner-sphere electron
transfer
Step III addition of a second HS
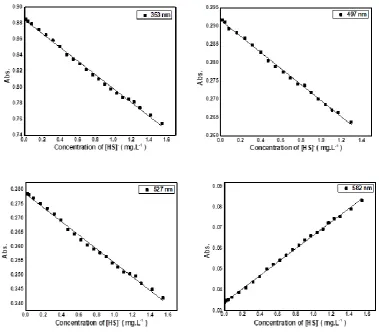
Figure 4. Calibration curves at different wavelengths of(3.5x10⁻⁵molL-1)[ ACCbs ]+ with HS- ion (0.02-1.55µg mL-1).
that causes ±5% error in the analytical signal at 353, 497, 527 and 582 nm for the formed HS/ACCbs complex. All anions used in selectivity measurements were in the form of sodium or potassium salts. As shown in (Table 1) that summarizes the tolerance limits of the tested anions, it was found that the method displays good selectivity towards HS
-in the presence of many common anions. The method, however, suffers from slight interference by iodide ion especially at 353 nm (γ-band). High interference from CN
-and SO32- was also observed. This can be attributed to the
high affinity of both cyanide and sulfite ions for coordination with cobalt atom in the axial position of the complex. Sulfite interference was eliminated by the addition of 1 mL of 0.1 % formaldehyde to 3 mL of test solution prior to each measurement.
Batch determination of hydrosulfide ion and calibration curves
Under optimized conditions, validation of the proposed spectrophotometric method for HS- determination was done
by measuring linearity range, lower limit of detection (LOD), accuracy (recovery), precision or repeatability (within-batch variability CVw), between-batch variability (CVb), standard
deviation and sensitivity (slope). Six batches (six determinations each) were examined at each wavelength according to the quality assurance standards35 and the results
are given in Table 2.
Table 1. Tolerance limits (change in absorbance ≤ 5 %) of some diverse ions on the reaction of aquacyanocobester with hydrogen sulfide ion (0.72 µg mL-1).
Diverse ion
Tolerance ratio [ DI : [Ag(CN)2 ]-] , w/w at λ
nm
353 497 527 582
NO2- 180 120 280 380
NO3- 120 160 160 200
Cl- 70 80 80 105
Br- 60 90 80 80
I- 20 22 22 22
SO32- 0.65 0.9 0.8 1
SCN- 75 85 85 120
SO42- 100 110 110 110
Oxalate 160 220 180 240
Citrate 250 290 290 350
Tartarate 190 210 210 230
HPO42- 150 160 160 160
CN- 0.8 0.2 1.2 0.05
For HS- determination, the absorbance change was
linearly proportional to the HS- concentration at 353, 497,
528 and 582 nm. Beer’s law is obeyed over the concentration ranges of 0.04-1.543, 0.04-1.3, 0.04 -1.543 and 0.02-1.543µg mL-1 with a detection limit of 0.035,
0.027, 0.037 and 0.019 µg mL-1 at 353,497, 527 and 582 nm,
Table 2. Performance characteristics of the proposed colorimetric method for measuring the concentration of HS- ion.
Parameter λmax= 353 nm λmax= 497 nm λmax= 527 nm λmax= 582 nm
Linear range (µg mL-1) 0.04-1.543 0.04-1.3 0.04-1.543 0.02-1.543
Detection limit (µg mL-1) 0.035 0.027 0.037 0.019
Sensitivity (mL µg-1) 0.086 0.022 0.024 0.032
Molar absorptivity (mol-1cm-1L) 9.43 x 10⁴ 2.41 x 10⁴ 2.66 x 10⁴ 3.55 x 10⁴
Corre1ation coefficient (r2) 0.996 0.997 0.996 0.999
Optimum pH 9 9 9 9
Standard deviation (σ %) 0.4 0.9 1.1 1.2
Between-batch variability (CVb %) 0.3 0.5 0.8 0.8
Within-batch repeatability (CVw %) 0.6 1.1 0.9 1.2
Accuracy (%) 99.5 98.7 98.4 99.1
Table 3. Spectrophotometric determination of [HS-] test solutions at different wavelengths in the same run.
Taken µg mL-1
Recovery, %* at λmax nm
353 497 527 582
0.1 99.1±0.3 98.5±0.1 97.9±0.7 98.6±0.5
0.4 98.9±0.1 97.8±0.5 97.5±0.4 98.3±0.6
0.8 98.7±0.7 98.9±0.6 99.8±0.1 99.4±0.4
1.0 99.4±0.2 98.9±0.2 99.4±0.2 99.6±0.1
*Average of six measurements.
According to the IUPAC recommendations,36 the lower
detection limit was calculated as: LOD = 3σ/S where σ is the standard deviation of the blank measurements (n = 6), S is the slope of the calibration curve. As shown in Table 3, it presents results obtained for assessment of internal quality control HS- test solutions (0.1-1.0 µg mL-1) by absorbance
measurements at four different wavelengths in the same run.
A relative standard deviation of 0.3% and a mean average recovery of 98.7% were obtained. These data obtained support the application of this proposed method for quality control assessment of HS- in various matrices.
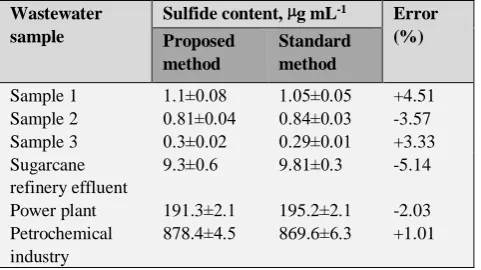
Table 4. Sulfide assessment in real wastewater samples.
Wastewater sample
Sulfide content, µg mL-1 Error
(%) Proposed
method
Standard method
Sample 1 1.1±0.08 1.05±0.05 +4.51 Sample 2 0.81±0.04 0.84±0.03 -3.57 Sample 3 0.3±0.02 0.29±0.01 +3.33 Sugarcane
refinery effluent
9.3±0.6 9.81±0.3 -5.14
Power plant 191.3±2.1 195.2±2.1 -2.03 Petrochemical
industry
878.4±4.5 869.6±6.3 +1.01
Analytical applications
The proposed method was tested for the determination of sulfide in some domestic sewage water samples and an effluent formed from sugarcane factory. The results obtained for the analysis by the proposed spectrophotometric and the standard method,37 are shown in
Table 4.
The calculated Student means (t-test) from each method at 95% confidence level do not exceed the tabulated values. An F-test, show no significant difference at 95 % confidence level between the means and variances of the two sets of results.
Conclusion
Novel sensitive and selective spectrophotometric method is presented for sulfide determination in domestic sewage water samples. The method is based on the substitution of axial ligands of [ACCbs]+ reagent by HS- ion for
determination of HS- ion with insignificant interference with
most common ions. The reaction of HS- with [ACCbs]+ is
reversible reaction with stoichiometric ratio (2:1) at pH 9. Changes of the absorbances at 353, 497, 528 and 582 nm are linearly related to HS- concentrations over the range of
0.04-1.543, 0.04-1.3, 0.04 -1.543 and 0.02-1.543 µg mL-1 with a
detection limit of 0.035, 0.027, 0.037 and 0.019 µg mL-1 for
the previously shown wavelengths, respectively.
This recommended technique is distinguished by obtaining satisfactory results with simple and available reagents and it is simple, cheap, selective and highly sensitive technique for determination of traces of HS- ion in
aqueous solutions.
Advantages offered by the proposed method, compared with those previously suggested (Table 5) are the lower detection limit,23-25,27,28 the wider working range of
measurements,20-24,27,28 the faster reaction time20-25,27,38and
Table 5 Comparison of the recommended colorimetric method for determination of [HS]-ion with other spectrophotometric methods
Reagents λmax,
nm
Linear range,
µg mL-1
Detection limit
( µg mL-1 )
Major interferents Working pH Reac-tion time
Ref.
Peroxidase/pyrogallol and H2O2
420 0.02 – 0.23 0.013 CN-, I-, Fe3+, Cd2+,
Co2+
6.5 4 min. [20]
Fe2+ /HS-/ catechol/ p,toluidine
510 0.035 – 1.4 Not mentioned
NO2-, NO3-, SO2,Fe3+, V5+
0.1 M HCl
Few minutes
[21]
Fe3+/ HS-/1,10-phen-anthroline complex
510 0.035 – 1.4
Mn3+/HS-/diphenylamine 570 0.14–1.40 5 M H2SO4
Mn3+/HS-/ barium diphenylamine sulfonate
540 0.14–1.40
2,6-dichlorophenolindo-phenol (DCPI)
520 0.01- 1.0 0.01 10% EtOH, used in
halitosis treat-ments (Halita and Perio-Aid solutions)
12 2 min [22]
N,N-dimethyl-p-phenyl-enediamine/Fe3+
745 0.4 - 2.0 0.4 Not mentioned Not
mentioned
3 min [23]
745 0.17 - 1.0 0.04 Not mentioned 0.1 mol
L-1HCl
95 s [24]
Production of phenothiazine dyes
520 664 677 590
0.25–3.0 0.05–1.5 0.04–0.75 0.05–1.0
0.033 0.024 0.018 0.051
I-, F- 0.1 mol L-1
H2SO4
[25]
Sodium nitroprusside 558 5000 -
15000
Not mentioned Not mentioned Not
mentioned
30 s [26]
Sodium1,2- naphthaquinone-4-sulfonate ( NQS )
320 0.5 - 20 0.16 CN-, SO32-,
S2O32-, HCO3-S2O32-, IO3-S2O32-, PO43-, C2O42-, CH3COO-
0.1 M HCl 60 min [27]
Phenylselenonitrobenzo-xadiazole derivative
551 0.33 – 3.30 0.069 - 4.8 - [28]
Magenta 540 0.025 – 2.50 0.015 IO3-,SO32-, Hg2+,
Hg+, Pb2+, Cu2+, Ag+
7 2.5 min [38]
[ ACCbs ]+ 0.02 – 1.543 0.019 CN-, SO32- 9 1 min This work
References
1Lawrence, N. S., Davis, J. and Compton, R. G., Analytical
strategies for the detection of sulfide: a review,Talanta, 2000, 52(5), 771-784. https://doi.org/10.1016/S0039-9140(00)00421-5
2Oprime, M. E., Garcia, J. r. O. and Cardoso, A. A., Oxidation of
H2S in acid solution by Thiobacillus ferrooxidans and Thiobacillus thiooxidans. Process Biochem., 2001, 37(2), 111-114. https://doi.org/10.1016/S0032-9592(01)00179-0
3Clesceri, L., Greenberg, A. and Eaton, A., Standard methods for
the examination of water and wastewater, American Public Health Association (APHA), American Water Works Association, Water Environment Federation, Washington, DC. 1998.
4Marczin, N. and Yacoub, M., Disease Markers in Exhaled Breath:
Basic Mechanisms and Clinical Applications (NATO Science Series 346). Amsterdam: IOS Press, 2002.
5Guidotti, T. L., Hydrogen sulfide: advances in understanding
human toxicity. Int. J. Toxicol., 2010, 29(6), 569-581. Online ISSN: 1092-874X
6Pawlak, Z. and Pawlak, A. S., Modification of iodometric
determination of total and reactive sulfide in environmental samples. Talanta 1999, 48(2), 347-353. https://doi.org/10.1016/S0039-9140(98)00253-7
7Balasubramanian, S. and Pugalenthi, V., A comparative study of
the determination of sulphide in tannery waste water by ion selective electrode (ISE) and iodimetry. Water Res., 2000, 34(17), 4201-4206. https://doi.org/10.1016/S0043-1354(00)00190-1
8Tsai, D. M., Kumar, A. S. and Zen, J. M., A highly stable and
sensitive chemically modified screen-printed electrode for sulfide analysis. Anal. Chim. Acta, 2006, 556(1), 145-150. https://doi.org/10.1016/j.aca.2005.05.038
9Lawrence, N. S., Jiang, L., Jones, T. G. and Compton, R.
G.,Voltammetric Characterization of a N,N’-Diphenyl-p-phenylenediamine-Loaded Screen-Printed Electrode: A Disposable Sensor for Hydrogen Sulfide, Anal. Chem., 2003, 75(9), 2054-2059. DOI: 10.1021/ac020728t
10Cao, X., Xu, H., Ding, S., Ye, Y., Ge, X. and Yu,
L.,Electrochemical determination of sulfide in fruits using alizarin–reduced graphene oxide nanosheets modified electrode. Food Chem., 2016, 194, 1224-1229. https://doi.org/10.1016/j.foodchem.2015.08.134
11Hissner, F., Mattusch, J. and Heinig, K., Quantitative
12Miura, Y., Ion chromatography for rapid and sensitive
determination of inorganic sulfur anions in their mixtures. JPN Analyst 2005, 54(8), 651-664. https://doi.org/10.2116/bunsekikagaku.54.651
13Jeyakumar, S., Rastogi, R., Chaudhuri, N. and Ramakumar, K.,
Determination of sulphur species in the presence of common anions with indirect measurement of sulphide by ion chromatography (IC). Anal. Lett., 2002, 35(2), 383-395. https://doi.org/10.1081/AL-120002537
14Colon, M., Todoli, J., Hidalgo, M. and Iglesias, M., Development
of novel and sensitive methods for the determination of sulfide in aqueous samples by hydrogen sulfide generation-inductively coupled plasma-atomic emission spectroscopy. Anal. Chim. Acta, 2008, 609(2), 160-168. https://doi.org/10.1016/j.aca.2008.01.001
15Čmelík, J., Machát, J., Otruba, V. and Kanický, V.,Contribution
to vapor generation-inductively coupled plasma spectrometric techniques for determination of sulfide in water samples. Talanta 2010, 80(5), 1777-1781. https://doi.org/10.1016/j.talanta.2009.10.022
16Peng, H., Cheng, Y., Dai, C., King, A. L., Predmore, B. L., Lefer,
D. J. and Wang, B., A fluorescent probe for fast and quantitative detection of hydrogen sulfide in blood. Angew. Chem. Int. Ed., 2011, 50(41), 9672-9675. https://doi.org/10.1002/anie.201104236
17da Silveira Petruci, J. F. and Cardoso, A. A., A new palladium
chelate compound for determination of sulfide. Microchem. J., 2013, 106, 368-372.
https://doi.org/10.1016/j.microc.2012.09.009
18Segura, D. F., da Silveira Petruci, J. F., Cardoso, A. A., Frem, R.
C. G., de Godoy Netto, A. V. and Champness, N. R.,A new luminescent silver-based probe for on/off sulfide determination. Inorg. Chem. Commun., 2016, 63, 93-95. https://doi.org/10.1016/j.inoche.2015.11.019
19Gerbersmann, C., Lobinski, R. and Adams, F. C., Determination
of volatile sulfur compounds in water samples, beer and coffee with purge and trap gas chromatography—microwave-induced plasma atomic emission spectrometry. Anal. Chim. Acta 1995, 316(1), 93-104. https://doi.org/10.1016/0003-2670(95)00344-Y
20Ghadiri, M., Kariminia, H. R., Azad, R. R.,Spectrophotometric
determination of sulfide based on peroxidase inhibition by detection of purpurogallin formation. Ecotoxicol. Environ. Saf., 2013, 91, 117-121.
https://doi.org/10.1016/j.ecoenv.2013.01.015
21Shyla, B., Nagendrappa, G., New spectrophotometric methods for
the determinations of hydrogen sulfide present in the samples of lake water, industrial effluents, tender coconut, sugarcane juice and egg. Spectrochim. Acta, Part A, 2012, 96, 776-783. https://doi.org/10.1016/j.saa.2012.07.011
22Rodrı́guez-Fernández, J., Pereiro, R. and Sanz-Medel, A., Optical
fibre sensor for hydrogen sulphide monitoring in mouth air. Anal. Chim. Acta, 2002, 471(1), 13-23. https://doi.org/10.1016/S0003-2670(02)00778-X
23Kong, M. C. and Salin, E. D., Spectrophotometric determination
of aqueous sulfide on a pneumatically enhanced centrifugal microfluidic platform. Anal. Chem., 2012, 84(22), 10038-10043. DOI: 10.1021/ac302507t
24Silva, M. S. P., Galhardo, C. X. and Masini, J. C., Application of
sequential injection-monosegmented flow analysis (SI-MSFA) to spectrophotometric determination of sulfide in simulated waters samples. Talanta, 2003, 60(1), 45-52. https://doi.org/10.1016/S0039-9140(03)00044-4
25Santos, J. C. C., Santos, E. B. G. N. and Korn, M., A comparison
of flow injection methods for sulfide determination based on phenothiazine dyes produced from diverse aromatic amines. Microchem. J., 2008, 90(1), 1-7. https://doi.org/10.1016/j.microc.2008.02.007
26Kass, M. and Ivaska, A., Spectrophotometric determination of
sulphur dioxide and hydrogen sulphide in gas phase by sequential injection analysis technique. Anal. Chim. Acta 2001, 449(1-2), 189-197. https://doi.org/10.1016/S0003-2670(01)01364-2
27Shariati-Rad, M., Irandoust, M. and Jalilvand, F.,
Spectrophotometric determination of hydrogen sulfide in environmental samples using sodium 1, 2-naphthoquinone-4-sulfonate and response surface methodology. Int. J. Environ. Sci. Technol., 2016, 13(5), 1347-1356. https://doi.org/10.1007/s13762-016-0959-6
28Bae, J., Choi, M. G., Choi, J. and Chang, S. K., Colorimetric
signaling of hydrogen sulfide by reduction of a phenylseleno-nitrobenzoxadiazole derivative. Dyes Pigments, 2013, 99(3), 748-752. https://doi.org/10.1016/j.dyepig.2013.06.018
29Markwell, A. J., Pratt, J. M., Shaikjee, M. S. and Toerien, J. G.,
The chemistry of vitamin B 12. Part 28. Crystal structure of dicyanocobyrinic acid heptamethyl ester and its interaction with alcohols: the effects of hydrogen bonding to co-ordinated cyanide. J. Chem. Soc., Dalton Trans., 1987(6), 1349-1357. DOI: 10.1039/DT9870001349
30Murakami, Y., Hisaeda, Y. and Ohno, T., Hydrophobic vitamin
B12. III. Incorporation of hydrophobic vitamin B12 derivatives into single-compartment vesicles and their alkylation in various molecular aggregates, Bull. Chem. Soc. Jpn., 1984, 57(8), 2091-2097.
https://doi.org/10.1246/bcsj.57.2091
31Lurie, J., Handbook of Analytical Chemistry. The stability
constants for metal complexes with inorganic ligands. Mir Publishers: Moscow, 1975.
32Hassan, S. S., Hamza, M. S. and Kelany, A. E., A novel
spectrophotometric method for batch and flow injection determination of cyanide in electroplating wastewater. Talanta 2007, 71(3), 1088-1095. https://doi.org/10.1016/j.talanta.2006.06.010
33Pratt, J. M., Inorganic chemistry of vitamin B12. London, UK,
Academic Press Inc.(London) Ltd., 1972.
34Salnikov, D. S., Kucherenko, P. N., Dereven'kov, I. A., Makarov,
S. V., van Eldik, R., Kinetics and mechanism of the reaction of hydrogen sulfide with cobalamin in aqueous solution. Eur. J. Inorg. Chem., 2014, 2014(5), 852-862. https://doi.org/10.1002/ejic.201301340
35Taylor, J. K., Quality assurance of chemical measurements. CRC
Press, 1987.
36Irving, H., Freiser, H. and West, T., IUPAC compendium of
analytical nomenclature, definitive rules. Pergamon Press, Oxford, 1981.
37Clesceri, L., Greenberg, A., ANDREW, D., Standard Methods
for the Examination of Water and Wastewater, Washington, 19th Edition Publication Office American Public Health Association (APHA), 1995.
38Safavi, A. and Ramezani, Z., Kinetic spectrophotometric
determination of traces of sulfide. Talanta 1997, 44(7), 1225-1230. https://doi.org/10.1016/S0039-9140(96)02163-7
![Figure 1. Absorption spectra of [ACCbs ]+ reagent (3.5 x 10⁻⁵ mol L-1) of pH 9 with different concentrations of HS- ion (0.02-5.5 µg mL-1)](https://thumb-us.123doks.com/thumbv2/123dok_us/7825784.2088339/2.595.327.525.498.643/figure-absorption-spectra-accbs-reagent-mol-different-concentrations.webp)
![Table 5 Comparison of the recommended colorimetric method for determination of [HS]-ion with other spectrophotometric methods](https://thumb-us.123doks.com/thumbv2/123dok_us/7825784.2088339/6.595.47.551.78.495/table-comparison-recommended-colorimetric-method-determination-spectrophotometric-methods.webp)
