ISSN: 2347-7474
International Journal Advances in Social Science and Humanities
Available online at: www.ijassh.com
RESEARCH ARTICLE
Assessment of Customer Satisfaction in Public Transport Services
in Zanzibar
Khadija I. Abeid*
Monitoring and Evaluation Unit, Department of Planning, Policy and Research, Ministry of Infrastructure and Communications, Zanzibar.
*Corresponding Author: Email: [email protected]
Abstract
The aim of this study was to assess customer satisfaction with the public bus (Daladala) services provided by Public Bus Operators in Zanzibar. To achieve this, a research was conducted on public transport bus (Daladala) users in town area in Zanzibar. In 3 sample areas selected for this study, 40 public bus transport bus (Daladala) users were selected to assess their overall satisfaction and factors that influence in the use of public bus transport services in Zanzibar using questionnaire. Data were analyzed using statistical package SPSS. The results of these analyses show that comfort, bus stop condition, waiting time and Safety trips were ascertained to have higher influence in customers/passengers satisfaction in public transport bus (Daladala) services provided in Zanzibar. However travelling time, transport cost, special buses and cleanliness were other factors influenced customer’s satisfaction on public transport bus (Daladala).
Keywords: Customer satisfaction, Services, Public transport bus (Daladala).
Introduction
Road transportation is the major means of inland transportation in Zanzibar for internal movement of passenger and goods. It plays a vital role in socio-economic development in both rural and urban areas. This mode includes daladala, taxi and private hire. Public transport bus (Daladala) is the most usage means of public transport in Zanzibar and it is believed that about 80% of populations of Zanzibar are served under this means. Statistics show that, in 2014 Daladala registered was 24.5%, Private Hire 37%, Taxi 17.6%, Staff bus 2.7% and cargo vehicle was 18%. There are 44 daladala routes in Zanzibar, 40 route in Unguja and 4 route in Pemba. (Road Transport and License Department, 2014).
Unfortunately, bus daladala is currently most unpleasant and blamed means of transportation in Zanzibar to satisfy customers’ needs and expectations from both
daladala regulator and regulator in term of comfort, cost, safety of bus, traveling time, bus stop condition, waiting time, safety during trip, bus boarding and others. Due to that, the main users of this public transport are unsatisfied with the services they get. This research was conducted on customer satisfaction based on public transportation bus (Daladala) so as to ascertain different issue pertaining with customer satisfaction to improve the quality of services delivered.
Khadija I. Abeid |November 2015 | Vol.3 | Issue 11 |41-51 42 condition that it provides safe, inexpensive
and efficient services.
Besides, the ease of use (availability) and cost effectiveness of public transport services is imperative to guaranteeing a resilient economy and improving mobility. Societies also benefits from the availability of public transportation services such that it lessens traffic congestion on our roads, saves money and creates and sustain jobs within communities.
Customer satisfaction is considered to be the most important factor whether it is meant for a product or a service. In case of failure to satisfy the customers the company will be replaced by others and when industries offering various services, have to be more vigilant because there is a special attitude that plays an important role attracting and retaining the customers [1]. The underlying assumption is that there is a direct link between the actual service and the customer’s perception of it. To increase public transport use, the service should be designed and performed in a way that accommodates the levels of service required by customers [2].
Statement of the Problem
Most of public institutions do not undergo research to assess customer satisfaction based on services provided by them due to the fact that they are nonprofit oriented. However, this study conducted on services provided on public bus (Daladala) so as to ascertain different issues pertaining with customer satisfaction to improve customer loyalty pursue customer services policy and understand reasons or factors contributing to poor delivery of services to customers or society.
The public bus operators need to access the customer satisfaction in public transport which are normally used by Zanzibar society, this is due to an increased private motorization has resulted in an increased traffic congestion which in turn results in longer travel times for many people especially in Fuoni and town area. In addition to congestion, private motorization is also affecting the safety of vulnerable road
users, high consumption of non-renewable resource and causes serious threat to the quality of human environments.
In order to prevent more problems caused by this increase in motorization it is highly recommended public decision makers to provide an attractive public transport service as an alternative transport mode in many cities. Public transport should become part of a solution for sustainable transport in the future. However, in order to keep and attract more passengers, public transport must have high service quality to satisfy and fulfill more wide range of different customer’s needs. It is important to summarize knowledge about what drives customer satisfaction and dissatisfaction in public transport area to design an attractive and marketable public transport.
Research Hypothesis
This study aim to assess customer’s satisfaction on public transport bus (daladala) services which can be tested on the following hypothesis.
Public transport (Daladala) users in Zanzibar are strongly dissatisfied.
It is possible for the regulator of public transportation to improve customer satisfaction by enacting appropriate policies and regulations.
Research Objectives
The overall objective of this study is to assess customer satisfaction in Zanzibar public transportation especially main road transportation bus (Daladala) in order to improve services provided by public bus daladala regulators.
Specific objective of Study
To assess the overall customer satisfaction in public transport bus (Daladala) services.
To quantify the quality attributes and factors that have the most influence to customer satisfaction of public transport users.
Literature Review
Previous Study
judgment that a product or service feature, or the product or service itself, provided (or is providing) a pleasurable level of consumption-related fulfillment, including levels of under- or over-fulfillment. Need fulfillment is a comparative processes giving rise to the satisfaction responses.
Customer satisfaction is determined by how customers perceive in public transport services. It has been noted that frequency, reliability, comfort, safety issues, traveling time, cleanliness and fare level are most influencing factors in customer evaluation on public transport services. [4].
Service quality [5, 6] is defined as a comparison between customer expectation and perception of service. Service quality in general consists of five distinct dimensions: tangibles (Physical facilities, equipment, and appearance of personnel), reliability (ability to perform the promised service dependably and accurately), responsiveness (willingness to help customer and provide prompt service), assurance (knowledge and courtesy of employees and their ability to inspire trust and confidence), and empathy (caring, individualized attention the firm provide its customer).
Public transport services research on customer satisfaction has been carried out by a variety of indicators or variables that affect satisfaction as indicators of comfort, safety, travel time, frequency, and reliability of public transport fare [7]. The indicators of comfort and cleanliness of the vehicle [8].
Adris et al. 2014 mentioned that there is low performance in public transportation in providing services to customers and the main indicators affect the customer satisfactions are security, travelling time, speed, transport system, travel expenses and delays. Also others indicators such as comfort and waiting time are the most significant factor affecting customer’s satisfaction in general [9].
Several studies regarding satisfaction and dissatisfaction in public transport has been conducted to develop and create attractive public transport. For instance,
Stradling et al., [10] conducted a survey by sending self-completion questionnaire in eight areas of the city of Edinburgh, Scotland. From 68 these items that were measured as “things that I dislike” or “things that discourage me from using the bus in Edinburgh”, eight underlying factors were reported. One factor was labeled as “feeling unsafe” which contain the behavior of other passengers, feeling unsafe while travelling at night and feeling unsafe while waiting for buses. Another factor were labeled as “preference of walking and cycling”, “problem with service provision like no direct route”, “unwanted arousal” (i.e., intrusions and interruptions such as inconvenience journey because of overcrowded passengers, other passenger smoking habit, and other annoyed people behavior on the bus), “preference of car use”, “cost”, “disability and discomfort”, and “low self-image” because of travelling with public transport.
Murambi and Bwisa, [11] also conducted the study to investigate the service quality and customer’s satisfaction in Kenya. A sample of 310 travelers was selected using simple sampling technique to find the influence of travelling time, booking information and frequency of route change. Their results shows that about 76% of customer’s satisfaction is explained by independent variable and travelling time, information and frequency of route change were significant to customer’s satisfaction.
Comfort, accessibility, adequacy and bus stop facilities are among the factors that influence customer’s satisfaction in public transport. According to Alphonsus [12] investigate passenger’s satisfaction with the service quality of public transport services in Abuja, Nigeria. About 300 respondents were questioned using questionnaires and result shows that comfort and accessibility have higher influence than bust stop facilities and adequacy on customer’s satisfaction in public transport services.
Khadija I. Abeid |November 2015 | Vol.3 | Issue 11 |41-51 44 and challenges of public transport are
very important to note. Public transport must be able to deliver maximum performance, so as to give satisfaction to the users of public transport. Based on the above situation it is very important to do research, so as to know the strengths and weaknesses of public transport services in order to provide strategies for improving performance of daladala operators in Zanzibar toward customer satisfaction.
Research Methodology
Research Design
This research used quantitative approach due to the nature of research problem and this method is more objective to generalize the result. The questions asked using
questionnaires concerned customer’s
opinions about public transport bus (Daladala) services. The questionnaires were administered, distributed and collected to the public end users in Zanzibar Urban area that include several routes such as; Fuoni -
Darajani, Bububu-Darajani, Kijichi-
Darajani, Kiembesamaki-Darajani,
Mtonikidatu-Uwanja wa ndege, Maungani - Darajani and Chukwani - Darajani.
The study consists 40 respondents drawn from the entire population of daladala users in urban area of Zanzibar. The dependent variable used in this study is customer satisfaction with public transport bus (Daladala) services. Independent variables are specific services quality attributes which consist of Comfort, cleanliness, travelling time, safety trips, special bus, safety a bus stops, waiting time, drivers and conductors behavior, boarding passengers, bus stop condition and transport costs. Data obtained from collected questionnaires were processed and analyzed using statistical software for social science SPSS to reveal a real situation of customer satisfaction on public transportation.
Research Findings and Discussion
The findings of the study indicate that 40 respondents that were selected from sample study, 23(57.5%) were female and 14(35%) were aged 26-36 years old, 31(77.5%) were government employee, 16(40%) had college level education and 18 (45%) were living in the center of the city as indicated in the table.Table 1: Respondents frequency by gender, age, occupation, education and place.
Frequency (%)
Gender
Male 17 (42.5)
Female 23 (57.5)
AGE
15-25 10 (25)
26-36 14 (35)
37-47 7 (17.5)
48+ 9 (22.5)
OCCUPATION
Government Employee 31 (77.5)
Private Employee 1 (2.5)
Other 8 (20)
EDUCATION
Primary 2 (5)
Secondary 4 (10)
Tertiary 14 (35)
College+ 16 (40)
Uneducated 2 (5)
Center of the city 18 (45)
Outskirt of the city 12 (30)
Suburbs 10 (25)
How People Use Public Transport Bus (Daladala)
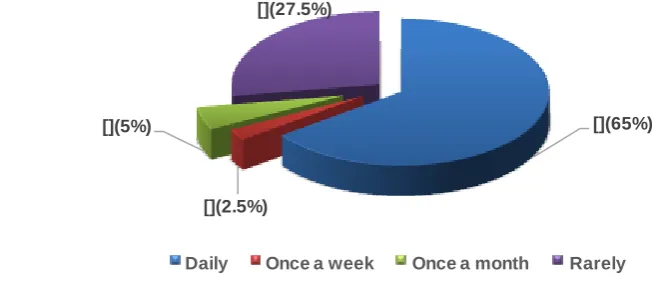
The finding of the study indicates that, 26 (65%) of respondents use public transport (daladala) daily, and 11 (27%) used public transport (Daladala) rarely and only 1(2.5%) used public transport once a week. This implies that majority of people are using
public transport (Daladala) daily as their means of transport, also in Zanzibar few people has driving licenses and access to private car . Figure below show the customers responses on how they are using public transport bus (Daladala).
[](65%)
[](2.5%) [](5%)
[](27.5%)
Daily Once a week Once a month Rarely
Figure 1: Customers frequency on using Public transport (Daladala)
Reason for Taking Public Transport Bus (Daladala)
The finding of the study shows among 40 respondents, 26(65%) are using public transport bus (Daladala) for going to work, 8(8%) are using public transport bus.
(daladala) for other reasons, 5(7.5%) are using for going to school and only 1(2.5%) are using public transport or entertainment and
shopping. Figure below shows the
respondent’s reasons for taking public bus (Daladala) as their means of transport.
Figure 2: Customer frequency on reasons for taking Public transport (Daladala)
[](65%)
[](12.5%)
[](2.5%)
[](20%)
0 5 10 15 20 25 30
Work School Shopping and Entertainment
Khadija I. Abeid |November 2015 | Vol.3 | Issue 11 |41-51 46
Travelling Time, Transport Cost, Cleanliness, Bus Stop Safety and Comfort
The above mentioned factors/services are among the variables that were analyzed in this study and the finding shows that a half of respondents 20(50%) are dissatisfied with
transport cost, 25(62%) and 34(85%) are dissatisfied with travelling time and bus stop safety and 18(45%) are not satisfied with travelling time services provided by bus operator. Table below shows the customer’s perception on Travelling time, Cost, Cleanliness, Comfort and Bus stop safety.
Table 2: Travelling time, Transport cost, Cleanliness, Comfortable and Bus stop safety.
Factor Number Highly Somewhat Dissatisfied Mean SD
satisfied Satisfied
Travelling time 40 6(15%) 16(40%) 18(45%) 2.3 0.723
Transport cost 40 8(20%) 12(30%) 20(50%) 2.3 0.791
Cleanliness 40 3(7.5%) 12(30%) 25(62%) 2.55 0.639
Comfort 40 4(10%) 20(50%) 16(40%) 2.3 0.648
Bus stop safety 40 0 6(15%) 34(85%) 1.85 0.362
However, the finding shows that a half 20(50%) are somewhat satisfied with comfort service in public transport bus (Daladala). This implies that services attribute of public bus transport in Zanzibar urban area were
unsatisfactorily perceived by
passengers/customers.
Waiting Time, Safety During trip, Boarding Passengers, Bus Stops Condition and Special Buses for Passengers
The study finding shows that, out of 40 respondents, 38(95%) of respondents are not
satisfied with bus stop condition and only 2(5%) were satisfied with this service. Also 35(87.5%) were not agreed with the bus waiting time and boarding passengers services, and 5(12.5%) of respondents were agreed with these service. However, 35(87.5%) respondents that, it is better for the government to provide special buses for student, staff and others and only 5(12%) thought that the bus should remain the same. Table below show the customer’s perception on waiting time, safety during trip, boarding passengers, bus stops condition and special buses for passengers.
Table 3: Customer’s perception on waiting time, safety during trip, boarding passengers, bus stops condition and special buses for passengers
Factor Number Yes No Mean SD
Waiting time 40 5 (12.5%) 35 (87.5%) 1.88 0.335
Boarding passengers 40 5 (12.5%) 35 (87.5%) 1.88 0.335
Safety during trip 40 10 (25%) 30 (75%) 1.75 0.439
Bus stops condition 40 2 (5%) 38 (95%) 1.95 0.221
Drivers and Conductors Behaviors
The finding of the study indicate that, out of 40 respondents, 37 (92.5%) are not accepted with the behavior of drivers and conductors. However 3 (7.5%) of the customer’s respondents were accepted with behavior of drivers and conductors. This implies that customers are not satisfied with behavior of
drivers and conductors of public transport bus (Daladala). This implies that, majority of customers/ passengers are feeling tortured, harassed by driver and conductors of public transport in Zanzibar. Figure below shows the customers perception on behaviors of drivers and conductors of public transport bus (Daladala).
Figure 3: Drivers and Conductors behaviors.
Major Problems Facing Public Transport Bus (Daladala)
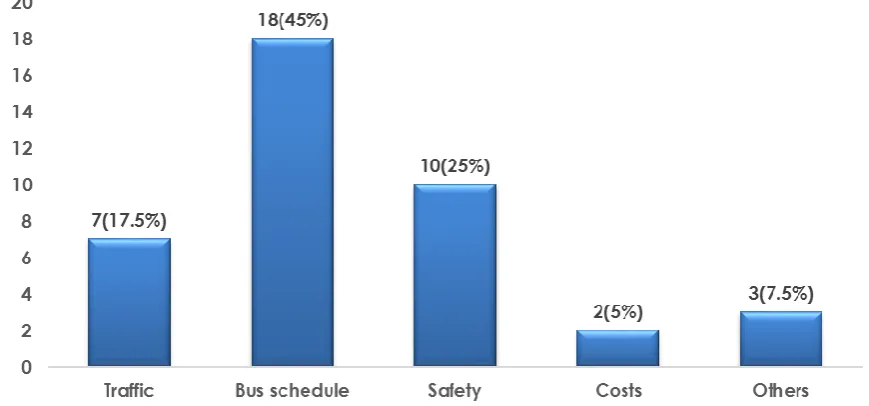
The study finds that, 18 (45%) of respondents agreed that Bus schedule was a problem faced public transport bus (Daladala). Also 10 (25%) and 7 (15.5%) agreed that safety
and traffic are the problem, and only 2 (5%) of respondents seems to agree that transport costs is the problem facing public transport today. Figure below shows the passenger’s responses on problems facing public transport bus (Daladala)
Figure 4: Problems facing Public Transport (Daladala)
The conclusion from this analysis is that, generally, customers/ passengers of public bus transport bus (Daladala) are not satisfied with service provided by bus operator in Zanzibar.
Customer’s Comments on Available Bust Stops
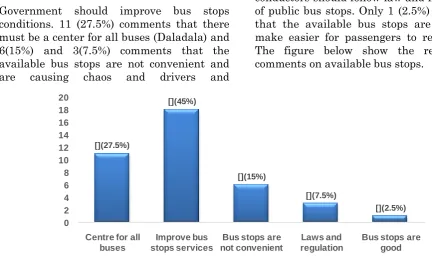
Khadija I. Abeid |November 2015 | Vol.3 | Issue 11 |41-51 48 Government should improve bus stops
conditions. 11 (27.5%) comments that there must be a center for all buses (Daladala) and 6(15%) and 3(7.5%) comments that the available bus stops are not convenient and are causing chaos and drivers and
of public bus stops. Only 1 (2.5%) comments that the available bus stops are good and make easier for passengers to reach them. The figure below show the respondents comments on available bus stops.
[](27.5%)
[](45%)
[](15%)
[](7.5%)
[](2.5%)
0 2 4 6 8 10 12 14 16 18 20
Centre for all buses
Improve bus stops services
Bus stops are not convenient
Laws and regulation
Bus stops are good
Figure 5: Customers comments on available bus stops
Customer’s Suggestions
The finding show that, 12(30%) of respondents suggest that the government must improve transportation system, 8(20%) suggest that police should force drivers and conductors to follow transport laws and
regulation and 5(12.5%) suggest that there should be a public transport authority and one stop for all buses. Figure below represents the customer’s suggestions on public transport bus (Daladala).
Figure 6: Customers suggestion
Regression
The overall satisfaction score were further regressed on the Twelve (12) factors that affects customer satisfaction in public
Table 4: Regression
Unstandardized Coefficients
Standardized Coefficients
t Sig.
B Std. Error Beta
(Constant) .284 1.120 .253 .802
Travelling time .198 .147 .259 1.351 .188
Transport costs
.008 .159 .011 .047 .963
Cleanliness .060 .163 .069 .366 .717
Comfort .309 .182 .362 1.701 .100
Waiting time .217 .268 .131 .809 .425
Boarding passenger -.341 .326 -.206 -1.045 .305
Safety during the trips .211 .222 .167 .953 .349
Bus stops condition .300 .432 .119 .694 .493
Special buses for students, workers and
others .142 .281 .086 .505 .618
Conductors and drivers behaviors .028 .398 .014 .071 .944
Safety at bus (daladala) stops
-.043 .252 -.028 -.173 .864
Dependent variable: Overall, how satisfied are you with public bus (daladala) services. Rsq = 0.408, Adjusted Rsq = 0.175.
The overall satisfaction model for public transport bus (Daladala) services = 0.284 + 0.198(Travelling time) + 0.008(Traveling cost) + 0.060(Cleanliness) + 0.309(Comfort) + 0.217(Waiting time) + (-0.341) (Boarding passenger) + 0.211(Safety trips) + 0.300(Bus stop condition) + 0.142(Special buses) + 0.028(Conductors and Drivers behaviors) + 0.043(Safety at bus stop).
The above equation shows that, the slope of the regression line is 0.284, indicating that overall satisfaction tends to increase as other factors/services increase. The equation also shows that the overall satisfaction of public transport bus (Daladala) services by customers/passengers in Zanzibar will be 0.284 percent when all 12 services quality attributes are at the zero level. However, the standard regression coefficient beta (β) values indicate that the “comfort” (β= 0.309, p= 0.10), “bus stop condition “(β= 0.30, p= 0.493), “waiting time” (β= 0.217, 0.425), “Safety trips” (β= 0.211, p= 0.349), has great impact on customer overall satisfaction of public bus (Daladala) transport services in Zanzibar. It is followed by “travelling time” (β= 0.198, p= 0.188) and “Special buses” (β=
0.142, p= 0.618), with “travelling cost” (β= 0.008, p=0.963), “cleanliness” (β= 0.060, p= 0.717), “boarding passengers” (β= -0.341, p= 0.305), “conductors and drivers behaviors” (β= 0.028, p= 0.944) and “safety during trips” (β= -0.043, p= 0.864) having the least impact on customer satisfaction in Public transport services.
Since the study use two side t-statistic to test the hypothesis, the degree of freedom df = 27, n=40 and k-12-1. Therefore, (t calculated) tc < tk (actual t from the table) we reject a null hypothesis at = 0.05 level. This implies customers are not satisfied with public transport bus (Daladala) services provided by public transport bus (Daladala) regulators in Zanzibar.
Khadija I. Abeid |November 2015 | Vol.3 | Issue 11 |41-51 50 The underlying factors (services) identified
are traveling cost, traveling time, comfort, boarding passengers, bus stops condition, cleanliness, safety during trips, waiting time, special bus and conductors, safety at bus stops and drivers behaviors. Therefore, the study then suggests the way for public transportation operators in Zanzibar town area for improving public transport bus (daladala) services may be identified and customers/passengers satisfaction services may be enhanced.
Recommendations
It is recommended that,Public bus (daladala) service provider and regulators should invest their resources on improving quality of services delivered.
Adequate services on public transportation should be provided to passengers whenever it is needed.
Public bus owners should increase their effort to sustain the satisfaction by cleaning their vehicles, treating customers well, follow transportation laws and regulation.
Public transport bus (daladala) services regulator should engage in checking
periodically so that to make sure the problem facing public transport bus (daladala) owners are solved and customers are getting appropriate services they need on public transportation.
To avoid bus transport schedule problem, the Government should make a reform that provides complete servicers to public transport bus system.
Lastly, another major research should be conducted for whole regions in Zanzibar so that to know the major problems faced public transport end users and find the way of solving these problems in general.
Acknowledgement
I would like to thank all people whom without their assistance it would have been very difficult for me to successfully complete this work on time. Though I might not be able to mention all of them here due to time and space but I must as much as possible acknowledge the contribution of those so material. My special thanks are given to my workmates who helped me from beginning to the end of this work. Thank you very much for your helps that you are giving me.
References
1. Khurshid R, Naem H, Ejaz S, Mukhatar F, Batool T (2012) Service quality and customer satisfaction in public transport sector of Pakistan: An empirical study. International Journal of Economics and Management, 1 (9):24-30.
2. Beirão Gabriela, Sarsfield Cabral (2007) Understanding Attitudes towards public transport and private car: A qualitative study. Transport Policy, 14:478-489.
3. Oliver Richard L (1997) Satisfaction: A Behavioural Perspective on the Consumer, New York: McGraw Hill.
4. Margareta Friman, Markus Fellesson (2009) Service supply and customer satisfaction in public transportation: The quality paradox. Karlstad University, Sweden. Journal of Public Transportation, 12(4):57-69.
5. Parasuraman A, Zeithaml VA, Berry LL (1988) SERVQUAL: A multiple-item Scale for
measuring consumer perceptions of service quality. Journal of Retailing, 64(1).
6. Grönroos Christian (1984) A Service Quality Model and Its Marketing Implications. European Journal of Marketing, 18(4):36-45. 7. Tyrinopoulos YG, Aifa dopoulou (2008) A
Complete Methodology for the Quality Control of Passenger Services in the Public Transport Business. European Transport\Trasporti Europei 38:1-16.
8. Eboli L, Mazzulla G (2007) Service Quality Attributes Affecting Customer Satisfaction for Bus Transit. Journal of Public Transportation 10:21-34.
10. Straddling S. Careno M, Rye T, Noble A (2007) Passenger Perceptions and Ideal Urban Bus Journey Experience. Transport policy, 14.
11.David Nyongesa Murambi, Henry M. Bwisa (2014) Service quality and customer satisfaction in public transport sector of Kenya: A Survey of shuttle travelers in kitale terminus. International Journal of Academic Research in Business and Social Sciences, 4(9):1-11.