West, M; IT Metrics and Productivity e-Newsletter Series: Getting Performance Through Process Improvement Page 1 of 5 IT Metrics and Productivity e-Newsletter Article Series:
Getting Performance From Process Improvement
By Michael WestArticle 3: Improving Performance Through Process Improvement
In the first two articles in this series, we explored the challenges faced in linking process
improvement to business performance, and what it means to improve process. This article will help you begin to understand how to structure, at least qualitatively the connection between process improvement and business performance improvement. This article does not get into the math and statistics of process performance models (PPMs) or the number crunching that you would employ in statistical process control; it starts out more fundamental than that. Numbers lead to answers, but before you can seek answers you first need to know what questions to ask; this article will help you begin to form those questions.
Prior to the industrial age, much of an enterprise’ success was dependent upon factors beyond the control of the people running the business. If your enterprise was farming, your success was in great part dependent upon the weather of the growing season. If you were a merchant, your success was dependent upon market forces (or tradewinds or pirates) that could not have been systemically seen or understood in the times. However, since the beginning of the industrial age and into the information age, there have been exactly three things you could do to improve business performance:
1. Improve workers by improving their knowledge and skills and thus, presumably their efficiency and efficacy
2. Improve technology 3. Improve process
At the core of all improvement initiatives, what the organization is really trying to do (or should be trying to do) is make improvements in one of these three areas. Perhaps not understanding this causes many organizations to not achieve their improvement objectives; they don’t know exactly what it is they’re really trying to improve. You may say you want to improve “time to market,” but why (see the first article in this series)? And once you figure that out, figure out what it is you’re trying to improve about time to market: workers’ skills and knowledge, technology, the processes, two of the three, or all three? Simply put, you have little chance of measuring improvement if you don’t understand what you’re trying to improve. And you have very little chance of understanding how your million dollar
improvement initiative affected business performance if you don’t understand the relationships between the three forms of improvement and organizational performance.
A lack of understanding of the relationships between people, process and technology also muddies the water when it comes to reporting results from improvement initiatives, and it enables organizations to make unsubstantiated claims of “success” from their process improvement initiatives. It is almost
West, M; IT Metrics and Productivity e-Newsletter Series: Getting Performance Through Process Improvement Page 2 of 5
process, I then have to train people in their use, thus I’ve improved worker skill. If I’ve use a new web-based interface for access and use of the process representations, have I also not improved my
technology? Which improvement yielded the performance results?
Business organizations are not clean-room labs in which we can control all the variables that might influence our improvement experiment. So why aren’t we just honest with ourselves about the results? Instead of claiming that “our process improvement resulted in a five percent efficiency gain,” why don’t we candidly give the whole story: “Although the process changes were accompanied by minor changes in technology and worker knowledge, we believe there is a high correlation between the implementation of the new processes and a five percent efficiency gain.” The problem with providing the entire context is the information industry manager who doesn’t want all those words; she or he wants a red-yellow-green stoplight chart.
Further complicating the problem of not understanding what it is we’re improving (people, process, or technology) to achieve performance improvement, we often improve one dimension but then measure another dimension. For example, if improve the quality our processes, but then measure the quality of our product, how can we possibly quantize the relationship between action and results? The solution is simple: Improve what we will measure, and then measure that which we improved. If we improve processes but then measure project or product performance, our measures are “muddled” and results are speculative at best. When we improve processes and measure processes, we reduce the variability of influencing factors, and our measurement information is more meaningful.
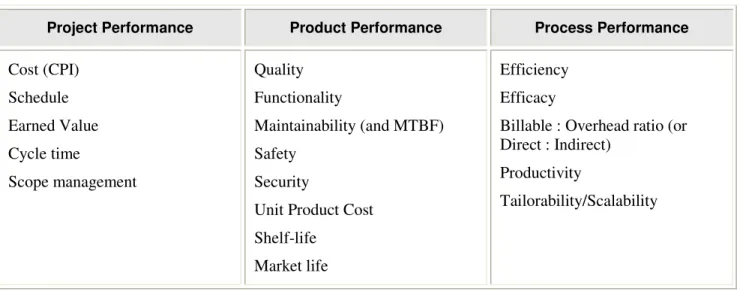
One of the first mistakes organizations often make in muddling their measures is failing to classify the measures in the same three buckets in which they intend to make improvements. Table 1 below identifies some of the typical performance measures organizations collect. However, what this table does – that organizations often fail to do – is to associate the measures with the area of improvement in project, product, or process.
Table 1. Classifying performance measures with their associated areas of improvement
Project Performance Product Performance Process Performance
Cost (CPI) Schedule Earned Value Cycle time
Scope management
Quality Functionality
Maintainability (and MTBF) Safety
Security
Unit Product Cost Shelf-life
Market life
Efficiency Efficacy
Billable : Overhead ratio (or Direct : Indirect)
Productivity
Tailorability/Scalability
Once we measure that which we improve, if we then want to correlate process measures to project or product performance measures, we can do so, and we’ll have a more imperical basis for the correlation.
West, M; IT Metrics and Productivity e-Newsletter Series: Getting Performance Through Process Improvement Page 3 of 5
But now back to process improvement. We can and should define effects that improving our processes have on our business performance. If we understand these relationships, we can make more rationale business decisions about how and where to spend our improvement dollars. For example, if you could guess that a million dollar change to process could get you a 1.5X result, whereas the same
investment in technology could get you a 2X result, and assuming you only have the one million dollars to spend, wouldn’t knowing the greater ROI influence your investment decision? Even just sticking to process improvement, how would you spend your money if you could reasonably guess that a $100K change to process performance would yield the same benefit as a $500K change to the defined (written) processes?
So let’s begin to look at some simple ways to answer these questions. Again, this article doesn’t go beyond a qualitative analysis. If you or your boss has to have numbers, you’re going to have to assign those numbers yourself.
One of the simplest ways to understand the relationships between process improvement and business performance is to chart it in a simple analysis matrix like the one shown in Table2. This table provides examples of activities that can be considered process improvements, the correlating expectation in a business performance enhancement resulting from the improvement, and a description of the relationship between the improvement and the business performance results.
Table 2. Example of efining the relationships between process improvement and business performance
West, M; IT Metrics and Productivity e-Newsletter Series: Getting Performance Through Process Improvement Page 4 of 5
Process Improvement
Expected Business
Performance Improvement Relationship
Improve project risk management practices
Projects perform within estimated budgets
Effective risk management practices can mitigate the impact of risks that cause over-spending Define test procedures Reduce the number and density
of defects in released products and subsequently increase customer satisfaction
Missed or incorrectly performed steps in testing causes product defects to go undetected
Develop a standard for product requirements and use that standard to review requirements
Reduce the cost associated with rework in product design and development
Design and development rework has been attributed to poor requirements
Introduce standards for conducting meetings
Reduce operating costs There is cost associated with meetings that do not result in defined decisions, actions, or outputs
Implement an organization-wide lessons learned
Reduce operating costs There is signficant cost
associated with individuals and teams relearning things that have been previously learned by others
The most important element in developing this information is defining the relationships in the third column. If you and others find it difficult (or impossible) to descripe the relationship between process improvement and business performance, maybe you should accept that there isn’t a relationship and move on.
Don’t do this in a vacuum; round up people from multiple disciplines in your organization. Also, don’t just use a bunch of managers or people who aren’t busy at the moment. Staff this working group with people who are familiar with the processes, the technology, and the skills involved in the business area you want to improve. For example, if I wanted to improve call center response time (so that I could improve customer satisfaction and reduce call center paid overtime; see the first article in this series), I would staff my improvement working group with the person who knows the CRM system inside and out, the person who wrote the call center procedures, a person who didn’t write the call center procedures but has to use them, and someone who knows the skills needed for operating the technology and performing the processes to the extent that she or he is probably a trainer. In other words, staff this working group with real subject matter experts, not just the bosses who may have lost touch with the work they supposedly manage.
Although this series of articles have provided much guidance in how to get performance from process improvement, the quest for brevity in representing this information means that these articles have only
West, M; IT Metrics and Productivity e-Newsletter Series: Getting Performance Through Process Improvement Page 5 of 5
dealt with this voluminous topic in a superficial way. However, if you’re the kind of person who has no patience for the long story and just wants the punch-line or the ending, here’s your take-away list. To better ensure process improvement results in business performance improvement:
1. Either let go of or scrutinize your beliefs about the relationship between process improvement and business performance improvement.
2. Don’t tamper with the system … know what to improve, know what to leave alone, and why in both situations.
3. Improve what you intend to measure, and then measure that which you improve.
4. Connect process improvement to performance improvement by defining the relationships between the two.
5. Measure the effects of process improvement on business performance and, in doing so, learn how to not lie to yourself.
As of the writing of this series of articles, the American economy is still struggling to emerge from a severe recession. As business leaders, we need to reflect on our individual decisions and actions that led us into that recession, and the decisions and actions that can lead us back to a place of economic strength. If in today’s world you still think it’s a good idea to throw money at process improvement and not know or care what the performance results you and your stakeholders should expect, then you haven’t