Volume III (2014), Page 95- 110
THE REVIEW FOR THE USE OF URBAN CLIMATIC MAP IN THE LAND USE PLAN FOR URBAN PLANNING
Illyani Ibrahim1, Azizan Abu Samah2 and Rosmadi Fauzi3
1
Kulliyyah of Architecture and Environmental Design INTERNATIONAL ISLAMIC UNIVERSITY MALAYSIA
2&3
Faculty Arts and Social Sciences UNIVERSITY OF MALAYA
Abstract
Urbanization leads to positive and negative impacts on the society. While it accelerates economic growth, it also brings negative impact to the environment and people‘s health. The growth of urbanization is unavoidable; therefore, sustainability needs to be maintained to preserve the liveability of urban dwellers. The intention of this study is to review the use of climatic information in planning future developments in the local land use map. The studies of content and interview method were done in order to understand the real situation of this environmental mitigation. In further, the identification of the gaps of e study. The findings of this study were used to propose the climate indicators for the existing land use map. Future studies may focus on conducting preliminary experiments to apply the urban climatic map in the local context.
Keyword: urbanization, climate, urban climatic map, indicators, spatial planning
1 Lecturer at Department of Urban and Regional Planning. Email : [email protected] 2
Professor at Department of Geography, Faculty Arts and Social Science, UM, Malaysia. Email :[email protected]
INTRODUCTION
As the capital city of Malaysia, Kuala Lumpur is densely populated. The city has been showing signs of environmental problems due to the urban activities (Burghardt, Katzschner, Kupski, Chao, & Spit, 2010). The integration of public transports, infrastructures and tall structures, along with massive migration has further reduced the gaps between spaces. Hence, proper mitigation is necessitated in order to sustain the liveability of the city. Many mitigations are focusing on greenhouse gases (Kondoh, 2007; Rosenfeld et al., 1995). Only few studies have focused on the local climate conditions (Schwarz, Bauer, & Haase, 2010)
Urbanization gives positive and negative impacts to society. While it accelerates economic growth, it also brings negative impact to the environment. Warmer air temperature alters urban microclimates and imposes various negative effects on public‘s health; it also specifically causes environmental problems by intensifying heat waves, deteriorating air quality and increasing the occurrences of flood (Kondoh, 2007). Another related UHI problem is thunderstorm (Ahmad Fuad Embi & Norlida Mohd Dom, n.y.; Bornstein & Lin, 2000).
Urban climate is a function of urban structure and activity (Netzband, William, & Redman, 2007). Hence, the integration of information from many sources, such as from remote sensing imageries and climatic datasets, can give beneficial understanding to planners. In Germany, there is a legal requirement that developments should not worsen the climatic condition of a site (Ng, 2009). By using climate analysis, future developments can be planned by considering climatic conditions. However, it is crucial to note that such an analysis needs to be less complicated, and the approach to simplifying version of climate so that the results understandable by the planners. In the context of this study, several issues need to be identified; data scale and data types are among the important aspects that need to be considered before climate analysis is conducted for this study.
THE USE OF URBAN CLIMATE INFORMATION IN URBAN PLANNING
The integration of urban climate‘s information and environmental planning is a new approach to conducting an urban planning study. Urban climate might be a complex concept to urban planners, who often play the role of policy makers. However, urban climate can be made simplified by translating a scientifically sound data into spatial-based analysis. This paper, hence, will draw the attention from local planners to apply climatic dataset for future developments. This application was pioneered in Germany where climatic information was applied from the merging between a local urban planning and the Environmental Department (Burghardt et al., 2010; Urban Planning in the Essen Municipal Germany, 2010). In Hong Kong, air ventilation assessment was established by the Hong Kong government (Chao, Ng, & Katzschner, 2011; Ng, 2009; Ng, Chao, Katzschner, & Yao, 2009) since 2003, which saw the country being hit by severe acute respiratory syndrome (SARS) that had claimed many people‘s lives(Ng, 2009).
The understanding of applied climatology information is crucial in the urban planning study. Data, either from meteorological stations or mobile monitoring systems can provide an empirical base for investigations of the spatial and temporal structure of the urban heat island (Souch & Grimmond, 2006).
Higher temperatures in these decades have aroused the interest of researchers from all over the world. In London, the earliest historical works on UHI are well-documented (Howard, 1833). Since then, many scholars work on observing UHI with different themes by investigating the pattern, establishment of intensity, trends, and model and system development. Climatic mitigation can be a part of a sustainable urban development process. Additionally, several studies have proposed the process of utilizing climatic information for an urban planning work (Alcoforado, Andrade, Jing-feng, Lopes, & Vasconcelos, 2009; Burghardt et al., 2010; Chao et al., 2011; Ng et al., 2009; Ng, Katzschner, & Wang, 2007).
sustainability‘ to ‗very weak sustainability‘. To achieve sustainable urban development, cities must be planned and managed to form a balance between the needs of a human being and that of a natural environment by carefully using resources and transferring them to the next generation.
Depending on their methods, different practices use different indicator (Shen, Ochoa, Shah, & Zhang, 2011). In this study, indicator is an important key to understanding environmental problems. (Mega & Pedersen, 1998) claimed that indicators must be clear, simple, scientifically sound, verifiable and reproducible. Additionally, the indicator selected must be appropriate in order for appropriate planning framework to be designed to mitigate a problem, such as the indicators that were conducted by (Ibrahim, Abu Samah, & Fauzi, 2013; Mega & Pedersen, 1998; Oliver, Shaharuddin Ahmad, Kadaruddin Aiyub, & Yaakob Mohd Jani, 2011).
Local and abroad urban planning studies related to remote sensing are delineated. In the local context, the urban planning studies have focused on identifying land cover change and urban sprawl (Noorzailawati Mohd Noor, Alias Abdullah, & Manzahari Nasrul, 2013; Noorzailawati Mohd Noor & Nur Aulia Rusni, 2013). According to (Oliver et al., 2011), air pollutants are likely to circulate in an urban environment due to UHI and hence, the pollutants in this area are consistently high compared to the ones in the surrounding area (Sani, 1989).
According to a study by the local government, the NUP guidelines (National Urbanization Policy, 2006), which was prepared by JPBD, has listed important indicators that are worthy of consideration. The urban heat island is also listed among the indicators (Indicator 26), but has not been analysed in the local government‘s study due to limited information. This policy creates a gap in knowledge, which the present study aims to fill in by proposing a suitable mitigation. One scholar, Sani (1990), was also aware that the transferring of the research results from temperate regions to the tropics needs to be considered in future studies.
ENVIRONMENT CONSIDERATION IN LOCAL AUTHORITY
context, most of the climatic information have been used in meteorology, environment and drainage irrigation departments. It was only in recent years that the awareness of using climatic information has been merged with local urban planning. However, the focus has been on climatic change particularly on GHG problems (Joseph, 2012; Ministry of Natural Resources and Environment Malaysia, n. y.). As for this study proposes an application to use climate information in land use maps as the added value of how climatic conditions relate to land use.
However, the UHI phenomenon is complex and various departments should involve in mitigating this problem. Accordingly, the interdependency between departments is crucial to ensure that the objective of the program is fulfilled. In this case, UHI is closely related to the environment, particularly to air and atmospheric conditions. Therefore, departments such as the Department of Environment (DOE) and the Town and Planning Department (JPBD) should be involved in the decision-making. DOE is a department that houses experts in environment, whose roles are to advise and give consultations on environmental conditions. Any condition needs to be reported to JPBD, who is responsible in making policies and executing decisions.
Owing to limited knowledge on urban climatology, they have less ability to adopt and transfer the climatic knowledge in planning, application, and design (Chao et al., 2011). Thus, it is crucial to have relevant training and education on urban climatic application and climatic spatial planning for the local authority.
URBAN CLIMATIC STUDIES FROM ABROAD
Further literature (Table 1) will focus on the urban climatic studies that were done in the abroad.
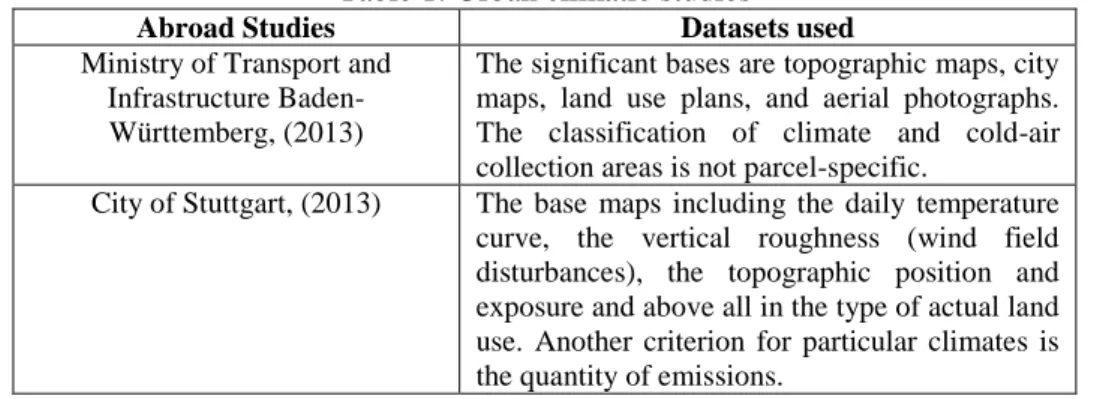
Table 1: Urban climatic studies
Abroad Studies Datasets used
Ministry of Transport and Infrastructure Baden-Württemberg, (2013)
The significant bases are topographic maps, city maps, land use plans, and aerial photographs. The classification of climate and cold-air collection areas is not parcel-specific.
Chao, Yan-yung, & Lutz, (2010); Town Planning Board, (2011)
Using the urban climatic zones, thermal environment and air ventilation conditions within the urban canopy layer
Mora, (2010) The climate are based on the variation of climatic factors as a result of topography and land cover
Ng, Lutz & Wang, (2007) Develop urban climatic map and standards for wind environment
RELATED WORK IN LOCAL STUDIES
Scholars Policy/ Guidelines
Hussien, (1989)
Historical of greening – In 1988, Alfred Venning as the state treasurer of Selangor (formerly a planter in Ceylon) proposed to build a botanical garden, known as Taman Tasik Perdana. Its maiden name was ‗Sydney Lake‘, officially named by Clementi Smith on 13th
May 1889, as a starting point of the city green programme.
Hussien, (1989)
1973 – The first greening program – establish City Hall Beautification Unit in 1979.
Tree Planting Program – 1972 – The planting breakdowns are as follows; roadside – 50%, open spaces (30%), public parks (10%), car parks (5%), buffer zone (5%).
Since 1972, the city has planted approximately 231,000 trees specifically for shade.
Public park – play space – minimum of 0.3 hectare (0.75 acre) and to provide with a standard of 0.12 hectare (0.3 acre) per thousand pop. Play area- minimum of 1.4 hectare (3.5 acres) and to be provided with a standard of 0.2 hectare (0.5 acre) per thousand pop.
Sport facility – a minimum standard provision of 0.3 hectare (0.8 acre) per thousand pop.
Local parks and gardens – apply a standard of 0.16 hectare (0.4 acre) per thousand population.
Mahesan, (1993)
Open space requirement: 667.0 hectares (2.75% of total area). Excluded private recreational open space, only about 468.6 hectares (1.94%) of the total area)-1acre per 1000 population (inadequate) Yunos, (1993) Greenery programme; roadside 50%, open space 30%, public parks
10%, buffer zones 5%, car parks 5%.
Vision: open space Master Plan – to identify new priorities for new parks, open spaces, recreational programme etc.
Sani, (1995) The misunderstanding that used to arise with the greenery area is the assumption that the grass cover or shrub is enough to moderate the temperature. This current research, showed that the grass surface is better than the cement surface and tail, but the grass surface becomes dry fast in the afternoon and is not able to decrease the UHI intensity (Sani, 1986b).
Yeang & Hamzah, (1995)
The lowering of energy consumption would further reduce the overall emission of waste heat thereby lowering the overall heat island effect on the locality. This study proposes to design climatically-responsive tall buildings in the tropical high rise area
WWF Malaysia, (2001)
Indicator either we have achieved some balance between natural and built environment. Depends on the presence of medium sized trees, tree density and the heterogeneity of the habitat.
Selangor Structure Plan, (2002)
Planning Standard & Planning Park on the Roof Planning Standard Open Space and Recreational Area
JPBD, (2002a)
Landscape
Total of green area - 40% from the development Individual green area – 10% from development Open Green area – 15% from development Individual green area – 30% from individual lot Buffer green area in lots – 6m
JPBD, (2002c)
Public garden – public park, public sport, leisure place (Town and Country Planning (Amendment) Act 1995, Act (A933).
Provide 10% open space and recreation for developments such as; housing, commercial, industrial, mixed, tourism, institutional development.
JPBD, (2002b)
10% of open space out of the entire development area.
JPBD, (2002h)
Green network – connect the parks in towns such as Linear Park and Town Park. As a buffer zone to control pollution etc.
JPBD, (2002d)
Man-made lakes: Former Mining Lakes, Reservoir, engineered lakes Natural Lakes: Swamps, lagoons, oxbow lakes, lake zone
Control development proposed for the lake area to prevent any negative effect – by creating zone system
JPBD, (2002e)
To retain stormwater and alleviate floods in the urban areas Minimum size of pond 0.3 hectares (3 or 5% of total area)
A pond use to retain water for several hours before flow to drainage system and rivers.
JPBD, (2002f) Of-top gardens are permitted in condominium housing development that exceeds 0.81 hectare in area.
(No albedo/roof colour has been assigned in the guidelines) The location of air conditioning needs to be appropriately stated. JPBD,
(2002g)
Size of landscape that was proposed is 2.5m x2.5m and provided for every 2 to 4 bays.
(enteroboliumsaman), saga (adenantherapovonica), tamalan (Delbergia), Jambu laut (Eugenia grandis), pokok kaya (khayagrandis), pokok pasai (miliaazedarach), semarak api (delonixptecocarpum). (parking lot need to be planted with grass so the water easily absorbs to the soil)
JPBD, (2004) b) able to identify and measure the problem and the quality of the town; environment programme; provision of environmental programs, provision for landscape index of water quality, discharged solid waste discharged, noise complaints, waterborne diseases per 1000 population.
National Urbanization Policy, (2006)
A sustainable and environmentally friendly development shall form the basis of environment conservation and improve the urban quality of life. Measure (iii) encourages development that reduces the impact of UHI.
JPBD, (2006) Detention pond as open space
Open Space and Landscape – 10% from development Buffer green
Ismail, Samad, & Rahman, (2008)
Green roof able to reduce global effect; global warming and local effect, UHI.
It is known as passive techniques in reducing energy consumption and thermal performance in buildings.
Razali, (2009) Study of temperature and relative humidity between open exposed sun, water based area and greenery area on human activities are performed. Abdullah,
Saito, & Said, (2011)
The parameter to be considered is the leaf area index which consists of tree height, planting species, planting distance and canopy area as well as plot for building envelope.
JPBD, (2012) Green neighbourhood guidelines; proposing of pedestrian walkway study, plant trees, green buildings, brownfield and infill development etc.
RESULTS
From the analysis that was done in this study, there are gaps that need to be bridge among the climate data and the local urban planner. Further sections will focus on the indicators measure for climate development. Then, the proposed climate map for the local area will be elaborated. The last section proposes the conceptual framework for future directions of the research.
i) Indicators measures for urban climate development
This section is important to be understood by the local authority regarding the need of developing new techniques to moderate air temperature, and improve the health and comfort of human inhabitants in urban areas. A so called remote sensing and climatic analysis for use by urban planners need to be proposed from the collaboration with DOE. Several important indicators in this subject need to be considered. The following are the proposed indicators for UHI measures:
1. Land Surface Temperature image
2. Air temperature 3. Land use map 4. Wind direction 5. Climatopes
Climatology
Urban climate mapping for urban planning Bridge the
gap Urban planning
Bridging the gaps;
Urban planner should understand on the climatic map
i) Land Surface Temperature image–This indicator is retrieved by using remote sensing imagery. It is measured by using thermal band and modelled by using an appropriate algorithm (in this case, by using Qin et al.‘s (2001) mono window algorithm). Nevertheless, Schwarz, Bauer, & Haase (2010) have proposed that policymakers apply the following algorithm to thermal band to show the thermal emission between land uses:
[ ] ( )
( )
ii) Air temperature - The in situ measurement can be carried out by using mobile temperature several times. The measurements are then averaged to identify the mean temperature of a particular site.
iii) Land use map – The land use map will be overlaid on the other indicators and the resulting analysis needs to include the local climatic analysis, which indicates the polluted areas and the heat island status in such areas.
iv) Biophysical factors: LAI, elevation, albedo – Green areas is one of the most important parameters to be understood. However, the ability of such green areas to moderate air temperature also depends on the area‘s elevation, leaf area index (LAI) and coverage area. In this case, the mean average of parameters of such green areas need to be identified; also requiring identification is how far such mean temperature is able to cool the environment.
vi) Wind direction – this indicator is used for accessing surface roughness and topography. This data is important to mitigate which areas contain a cooling factor.
ii) A proposal to develop a climatope map for local areas
According to the climatic map analysis, different scenarios can be developed to identify the worsening, improving or maintaining scenarios if a development is to be undertaken. A climatic map is able to show several options that need to be performed for a particular development.
Several indicators need to be used in order to design a climatope map according to the local climate of hot and humid weather. It is proposed that a zoning climatope map be designed according to the existing land use map. This study proposes the use of the existing climatope types as the ones used by the local government of Essen. The important climatopes are as follows:
1. Water climatope – Water climatope is one of the important land covers that are able to moderate the surrounding temperature. It is characterized by high levels of air humidity and wind, whereas air temperatures are lower during the day and higher during the night compared to the surrounding areas.
2. Open Space climatope – These areas are characterized by very small changes in wind flow and very few trees. Examples include playing fields and golf courses.
3. Forest climatope – These areas have very thick canopy layer of trees and are able to moderate air temperatures. Relatively, they have low temperatures and higher air humidity due to shading and evaporation during the day and mild temperatures during the night. Shading from thicker canopy layers helps to lower the temperature at walkways and the surrounding areas.
4. Green spaces climatope – These areas usually have thick canopy layers of trees and the resultant shading improves the air temperature of the walkway and surrounding areas. This category includes parks and gardens. The category of green space will also be referred to the LAI index (a higher LAI represents a dense canopy layer and vice versa).
5. City Border climatope – These areas have a good climate with a weak UHI, usually in built areas with one or three-storey buildings. 6. City Climate climatope – These areas have dense buildings and are
pronounced as warm islands, which shows a bad bio-climate.
8. Commercial area climatope – This climatope is usually present under a dense development. It has heat island effect and low air humidity. This area is dry, has noise pollution and pollutants with high soil sealing.
9. Industrial area climatope – These areas exhibit higher emissions with a high air pollutants and noise. The air masses near the ground are warm, dry, and enriched with pollutants. The grounds of the buildings are warmer, which can significantly alter the wind field. 10.Deposit site climatope – These areas have much wind and it is
warmer at night at the border, and this is different from the south and north aspects. The south aspect is warmer.
11.Deposite site (with vegetated area) climatope – These areas equalize north and south areas due to the existence of vegetation areas.
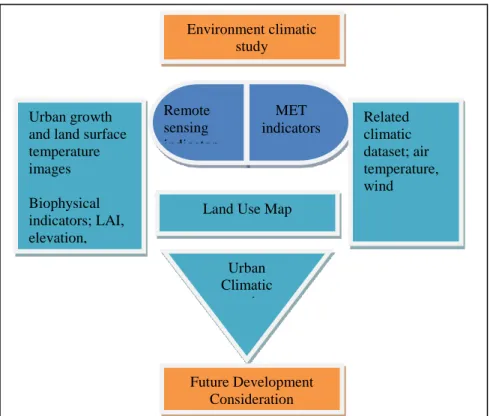
iii) A Conceptual Framework for A Future Research
Figure 1: Conceptual Framework for Urban Climatic study
DISCUSSIONS
Urban climatic mapping is important because it uses important climate indicators for proposing the appropriateness of future developments. The importance of understanding urban climate, specifically of the local urban environment is crucial. Bridging the gap between the complexity of urban climate and urban planning is an important task to be achieved. In fact, the urban climate information can be simplified to be understood by planners.
CONCLUSIONS
It can be concluded that it is important to the local authority to start to use the local climate measures in order to ensure the appropriateness of planning for future development. It is crucial to use climatic conditions in an urban planning study. This study acts as a preliminary study of proposing the use of climatic variables in local urban planning. Future study may focus on the experimental work of the adopted climate variables in land use planning.
Environment climatic study
Remote sensing indicator
MET
indicators Related climatic
dataset; air temperature, wind Urban growth
and land surface temperature images
Biophysical indicators; LAI, elevation, albedo
Land Use Map
Urban Climatic
study
ACKNOWLEDGEMENT
The author would like to thank the Essen Municipal for the interview. Appreciations are also forwarded to the Ministry of Education (MOE) for the study fund, and the Department of Environment (DOE) Malaysia, Malaysian Meteorological Department (MMD) and Town and Planning Department (JPBD) Malaysia for supplying the data.
REFERENCES
Abdullah, F., Saito, K., & Said, I. (2011). Assessment method of green plot ratio in balancing temperature of the Central Business District of Johor Bahru, Malaysia.
Ahmad Fuad Embi, & Norlida Mohd Dom. (n.y.). Urban heat islands effects on the microclimate of Malaysian cities.
Alcoforado, M. J., Andrade, H, Jing-feng, H, Lopes, A, & Vasconcelos, J. (2009). Application of climatic guidelines to urban planning : The example of Lisbon (Portugal). Landscape and Urban Planning, 90, 56-65.
Bornstein, RD, & Lin, QL. (2000). Urban heat islands and summertime convective thunderstorms in Atlanta: three case studies. Atmospheric Environment, 34, 507-516.
Burghardt, Rene, Katzschner, Lutz, Kupski, Sebastian, Chao, Ren, & Spit, Tejo. (2010). Urban climatic map of Arnhem city.
Chao, R., Yan-yung, N. E., & Lutz, K. (2010). Urban climatic map studies: a review. International Journal of Climatology.
Chao, Ren, Ng, Edward, & Katzschner, lutz. (2011). Urban climatic map studies: a review. International Journal of Climatology, 31(15), 2213-2233.
City of Stuttgart, O. f. E. P., Section of Urban Climatology. (2013). Urban Climate Stutgart.
Foxon, T. (2002). Sustainability Criteria for Decision Support in the UK Water Industry. Journal of Environmental Planning and Management, 45(2), 285-301.
Howard, L. (1833). The climate of London, deduced from meteorological observations, made in the metropolis and at various places around it.
Hussien, A. (1989). The role of city hall in improving the quality of urban green in Kuala Lumpur.
Ibrahim, Illyani, Abu Samah, Azizan, & Fauzi, Rosmadi. (2013). Biophysical factors of remote sensing approach in urban green analysis. Geocarto International. doi: 10.1080/10106049.2013.859306
Ismail, A., Samad, M. H. A., & Rahman, A. M. A. (2008). Green roof technology: A strategy to reduce the impact of global warming.
Joseph, M. H. L. (2012). A study of greenhouse gases reduction plan in a Malaysian home. SEGi Review, 5(1), 1985-5672.
JPBD. (2002b). Detention pond area as part of Open Space. JPBD. (2002c). Open Space and Recreation Public Garden. JPBD. (2002d). Planning Guidelines and Standards Lake Areas.
JPBD. (2002e). Planning Guidelines Detention Pond area as part of open space. JPBD. (2002f). Planning Standards Development of Roof-Top Garden.
JPBD. (2002g). Planning Standards Parking area. JPBD. (2002h). River reserve as a part of open space. JPBD. (2004). Perlaksanaan Petunjuk Bandar Mampan.
JPBD. (2006). Guidelines and Geometric Standards on Road Network System. JPBD. (2012). Green Neighbourhood Guidelines.
Kondoh, K. (2007). The role of urban communities in responding to global climate change and the urban heat island effect. (Ph.D. 3281222), Washington State University, United States -- Washington.
Mahesan, T. (1993). Urbanisation trends and open and recreational space requirement. Majid, M. R. (2006). Subpixel estimation of impervious surface using regression tree
model: Accuracy of the estimation at different spatial scales. Paper presented at the Map Asia 2006 Conference.
Mega, V., & Pedersen, J. (1998). Urban sustainability indicators. Dublin, Ireland. Ministry of Natural Resources and Environment Malaysia. (n. y.). Malaysia Second
National Communication to the UNFCCC.
Ministry of Transport and Infrastructure Baden-Württemberg. (2013). Climatic and Air Hygiene Maps as Aids for Planning and Zoning.
Mora, C. (2010). A synthetic map of the climatopes of the Serra da Estrela (Portugal). National Urbanization Policy. (2006). Indicators.
National Urbanization Policy. (2006). Indicators.
Netzband, M., William, L. S., & Redman, C. L. (2007). Chapter 1 - Remote sensing as a tool for urban planning and sustainability. In M. Netzband, W. L. Stefanov & C. Redman (Eds.), Applied Remote Sensing for Urban Planning, Governance and Sustainability (pp. 1-15). Heidelberg: Springer.
Ng, E., Katzschner, L., & Wang, U. (2007). Initial methodology of urban climatic mapping - Urban Climatic Map and Standards for Wind Environment - Feasibility Study,Technical report for Planning Department HKSAR.
Ng, Edward, Chao, Ren, Katzschner, Lutz, & Yao, Raumond. (2009). Urban climatic studies for hot and humid tropical coastal city of Hong Kong. Paper presented at the The seventh International Conference on urban Climate, Yokohama, Japan.
Ng, Edward, Katzschner, Lutz, & Wang, U. (2007). Initial methodology of urban climatic mapping - Urban Climatic Map and Standards for Wind Environment - Feasibility Study,Technical report for Planning Department HKSAR.Ng, Edward. (2009). Policies and technical guidelines for urban planning of high-density cities – air ventilation assessment (AVA) of Hong Kong. Building and Environment, 44, 1478-1488.
Noorzailawati Mohd Noor, Alias Abdullah, & Manzahari Nasrul. (2013). Land cover change detection analysis on urban green area loss using GIS and remote sensing technique. Journal of Malaysian Institute of Planners, 11, 125-138. Oliver, L. H. L., Shaharuddin Ahmad, Kadaruddin Aiyub, & Yaakob Mohd Jani.
(2011). Urban air environmental health indicators: A preliminary set for city of Kuala Lumpur. Journal of the Malaysian Institute of Planners, 11, 77-96. Qin, Z., & Karnieli, A. (2001). A mono-window algorithm for retrieving land surface
temperature from Landsat TM data and its application to the Israel-Egypt border region. International Journal of Remote Sensing, 22(18), 3719-3746. Razali, M. A. S. (2009). Study for urban Oasis as the medium to enhance the quality of
communities living and environment.
Rosenfeld, Arthur H., Akbari, Hashem, Bretz, Sarah, Fishman, Beth L., Kurn, Dan M., Sailor, David, & Taha, Haider. (1995). Mitigation of urban heat islands: materials, utility programs, updates. Energy and Buildings, 22(3), 255-265. Sani, S. (1989). Pembandaran dan iklim - implikasinya terhadap perancangan bandar
di rantau tropikal rendah. Bangi: Universiti Kebangsaan Malaysia.
Sani, S. (1990). Urban Climatology in Malaysia: An Overview. Energy and Buildings, 15, 105-117.
Sani, S. (1995). Pendekatan Pelbagai Disiplin dalam Perancangan dan pengurusan Bandar: Pengalaman Malaysia. Paper presented at the Building Better Cities. Schwarz, Nina, Bauer, Annette, & Haase, Dagmar. (2010). Assessing climate impacts of
planning policies—An estimation for the urban region of Leipzig (Germany). Environmental Impact Assessment Review.
Section of Urban Climatology, Stuttgart. (2013). Urban Climate Climate and air as planning factor.
Selangor Structure Plan. (2002). Planning Standard & Planning Park on the Roof. Shen, L. Y., Ochoa, J. J., Shah, M. N., & Zhang, X. (2011). The application of urban
sustainability indicators - A comparison between various practices. Habitat International, 35, 17-29.
Souch, C, & Grimmond, S. (2006). Applied climatology: urban climate. Progress in physical geography, 30(2), 270-279.
Town Planning Board. (2011). Urban climatic map and standards for wind environment feasibility study - stakeholders engagement.
Turner, R. K., Pearce, D., & Bateman, I. (1993). Environmental Economics: An elementary introduction: The John Hopkins University Press.
United Nation. (1997). Implementation of Agenda 21: Review of progress made since the United Nations conference on Environmental and Development, 1992. New York.
Urban Planning in the Essen Municipal Germany. (2010). Climatic Map.
WWF Malaysia. (2001). Bring back the birds! Planning for trees and other plants to support wildlife in urban areas.
Yeang, K., & Hamzah. (1995). Building more environmentally-responsive buildings for better cities.