(online) = ISSN 2285 – 3642 ISSN-L = 2285 – 3642
Journal of Economic Development, Environment and People Volume 7, Issue 1, 2018
URL: http://jedep.spiruharet.ro e-mail: office_jedep@spiruharet.ro
Fiscal Dependence in a Special Autonomy Region: Evidence from a local
government in Eastern Indonesia
Elsyan Rienette Marlissa1, Jhon Urasti Blesia2
1,2 Universitas Cenderawasih, Indonesia
Abstract. The research aims to analyse the degree of fiscal dependence of local government upon the central government in the regency of Mimika, one of Indonesia’s eastern regencies. The ratio of fiscal decentralization is used to calculate the local government’s ability to increase its regional revenue in order to support development initiatives in all sectors (Malmudi, 2010) Secondary data of locally generated revenue and total revenue from the period 2010-2015 are used to measure the degree of fiscal decentralization. The results show that the degree of fiscal decentralization in the regency remained at a low level, reflected from the average value at 12.92 percent with the highest degree at 25.09 percent in 2012. An analysis of fiscal decentralization in the regency of Mimika in the period 2010 – 2015, indicates that the regency lacked sufficient fiscal capacity, showing heavy dependence upon financing from the central government. The local government is expected to develop Mimika’s potentiality through creative efforts from their apparatus to increase local revenues. The funds transferred from the central government are intended to be spent on the consumption of goods and services to support economic activities in the region.
Keywords: fiscal capacity, decentralization, revenue, economy growth, regional development
JEL Codes: O1, O18, O23
1.
Introduction
The principles of decentralization in Indonesia constitute real and responsible autonomy, and regional autonomy is thus based on these principles. This requires that its local government perform all aspects of the government of the region autonomously. In fact, this autonomy confers full authority and responsibility on the local government, at the levels of both regency and city, in the enacting of policies, planning, implementation, monitoring, control and evaluation. The development of a regional autonomy policy that regulates the relationship between central and local government replaces the unjust centralistic system in the implementation of development. Regional autonomy can enable central government to allow local government to regulate its own development initiatives and their implementation in accordance with the prevailing laws and regulations. This policy can also provide space for local governments to develop their regions independently.
(online) = ISSN 2285 – 3642 ISSN-L = 2285 – 3642
Journal of Economic Development, Environment and People Volume 7, Issue 1, 2018
URL: http://jedep.spiruharet.ro e-mail: office_jedep@spiruharet.ro
services and community welfare and; 3) Empowering and creating space for the community to participate in the development process. To pursue these objectives, the decentralization, including fiscal decentralization, is granted to local governments throughout Indonesia to develop their own regions based on the voices and aspirations of the indigenous people. The central government in Indonesia imposed Law No. 22 of 1999 on the Local Government and Law No. 25 of 1999 on Financial Balance between Central and Local Government. The latter was revised by Law No. 32 of 2004, imposed on Regional Government and Law No. 33 of 2004, imposed on the Financial Balance between Central and Local Government. The granting of this authority and responsibility, therefore, must be balanced against the distribution of sources of income sufficient to support this given authority and responsibility. Similarly, the implementation of Law No. 33 of 2004 upon the Financial Balance between Central and Local Government, especially concerning the equalization of funds, is expected to support the implementation of Law No. 32 of 2004.
In today’s era of autonomy, any efforts that rely on donations and support from the Central Government or the higher levels of government are untenable. Autonomous regions are required to be self-reliant in funding the implementation of their local development. Therefore, in order to decrease their dependence upon central government, the regions are forced to increase their local revenues.
In order to enable a regional government to manage its own household, its financial capability must be increased. In other words, finance is an essential factor in assessing a regional government’s ability to implement regional autonomy. The financial ability of a regional government indicates the extent to which that regional government can maximize its own financial resources to fund its needs, without always having to rely on the central government’s grants and subsidies. Locally generated revenue can be seen as one of several indicators in measuring the dependence of a region upon the central government. In principle, the greater the contribution of locally generated revenue to the local budget of income and expenditure indicates a region’s lesser dependence upon the Central Government. One of the important factors, which a local government must develop in its implementation of Law No. 32 and 33 in 2004, is its financial capacity. One of several indicators used to measure the fiscal capacity of a region is the ratio of locally generatedrevenue to the total revenue (Kuncoro, 2004).
A question arises whether the delegation of given authority can contribute to economic growth in the region. The application of fiscal decentralization in Indonesia contains significant challenges. Fiscal inequality has existed with the central government and among local governments. The proportion of regional expenditures to fund development programs or to develop local economies is mostly sourced from the central government through its transfer funds. In minimizing this dependency, each local government in Indonesia is required to optimize its ability to explore its income potential through local taxes, retribution, locally owned business profits and other legitimate income.
(online) = ISSN 2285 – 3642 ISSN-L = 2285 – 3642
Journal of Economic Development, Environment and People Volume 7, Issue 1, 2018
URL: http://jedep.spiruharet.ro e-mail: office_jedep@spiruharet.ro
growth through local spending allocation in the region and to know the roles of central government in helping economic growth in the region, reflected from its transfer funds..
2.
Literature review
2.1. The fiscal decentralization in Indonesia
Decentralization in general can be interpreted as delegation of authority from the central government to autonomous governments at a lower level. Khusaini and Yustika (2006) stated that decentralization could be defined as a delegation of authority from the central government to lower levels of government. Theoretically, several types of decentralization are; political decentralization; administrative decentralization and fiscal decentralization. According to Law No. 32 of 2004, section 7, decentralization in Indonesia is the transfer of governmental power from the Central Government to autonomous regions within the framework of the Unitary Republic of Indonesia. Fiscal decentralization is defined as a delegation of authority in the field of budget revenue or finance which was previously centralized, both in its administration and utilization, and organized by the Central Government (Khusaini & Yustika, 2006). The definition above implies that decentralization provides more space for local governments to improvise in their utilization of their resources and local potentiality, as well as their ability to improvise policies oriented to the needs of the region. These can constitute the implementation of routine tasks, public services and productive investment (capital investment) in the region. Halim and Abdullah (2010); Khusaini and Yustika (2006) stated that the degree of decentralization indicates the degree of the contribution of locally generated revenue to total revenue. A higher contribution of locally generated revenue increases the ability of the region to implement decentralization.
The decentralization is aimed at bringing the government closer to society so that a decentralized system of government can create economic efficiency that, in turn, can improve the welfare of society in general. According to Law No. 32 in 2004 and Law No. 33 in 2004, the objectives of fiscal decentralization in Indonesia are:
1) Fiscal sustainability in the macroeconomic context;
2) Correction of the vertical imbalance to reduce the financial imbalance between central and local government, where it is executed by enlarging the regional taxing power;
3) Correction of horizontal imbalance which is executed through minimizing disparities among regions in block grant/transfer mechanisms and enabling local authorities to implement development policies that suit the local needs, potentials and resources;
4) Reduction in the level of regional dependence on the central government;
5) Increase in accountability, effectiveness and efficiency in the framework of improving regional performance;
6) Improvement of public service quality and
7) Enlargement of the public participation in decision taking in the public sector.
(online) = ISSN 2285 – 3642 ISSN-L = 2285 – 3642
Journal of Economic Development, Environment and People Volume 7, Issue 1, 2018
URL: http://jedep.spiruharet.ro e-mail: office_jedep@spiruharet.ro
Government in meeting all the needs of regional development activities (Kuncoro, 2004). Davey (1988) argued that central government’s fund transfer to a local government shows a regional dependence on the centre. Abdullah and Halim (2003) added that the transfer from the central government implicitly influences the decline of independence of a region. It is also strengthened by Mardiasmo (2002) that fiscal dependence, subsidies and any central government assistance are a form of powerless locally generated revenues. The success of regional autonomy is inseparable from the ability of the financial sector; one of the important indicators of regional autonomy. In this case, the local authorities are required to effectively and efficiently run the government, encourage community participation in its development and increase prosperity by increasing equity and justice. The regions, therefore, should be more creative in increasing their locally generated revenues to increase accountability and flexibility in their spending (Sidik, 2002).
A local government’s fiscal dependence can be identified by measuring its financial performance or capacity as well as its readiness to develop regional autonomy. It can be reached from the extent of the financing capabilities funded entirely by locally generated revenues and transfer funds. Measuring the financial performance or capacity can be done using indicators of fiscal decentralization degrees (Khusaini & Yustika, 2006; Kuncoro, 2004; Musgrave & Musgrave, 1973; Sularso & Restianto, 2012). Meanwhile, to identify the readiness of local governments to deal with regional autonomy, especially in the field of finance, the extent of their ability to finance all activities funded entirely by all locally generated revenue can be measured (Sumarsono, 2009). A region classified as autonomous has financial capacity in the region. This means that the region has the ability and authority to extract its financial resources, and that it manages and uses its own finances to finance the administration. Being autonomous also means less dependence on the central government. The locally generated revenue in the region, therefore, should be the largest financial source supported by central and regional fiscal balancing policies. Both traits will influence the patterns of relations between the central and regional governments.
2.2. Regional financial capability
The ability of the region to obtain its own fiscal resources indicates how far the region can develop its own sources to finance its needs without having to depend solely on the assistance of central government. The ability of regions to finance their expenses can be seen by the size of their local revenues, as compared to the balancing funds. The greater the locally generated revenues in the region, the less dependence the region has upon the central government. The use of surplus budget, therefore, can be used for spending allocations, especially spending on public infrastructure, rather than on financing such expenditure from the account of the regional cash holder.
Regional revenue sources are three, namely locally generated revenue, transfer revenue and other legitimate local revenue.
Locally generated revenue comes from local economic resources and includes local taxes, levies, profit from regional-owned enterprises and other original local government revenues. Transfer revenue comes from the central government in its implementation of regional autonomy, and can be a grant fund that consists of a tax sharing fund, non-tax and natural resources sharing funds, general and special allocation funds and.
(online) = ISSN 2285 – 3642 ISSN-L = 2285 – 3642
Journal of Economic Development, Environment and People Volume 7, Issue 1, 2018
URL: http://jedep.spiruharet.ro e-mail: office_jedep@spiruharet.ro
grants, emergency funds from the government in the context of disaster management, tax sharing from the provincial government, adjustment funds and financial assistance from the provinces or other governments (Nordiawan, Putra, & Rahmawati, 2007).
All regional revenue either earned from locally generated revenue or as assistance from the central government should be used to finance all regional expenditures. According to Law No. 32 in 2004 pertaining to regional government, regional expenditure constitutes all regional obligations recognized as deduction of net worth revenue in the particular budget period. Regional expenditures, as referred to in the regulation of Minister of Home Affairs No. 13 in 2006 - concerning the guidelines on the regional financial management, section 31, paragraph (1) - states that regional expenditure is used to finance the implementation of government affairs. This implementation becomes the authority of the province, regency or city to finance compulsory, voluntary and other affairs managed by certain fields or departments, which may be undertaken jointly between the central and local government or among local government established under laws and regulations. Regional expenditure is grouped into direct and indirect expenditure. Direct expenditure is a budgeted expenditure that is directly related to the implementation of programs and activities while indirect expenditure is a budgeted expenditure not directly related to the implementation of programs and activities.
Certain financial indicators measure financial performance. Government organizations use several performance measures, and degrees of fiscal decentralization are one of them (Khusaini & Yustika, 2006; Musgrave & Musgrave, 1973; Sularso & Restianto, 2012; Sumarsono, 2009). This shows the degree of contribution of locally generated revenue to the local revenue in totals - the higher the contribution of this revenue, the higher the regional capability in the implementation of decentralization (Khusaini & Yustika, 2006; Sumarsono, 2009; Utomo, 2012). Financial dependency ratio shows the amount of general allocation fund or funds derived from the central government budget allocated for financial distribution in the regions to finance their expenditure needs in the context of decentralization implementation. The transfer of authority from central government to the regional government leads consequently to the balancing of funds from central to regional government. Regional government can freely use these funds to provide better services to the community (Khusaini & Yustika, 2006; Utomo, 2012).
2.3. Previous empirical research
Fiscal decentralization has been conducted and has resulted in various responses, both positive and negative contributions to the growth of the economy. However, it is admitted that much less work is devoted to the study of its impact (Martinez-Vazquez & McNab, 2003). In Indonesia, fiscal decentralization and its impact on economic development has been studied in several regions and has shown various outcomes.
(online) = ISSN 2285 – 3642 ISSN-L = 2285 – 3642
Journal of Economic Development, Environment and People Volume 7, Issue 1, 2018
URL: http://jedep.spiruharet.ro e-mail: office_jedep@spiruharet.ro
ratio of routine capability index, the financial ability is still very low in financing regional development. Nevertheless, the ratio of growth shows positive growth. Overall, the pattern of financial ability level reflects very low categories in support of the implementation of regional autonomy.
Rahman, Naukoko, and Londah (2014) in the research entitled “Comparative Analysis of Local Financial Capacity in North Sulawesi Province in Indonesia” studied on Manado and Bitung city during the period 2008-2012. The results show the level of financial ability in both Manado and Bitung cities. They observed that the financial ability in Manado is still a bit higher than that of Bitung. In Manado, the average growth reached 2% every year, although it is below 20% level of independence, compared to the city of Bitung which only reached 1% growth every year and is below 10% level of independence.
Rudiyanto and Sasana (2015), in their research entitled “Financial Capacity of Local Government in the Implementation of Regional Autonomy (a study on the regency in the special province of Jogjakarta and Banten), showed that the financial performance of the regencies in the province of Jogjakarta is still relatively poor. From the ratio of regional financial independence point of view, the financial performance of the regencies is less than that of others.
Previous research has also shown how the implementation of fiscal decentralization did not contribute to the economic growth in some countries. Zhang and Zou (1998) researched how the allocation of fiscal resources from the central to local government influenced economic growth. The sample of the provinces in China from 1978-1992 showed that higher levels of fiscal decentralization hampered the provincial economic growth. It can thus be said that the implementation of fiscal decentralization has a negative impact on the economic growth and development of provinces. Xie, Zou, and Davoodi (1999) also conducted research on fiscal decentralization and economic growth in a cross-country study, using panel data from 46 countries during the period 1970-1989. Their study showed a negative impact of fiscal decentralization on the growth of economy in developing countries, and that there is no relationship at all between fiscal decentralization and economic growth in developed countries. This indicates that the policies and implementations of fiscal decentralizations can have a negative impact in any countries, depending on various positive and negative factors it might trigger.
Nevertheless, some research shows successful stories of the policies and implementation of regional autonomy and fiscal decentralization to the development of some economies. Akai and Sakata (2002) conducted their research in 50 states of the United States, during the period 1992- 1996, showing that fiscal decentralization has resulted significantly in encouraging regional economic growth. It is supported by Iimi (2005) and Malik, Mahmood-ul-Hassan, and Hussain (2006) in their research that claimed that fiscal decentralization has a positive influence on economic growth. Bahl and Wallace (2006) conducted research in Russia in the period 1997 found that fiscal decentralization has significant and positive relationship with the level of regional economic growth. It is also supported by Bröthaler and Getzner (2010) in their research in the provinces in the country of Austria during the period 1955-2007, found that fiscal decentralization results significantly in encouraging long and short-term regional economic growth.
3.
Portrait of the growth of regional economy
(online) = ISSN 2285 – 3642 ISSN-L = 2285 – 3642
Journal of Economic Development, Environment and People Volume 7, Issue 1, 2018
URL: http://jedep.spiruharet.ro e-mail: office_jedep@spiruharet.ro
km2 or 4.75% of the total area of the province of Papua. It has 18 districts and the majority of the population is concentrated in the administrative area of the regency. This regency was historically a district of the main regency of Fakfak , however, based on the Government Regulation No. 54 in 1996, the district then was designated an administrative regency and later, based on Law No. 45 in 1999 in 1999, the district has been an autonomous regency. The population in the regency has increased from time to time, and the total population of the regency in 2010 was 183,491, and then increased significantly between 2014 and 2015 to 199,311 and 201,677 respectively. Annual population growth rate in the regency from 2010 to 2015 has increased 9.91% and that from 2014 to 2015 to 1.19%.
Between 2010 and 2014, the highest average growth of Gross Domestic Product (GDP) in this regency came from mining and excavation at 90.08%, while the lowest is the electricity and water sector at 0.04%. This proportion put mining as the biggest contributor to the local economy of the region, although its biggest proportion is not in line with the growth of this sector to contribute the GDP of the regency. The size of the contribution of mining and excavation to the GDP unfortunately fluctuated significantly. For instance, in 2010 it was Rp.53.455.115,34 but it dramatically decreased to the next 2 years (2011 and 2012) before a slight increase in 2013 and another significant increase in 2014, to Rp.32.581.055,29. Transportation and communication represented the second highest sector during these periods was, at 2.94%, followed respectively by trade, hotels and restaurants at 2.10%, and the building sector at 1.97%. All economic sectors in the regency gradually increased between 2010 and 2014, except services and mining and excavation services, the amounts of which fluctuated. The agriculture sector in the region experienced a gradual growth from 2010 to 2013 before increasing almost three times in 2014. The insignificant increase of the agricultural sector to the GDP from 2010 to 2013 was partly caused by limited irrigation facilities in the region. The following table 1 below shows the growth of GDP in all sectors in the region.
TABLE 1. GDP growth in the regency of mimika in the period 2010-2014
2010 2011 2012 2013 2014 Contribution
Agriculture 262,894.70 292,445.02 323,111.02 359,971.68 1,012,987.83 1.22
Mining and
excavation 53,455,115.34 42,185,764.84 36,929,787.82 42,702,413.10 32,581,055.29 90.08
Processing industry 16,826.14 18,973.14 20,987.19 23,349.19 85,387.99 0.09
Electricity And Water 18,523.29 20,147.67 21,951.15 24,243.22 13,288.40 0.04
Building 618,260.74 686,462.30 752,552.92 866,510.93 1,168,788.37 1.97
Trade, Hotels and
Restaurants 656,092.85 749,773.82 864,258.14 1,004,088.74 1,160,986.59 2.10
Transportation and
Communications 798,170.03 988,215.16 1,146,549.00 1,278,839.95 1,820,345.12 2.94
Finance, Leasing and
Services Company 271,569.79 234,365.54 251,776.54 300,174.22 861,532.84 1.04
Services 210,707.30 248,694.07 296,639.28 346,065.86 133,219.79 0.51
(online) = ISSN 2285 – 3642 ISSN-L = 2285 – 3642
Journal of Economic Development, Environment and People Volume 7, Issue 1, 2018
URL: http://jedep.spiruharet.ro e-mail: office_jedep@spiruharet.ro
The significant growth of GDP should be able to reduce the level of poverty in the region. Statistics in the regency show the gradual decrease for poverty during the period 2003-2014. To measure poverty, the regency uses basic needs approach, where poverty is viewed as the economic ability to fulfil food and non-food consumption/expenditure. The regency defines a person living in poverty as a person whose expenditure per capita per month is below the food poverty line. The food poverty line refers to the daily minimum requirement of 2011 kcal per capita per day. The non-food poverty line refers to the minimum requirements for household necessities for education, health and other basic individual needs. The following graph is to show the level of poverty in the regency from 2003 to 2014.
Fig. 1: The percentage of poor people in the regency of Mimika in the period 2003-2014 Source: Central statistics, 2016
The above figure shows the number of poor people in the region based on the above measurements. It indicates that the highest number of poor people is in 2005 - 60,736 people or 50.43%. The central government policies that reduced fuel subsidies in 2005 have a significant impact on the poverty increment in the regency during that year. However, after that the poverty rate gradually decreased until 2014, reaching 16.11% or 32,220 people. Based on this publication, the poorest people are located in the district of Mimika Baru as the administrative government area.
4.
Research method
This study utilizes elements of quantitative and qualitative research to explain fiscal decentralization in the regency of Mimika. This study used secondary data of locally generated revenue and total revenue drawn from the official publication of the government, the Central Bureau of Statistics, the Department of Revenue
32.75 30.75
50.43
41.58
32.73 28.74
24.74 23.66 22.57
20.09 20.37 16.11
0 10 20 30 40 50 60
2003 2004 2005 2006 2007 2008 2009 2010 2011 2012 2013 2014
(online) = ISSN 2285 – 3642 ISSN-L = 2285 – 3642
Journal of Economic Development, Environment and People Volume 7, Issue 1, 2018
URL: http://jedep.spiruharet.ro e-mail: office_jedep@spiruharet.ro
and the Board of Financial Management and Assets in the regency of Mimika in the period of 2010-2015. The analytical method uses the ratio of the degree of fiscal decentralization to measure the ability of local government to increase its regional revenue in financing its development. Mahmudi Fattah (2012); Khusaini and Yustika (2006); Malmudi (2010) explained that the ratio of fiscal decentralization is calculated by dividing locally generated revenues into the total revenue in a particular period. If the contribution of locally generated revenue is higher, the ability of local governments to implement decentralization will be higher. The following formula shows the Degree of Fiscal Decentralization ratio:
100%
= Degree of Fiscal Decentralization = Locally Generated Revenue in year t = Total Revenue in year t
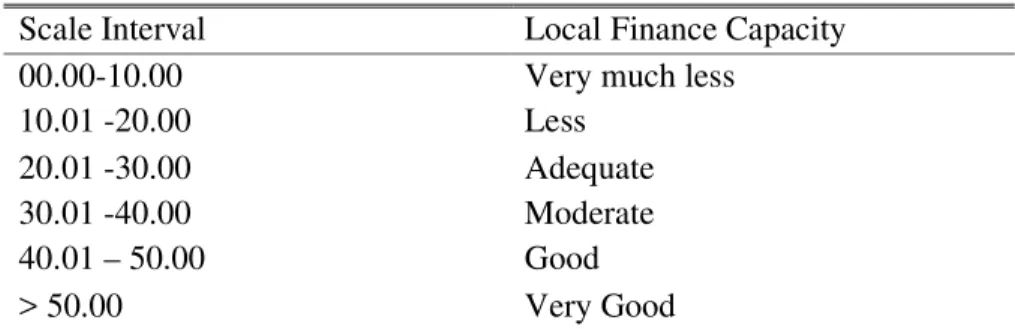
The criteria used to assess the degree of fiscal decentralization can be categorized as the table below.
TABLE 2. Scale interval from the degree of fiscal decentralization
Scale Interval Local Finance Capacity
00.00-10.00 Very much less
10.01 -20.00 Less
20.01 -30.00 Adequate
30.01 -40.00 Moderate
40.01 – 50.00 Good
> 50.00 Very Good
Source: tim litbang depdagri, fisipol UGM, 1991
(online) = ISSN 2285 – 3642 ISSN-L = 2285 – 3642
Journal of Economic Development, Environment and People Volume 7, Issue 1, 2018
URL: http://jedep.spiruharet.ro e-mail: office_jedep@spiruharet.ro
findings. Participants were selected through the purposive sampling method, where the researchers purposefully chose them in order to meet certain criteria (Madsen, 2011; Tongco, 2007). The selected participants in this study are those who work for the Revenue office and the Development Planning office in the regency.
The Revenue office is considered the only office in the region one of whose duties is to increase the total revenue in the region through the locally generated revenue sourced from the taxes, levies, profit from regional-owned enterprises and other original local government revenue. The Development Planning office in the region is also considered the place that can provide a significant input for its function in assisting the regent in the implementation of regional government in the field of research and regional development planning. Coordination, formulation and budgeting of regional income and expenditure has been one of the duties of this office. Two different participants in each office (a total of four) are responsible for identifying the cause and effect of minimum locally generated revenues in the region causing the high dependence upon transfer of funds from the central government. They were approached for the in-depth interviews.
5.
Results
It is the duty of the Department of Revenue and the Board of Financial Management and Assets to execute the administration of local government in the field of local revenue in the regency of Mimika. Therefore, they have become the central source of information regarding local taxes, levies and other resources of local revenue. The following table will explain the development of locally generated revenue in the period of 2010-2015.
TABLE 3. Locally generated revenue in the regency of Mimika in the period 2010-2015 Locally generated
Revenue
Period
2010 2011 2012 2013 2014 2015
Taxes 30.460.826.929 85.820.273.558 102.319.858.491 94.264.636.138 102.367.836.138 147.367.836.138
Levies 10.021.662.000 15.323.610.401 47.607.804.200 8.382.109.953 8.382.109.953 38.989.309.953
Profit from regional
owned enterprises
5.069.537.059 4.194.432.211 5.500.000.000 6.038.699.124 6.038.699.124 31.758.699.124
Other original local
government revenue
34.964.186.762 14.780.777.830 171.698.578.000 23.855.154.785 87.767.027.541 85.518.906.785
Total 80.516.212.750 120.119.094.000 327.126.240.691 132.540.600.000 204.555.672.756 303.634.752.000
(online) = ISSN 2285 – 3642 ISSN-L = 2285 – 3642
Journal of Economic Development, Environment and People Volume 7, Issue 1, 2018
URL: http://jedep.spiruharet.ro e-mail: office_jedep@spiruharet.ro
However, if seen from the overall items of revenue, the amount of acceptance of revenue fluctuates. It increased from 2010 to 2012 before then decreasing sharply in 2013 and experienced an increase again in the past 2 years of the research period. The degree of fiscal decentralization is one of the benchmarks showing the level of fiscal dependency in the regency of Mimika shown in Table 4 and Figure 2 below.
TABLE 4. The degree of fiscal decentralization in the regency of Mimika, period 2010-2015
Period
Locally generated Revenue
Total Regional Revenue
Degree of Fiscal Decentralization
Local Finance Capacity 2010 80,516,212,750 1,200,572,226,350 6.71 Very much less
2011 120,119,094,000 1,317,885,257,931 9.11 Very much less
2012 327,126,240,691 1,304,036,735,531 25.09 Adequate
2013 132,540,600,000 1,261,049,063,000 10.51 Less
2014 204,555,672,756 1,646,060,999,756 12.43 Less
2015 303,634,752,000 2,224,241,935,337 13.65 Less
Average 194,748,762,032 1,492,307,702,984 12.92 Less
(online) = ISSN 2285 – 3642 ISSN-L = 2285 – 3642
Journal of Economic Development, Environment and People Volume 7, Issue 1, 2018
URL: http://jedep.spiruharet.ro e-mail: office_jedep@spiruharet.ro
Fig. 2. The degree of fiscal decentralization, period 2010-2015
If seen from the overall period of the analysis, the degree of fiscal dependency in the regency of Mimika is still very high and categorized as less in its local financial capacity, shown from the average degree of fiscal decentralization to12.92% (in scale interval 10.01-20.00). The average degree of fiscal decentralization in the regency, amounting to 12.92%, indicates Mimika’s local government’s capacity to support its financing is still considered less.
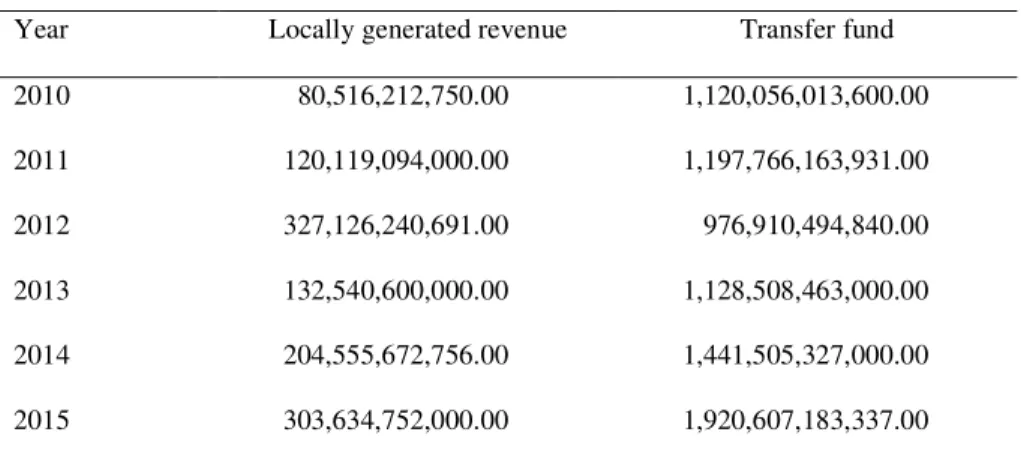
TABLE 5. Locally generated and transfer fund in the regency of Mimika Year Locally generated revenue Transfer fund
2010 80,516,212,750.00 1,120,056,013,600.00
2011 120,119,094,000.00 1,197,766,163,931.00
2012 327,126,240,691.00 976,910,494,840.00
2013 132,540,600,000.00 1,128,508,463,000.00
2014 204,555,672,756.00 1,441,505,327,000.00
2015 303,634,752,000.00 1,920,607,183,337.00
Source: The department of revenue and the board of financial statement and assets in the regency of Mimika, 2016 This number also shows that the fiscal dependence of the regency upon the Central Government financing is still high, indicating that the transfer from the central government through its transfer fund is
6.71
9.11
25.09
10.51
12.43 13.65
0 5 10 15 20 25 30
2010 2011 2012 2013 2014 2015
Year
(online) = ISSN 2285 – 3642 ISSN-L = 2285 – 3642
Journal of Economic Development, Environment and People Volume 7, Issue 1, 2018
URL: http://jedep.spiruharet.ro e-mail: office_jedep@spiruharet.ro
high. The transfer fund is the fund coming from the state (central government) that is allocated to the regions, to fund their needs in the context of decentralization. To evaluate the dependency of the region to the top government in the country, it is important to analyse the transfer fund. The following table is constructed to show the dependence of the regency on the central government (Table 5).
By viewing the growth of locally generated revenue, that continues to increase, the regency of Mimika should be able to sustain this growth through the establishment of its target of local taxes revenue, levies and other items while paying more attention to its potentiality. Therefore, the locally generated revenue needs better management and it is necessary to optimize the sources of all local revenues in order further explore the potentiality of regional income. The local government, therefore, is expected to maximize its locally generated revenue to reduce this dependency. This is because this component of revenue is strongly associated with the dynamics of economic activities occurring in the regional economy. The local government is also expected to manage the locally generated income to finance its regional expenditure. When seen from the acceptance of all revenue, the locally generated revenue is considered far smaller than that of the transfer funds and other legitimate revenues. The amount of balanced budget increased from time to time despite a decrease in 2012. This shows high dependence by the local government.
6.
Discussion
This finding of less fiscal decentralization in this study is in line with Davey (1988) arguing that central government fund transfer shows high dependence on the centre. The decline of independence of a region is implicitly influenced by the transfer of central government (Abdullah & Halim, 2003; Mardiasmo, 2002) and the similar situation applies to the case of the regency of Mimika. The decentralization should be able to develop economic growth. Malmudi (2010) stated that the more locally generated revenue shows the greater capability of local governments to implement the decentralization. This revenue is needed to meet local requirements and the decentralization should be able to increase local government revenue that in turn is expected to increase regional economic growth (Akai & Sakata, 2002; Bröthaler & Getzner, 2010; Iimi, 2005; Malik et al., 2006). One of the roles of local government in increasing this economic growth in the region is to make the local government expenditures more effective in supporting the economic activities in the society, such as public facilities development, and with proper allocation, it is also expected to increase the local revenues. If it proves to be less favourable for the economic development, the regions will depend heavily on the transfer of central government funds, and this causes low economic development.
(online) = ISSN 2285 – 3642 ISSN-L = 2285 – 3642
Journal of Economic Development, Environment and People Volume 7, Issue 1, 2018
URL: http://jedep.spiruharet.ro e-mail: office_jedep@spiruharet.ro
income from other sources) can be used to develop the regional economy and at the same time provide good public services to the community.
However, the regency is still unable even to finance its indirect expenditures. As signalled above, indirect expenditures are incurred to finance indirect activities of local government, such as public servants’ salaries and other expenses related to asset maintenance. These expenditures are disbursed even if the development programs are not implemented. The Law No. 32 of 2004 categorizes indirect expenditures as fixed expenditures that are routinely incurred even if there is no particular program being run by the government. So the capacity to finance this expenditure in the region is considered to be urgent, in order to sustain the local government in running the daily governmental work. The routine capacity index is one of the financial ratios used to measure local financial capacity in meeting the indirect expenditures (Vurry, Suwendra, & Yudiaatmaja, 2014). Further analysed data showed that the routine capacity index in the regency in the six years up to 2015 is 27.88, meaning that 27.88% of the routine capacity index means that the regional revenue is able to finance only 27.88% of indirect expenditures, while the remaining 72.12% cannot be met. Inability to finance the indirect expenditures from the locally generated revenues needs to be subsidized by the government through the transfer fund (Khusaini & Yustika, 2006; Utomo, 2012). In other words, the total of locally generated revenues in the region is potentially used to finance only 27.88% of indirect expenditures, while the remaining 72.12% needs to use the transfer funds from the central government. This indicates the big proportion of transfer funds mostly covers the need of the regency to finance its routine expenditures without being much used for goods and services related to direct expenditures to support the growth of economy in the region.
Several factors are identified as causing the fiscal decentralization issues in the regency. Based on in-depth interviews during the fieldwork, we identified two main issues; namely, there are unidentified potential sources of the locally generated revenues and there is no maximum absorption of the taxes and levies. The regency has potential in its forest sector as a producer of forest materials, such as timbers. The materials could be sold in domestic and foreign markets and potentially increase their locally generated revenues. In the tourism sector, with the richness of natural resources, including biodiversity in the region, the government could develop various types of tourism (Muller, 2001; Timang, 2016). The region is also rich in cultural values, including customary rituals, traditional dance, carvings and sculpture that could potentially be developed as another type of cultural tourism (Harple, 2000; Muller, 2003; Pouwer, 2010). With well-managed tourism, emphasising such aspects as the beautiful beaches and national parks, as well as the support from their cultural attractions, such as traditional arts, museums and festivals, the regency actually could attract both domestic and foreign tourists to visit it, and this could later increase the locally generated revenues from taxes or levies.
Yahoo-(online) = ISSN 2285 – 3642 ISSN-L = 2285 – 3642
Journal of Economic Development, Environment and People Volume 7, Issue 1, 2018
URL: http://jedep.spiruharet.ro e-mail: office_jedep@spiruharet.ro
Finance, 2017). In the past 5 years, from 2010 to 2014, the contribution of this mining company gradually decreased (see the table 1 of the mining contribution to the GDP above). The extension of contract of work with the central government of Indonesia and local government of Mimika will be definitely the biggest contribution to the local economy of the region. Both government and company need to serious consider adding the substantial values of local revenues to support economic activities.
The regency has potential resources that should be optimized to increase its local revenues. As stated by the Law No. 28 in 2009 on regional taxes and levies, there are 11 sources of taxes that should be maximized for the benefit of the regency. The taxes are paid for hotel/motel, restaurant, entertainment, advertising, road lighting, and non-metallic and rock mineral, parking, ground water, swallow nest, land and building in rural and urban areas and acquisition of land and building rights. There are three different objects of levies, including general services, business services and specific licensing. However, this potential has not been maximised to increase the local revenues. Lack of human resources and supporting elements has partly explained why these economic potentials are not fully absorbed. In order to increase the employees to work on maximizing its local revenues, from each stage of planning, organizing, performing and evaluating the process of collecting taxes, levies and other revenues, the regency needs to provide the relevant training in performing each process. Supporting elements, such as facilities and infrastructure to support all-important stages to the final point when the local revenue is collected and deposited to a regional bank account, need to be provided by the region. The regency should probably form a team to directly visit in the field and supervise the collection of each item of local revenue as feedback for further evaluation, in order to gain better revenues.
In-depth interviews and direct observations showed that, despite an increase of awareness by the region’s society to pay for taxes and levies incurred by them, there have still been found some instances of the society (individuals or organizations) disobeying the laws and not paying their obligations. There is no apparatus to enforce the laws related to the collection of revenues in the field. So, the groups within the society who do not pay their taxes or levies are not punished. In addition, there has been a deviation where the amount collected in the field is different from that deposited to the account of the region. To solve this issue, the regency through its relevant office should provide guidance for the employees about the importance of law enforcement upon those who violate the laws, and it should take actions against deviations that occur in the process of the collection of revenues coming from both society and regency apparatus itself.
7.
Conclusion
(online) = ISSN 2285 – 3642 ISSN-L = 2285 – 3642
Journal of Economic Development, Environment and People Volume 7, Issue 1, 2018
URL: http://jedep.spiruharet.ro e-mail: office_jedep@spiruharet.ro
The ability of locally generated revenue in the region at least in reducing the dependency upon the government is used to finance local spending, especially direct expenditures. The roles of this revenue in the region need to be improved to develop the economy. Therefore, it is important to evaluate the capacity of this revenue as one of the indicators of the formation of independence of a region during the development of decentralization in Indonesia. The local government, through its regional finance apparatus, should also seek out possible alternatives to explore and develop its local revenues through various creative efforts. The government should seek new resources of finance to develop its locally generated revenue either through partnership programs with private parties, through establishment of locally-owned enterprises or through equality participation with private companies in order to gain more revenues.
In order to obtain more accurate data on the amount of local tax and levies that can potentially be applied, the government needs to re-record the number of taxpayers and the levies currently being paid. To avoid any leakage of these revenues, the government needs to improve coordination with related agencies in clarifying the type of taxes or levies that they have the authority to impose. It is also important periodically increase monitoring to improve the transparency of the reasons for collecting these revenues. Local regulations related to the process of collection, supervision and approval of the coordination with relevant agencies should be reinforced. The government should also predict future regional possibilities or conditions that will affect the locally generated revenues, and it should attend to future fiscal needs and capabilities while planning the budget, so that each component of the possible revenues will be allocated to improve both public service and the welfare of the community.
This research requires further analysis and discussion of economic conditions in the region. Analysis of economic growth could be one of several indicators to measure the development of regional development. Further discussion in the use of expenditures from both operational and capital spending, about whether they are used to contribute to the development of local economy, can be another necessary element to measure the growth of that economy.
8.
References
[1] Abdullah, S., & Halim, A. (2003). Pengaruh dana alokasi umum (DAU) dan pendapatan asli daerah (PAD) terhadap belanja pemerintah daerah: Studi kasus kabupaten/kota di Jawa dan Bali. Proceeding Simposium Nasional Akuntansi VI, 16-17.
[2] Adhim, C. (2013). KEMAMPUAN KEUANGAN DAERAH DALAM MENDUKUNG PELAKSANAAN OTONOMI DAERAH (Studi di Kabupaten Dompu Tahun Anggaran 2007-2011). Jurnal Ilmiah Mahasiswa FEB, 2(2).
[3] Akai, N., & Sakata, M. (2002). Fiscal decentralization contributes to economic growth: evidence from state-level cross-section data for the United States. Journal of urban economics, 52(1), 93-108.
[4] Bahl, R., & Wallace, S. (2006). Fiscal decentralization and fiscal equalization within regions: The case of Russia. Journal of Public Budgeting, Accounting & Financial Management, 18(1), 27.
[5] Barzelay, M. (1991). Managing local development: lessons from Spain. Policy Sciences, 24(3), 271-290. [6] Boyce, C., & Neale, P. (2006) Conducting in-depth interviews : A guide for designing and conducting in-depth
(online) = ISSN 2285 – 3642 ISSN-L = 2285 – 3642
Journal of Economic Development, Environment and People Volume 7, Issue 1, 2018
URL: http://jedep.spiruharet.ro e-mail: office_jedep@spiruharet.ro
[7] Bröthaler, J., & Getzner, M. (2010). Effects of fiscal decentralization on public sector growth in Austria. Public Finance and Management, 10(1), 169.
[8] Davey, K. (1988). Pembiayaan Pemerintah Daerah Praktek-Praktek Internasional dan Relevansinya bagi Dunia Ketiga, terjemahan. UI-Press, Jakarta.
[9] Devarajan, S., Swaroop, V., & Zou, H.-f. (1996). The composition of public expenditure and economic growth. Journal of monetary economics, 37(2), 313-344.
[10]Fattah, S. (2012). Analisis Ketergantungan Fiskal Pemerintah Daerah Di Provinsi Sulawesi Selatan Pada Era Otonomi Daerah. Prosiding Seminas, 1(2).
[11]Freeport-McMoRan. (2015). 2015-Annual Report - Proving Our Metle [12]Freeport-McMoRan. (2016). 2016 Annual Report - Driven By Value
[13]Halim, A., & Abdullah, S. (2010). Hubungan dan Masalah Keagenan di Pemerintah Daerah. Jurnal Akuntansi Pemerintah, 2(1).
[14]Harple, T. S. (2000). Controlling the dragon: an ethno-historical analysis of social engagement among the Kamoro of South-West New Guinea (Indonesian Papua/Irian Jaya).
[15]Iimi, A. (2005). Decentralization and economic growth revisited: an empirical note. Journal of Urban Economics, 57(3), 449-461.
[16]Jensen, F., & Asmarini;, W. (2017). UPDATE 1-Freeport Indonesia says could seek arbitration over mining contract violations, Reuters. Retrieved from https://www.cnbc.com/2017/02/19/reuters-america-update-1-freeport-indonesia-says-could-seek-arbitration-over-mining-contract-violations.html
[17]Khusaini, M., & Yustika, A. E. (2006). Ekonomi Publik: Desentralisasi Fiskal dan Pembangunan Daerah: Badan Penerbit Fakultas Ekonomi Universitas Brawijaya (BPFE UniBraw).
[18]Kuncoro, H. (2004). Pengaruh transfer antar pemerintah pada kinerja fiskal pemerintah daerah kota dan kabupaten di Indonesia. Economic Journal of Emerging Markets, 9(1).
[19]Madsen, B. (2011). Statistics for Non-statisticians: Springer Science & Business Media.
[20]Malik, S., Mahmood-ul-Hassan, & Hussain, S. (2006). Fiscal decentralisation and economic growth in Pakistan. The Pakistan Development Review, 845-854.
[21]Malmudi. (2010). Analisis Laporan Keuangan Pemerintah Daerah: Panduan bagi Eksekutif, DPRD, dan Masyarakat dalam Pengambilan Keputusan Ekonomi, Sosial, dan Politik. Yogyakarta: Unit Penerbit dan Percetakan Sekolah Tinggi Ilmu Manajemen YKPN.
[22]Mardiasmo, A. (2002). Otonomi dan Manajemen Keuangan Daerah: Good Governance, Democratization, Local Government Financial Management: Edisi Bahasa Indonesia, Penerbit Andi, Yogyakarta.
[23]Martinez-Vazquez, J., & McNab, R. M. (2003). Fiscal decentralization and economic growth. World development, 31(9), 1597-1616.
[24]Muller, K. (2001). Background Texts For The Amungme Book: www.papuaweb.org. [25]Muller, K. (2003). The mollusks of Kamoroland. Indonesia: www.papuaweb.org. [26]Musgrave, R. A., & Musgrave, P. B. (1973). Public finance in theory and practice.
(online) = ISSN 2285 – 3642 ISSN-L = 2285 – 3642
Journal of Economic Development, Environment and People Volume 7, Issue 1, 2018
URL: http://jedep.spiruharet.ro e-mail: office_jedep@spiruharet.ro
[28]Patton, & Cochran. (2002). A Guide to Using Qualitative Research Methodology: Medicins Sans Frontieres (Vol. 2nd). Newbury Park, Calif: Sage Publications.
[29]Pouwer, J. (2010). Gender, ritual and social formation in West Papua; A configurational analysis comparing Kamoro and Asmat: Brill.
[30]RadioNewZealand. (2017). Way forward found in Freeport dispute with Jakarta, Radio New Zealand. Retrieved from http://www.radionz.co.nz/international/pacific-news/328205/way-forward-found-in-freeport-dispute-with-jakarta
[31]Rahman, N., Naukoko, A., & Londah, A. (2014). Analisis Perbandingan Kemampuan Keuangan Daerah di Provinsi Sulawesi Utara (Studi pada Kota Manado dan Kota Bitung Tahun 2008-2012). Jurnal Berkala Ilmiah Efisiensi, 14(3).
[32]RUDIYANTO, M., & SASANA, H. (2015). ANALISIS KINERJA KEUANGAN SERTA KEMAMPUAN KEUANGAN
PEMERINTAH DAERAH DALAM PELAKSANAAN OTONOMI DAERAH (Studi pada Daerah Kabupaten/Kota di Provinsi Daerah Istimewa Yogyakarta dan Provinsi Banten). Fakultas Ekonomika dan Bisnis.
[33]Sethi, S. P., Lowry, D. B., Veral, E. A., Shapiro, H. J., & Emelianova, O. (2011). Freeport-McMoRan Copper & Gold, Inc.: An innovative voluntary code of conduct to protect human rights, create employment opportunities, and economic development of the indigenous people. Journal of business ethics, 103(1), 1-30.
[34]Sidik, M. (2002). Optimalisasi pajak daerah dan retribusi daerah dalam rangka meningkatkan kemampuan keuangan daerah. Makalah disampaikan Acara Orasi Ilmiah. Bandung, 10.
[35]Sularso, H., & Restianto, Y. E. (2012). Pengaruh Kinerja Keuangan Terhadap Alokasi Belanja Modal dan Pertumbuhan Ekonomi Kabupaten/Kota di Jawa Tengah. Media Riset Akuntansi, 1(2).
[36]Sumarsono, H. (2009). Analisis kemandirian otonomi daerah: kasus Kota Malang (1999-2004). Jurnal Ekonomi dan Studi Pembangunan (JESP), 1(1).
[37]Timang, S. (2016). Amungme Di Antara Sejarah Pasang Surut Papua. Yogyakarta: PT. Kanisius.
[38]Tongco, M. D. C. (2007). Purposive sampling as a tool for informant selection. Ethnobotany Research and Applications, 5, 147-158.
[39]Utomo, S. P. (2012). Pengaruh Kinerja Keuangan Terhadap Pertumbuhan Ekonomi Daerah Dengan Alokasi Belanja Modal Sebagai Variabel Pemediasi. Universitas Sebelah Maret, Surakarta.
[40]Vurry, A. N., Suwendra, I. W., & Yudiaatmaja, F. (2014). ANALISIS KEMAMPUAN KEUANGAN DAERAH DAN TREND PADA PEMERINTAH KABUPATEN BULELENG TAHUN ANGGARAN 2004-2013. Jurnal Jurusan Manajemen, 2(1). [41]Walton, A. (2008). Extracting Natural Resources: Corporate Social Responsibility and the Rule of Law: case Study
Regarding the Amungme, Kamoro and Freeport
[42]Xie, D., Zou, H.-f., & Davoodi, H. (1999). Fiscal decentralization and economic growth in the United States. Journal of Urban Economics, 45(2), 228-239.
[43]Yahoo-Finance. (2017). Freeport-McMoRan Updates Status of PT Freeport Indonesia Operations, Yahoo Finance. Retrieved from https://finance.yahoo.com/news/freeport-mcmoran-updates-status-pt-141700714.html [44]Zhang, T., & Zou, H.-f. (1998). Fiscal decentralization, public spending, and economic growth in China. Journal of