This titlais no Indexed in Scopus
---seer- ·PLANNING MALAYSIA
Geospatial Analysis in Urban Planning Volume II (2013), Page 23 - 38
ESTIMATION OF RESIDENTIAL IMPERVIOUS SURFACE USING GIS TECHNIQUE
M. Rafee Majid\ Jamal Aimi Jamaludin2 & Wan Yusryzal Wan lbrahim3
Abstract 1
·2&3Centrefor Innovative Planning and Development (CiPD) Faculty of Built Environment
UNIVERSITI TEKNOLOGI MALAYSIA
Urban impervious surface in the form of rooftops, street pavement, parking lots, etc. is an important contributor to water pollution, urban heat island, flash floods and other environmental degradations. While studies on the extent of impervious surface are common in advanced countries, few have been carried out in developing countries. This paper discusses a study on the nature of impervious surface coverage in a southern city in Malaysia. The study focuses on impervious surface in several residential areas, looking at the relationship between impervious surface and housing density as well as the source of the surface. Remote sensing images combined with some GIS techniques were employed for this purpose. The percentage o[ impervious surface measured ranged from 40-95%, well above the values indicated from similar studies overseas. While density was a factor in the amount of impervious surface, it was not the only factor. Other factors such as policies on impervious surface control were also important as illustrated by comparison of the results of this study to similar studies reported in the USA. Based on these findings, the paper offers several steps towards reduction of impervious sw'face in residential areas.
Keywords: Impervious surface, remote sensing, GIS, residential imperviousness.
1 Associate Professor at Department of Urban and Regional Planning, Faculty of Built Environment, Universiti Teknologi Malaysia. Email: [email protected] (Corresponding Author)
M. Rafee Majid, Jamal Aimi Ja111a/11di11 & Wa11 Y11sryzal \Va11 lbralri111 Es1i111a1io11 of Residemial Impervious Swface using GIS Teclr11iq11e
INTRODUCTION
Any material covering the ground that prevents infiltration of water into the soil can be classified as an impervious surface (Arnold & Gibbons 1996). While it is not a single homogeneous quantity, when impervious surface is used as a landscape indicator it is typically presented as a percentage of the land that is covered with impervious materials. The word imperviousness is also regularly used to refer to the extent of this percentage.
Impervious surfaces come in different types such as paved surfaces (roads, parking lots, sidewalks, etc.) and building rooftops that fall unambiguously under the definition of impervious surface. Yet there are also traditionally pervious surfaces, man-made and natural, that are so heavily compacted that they become functionally impervious. Examples of these are compacted soil in construction areas, dirt roads, bedrock outcrops and, even to a certain extent, grass turf in our residential areas. This paper, however, focuses on the earlier category of impervious surfaces, i.e. paved surfaces and building rooftops.
It is a fact that urbanisation carries with it a series of environmental concerns such as water and air pollution as well as increase in temperature and occurrence of flash floods. On many occasions have these been linked to the extent of impervious surface, an indicator that defines urbanisation. As development alters the natural landscape, the percentage of land covered by impervious surface also alters, i.e. it increases. Increase in urban impervious surface has been identified by many studies as an important contributor to a host of urban problems including water pollution, urban heat island, flash floods and other environmental degradations (Hammer 1972; Booth 1991; Schueler 1994; Arnold & Gibbons 1996).
While studies on the extent of impervious surface are common in advanced countTies, only a few have been carried out in developing countries. Lacking empirical local values, guidelines or manuals requiring the use of impervious surface estimate simply adopts values from overseas such as the case of Manual Saliran Mesra Alam or MSMA adopting values from Australia (MSMA 2012). The justification for such action comes into question given our different approach towards development. In view of that, this paper discusses a study on the nature of impervious surface coverage in Johor Bahru, Malaysia. The study focuses on impervious surface in several residential areas, looking at the relationship between impervious surface and housing density as well as the
PLANNING MALAYSIA Geosparial Analysis in Urban P/a1111i11g
source of the surface. Remote sensing images combined with GIS techniques were employed for this purpose.
IMPERVIOUS SURF ACE IN HOUSING AREAS
There have been very few studies (if any) on the amount of impervious surface
per unit urban area in Malaysia, even though impervious surface has been
recognised as an important indicator of urbanisation and its associated impact
on the environment. The parameters concerning impervious surface that have
been adopted for local uses, in runoff estimation for example, are those from
developed countries such as Australia and the USA. One example of empirical
values obtained from overseas is those reported by the Soil Conservation Services (SCS) in the USA listed in Table 1. The validity of such values for
usage in Malaysia is however questionable due to several factors. Our more
compact housing areas would in theory lead to higher percentage of impervious
surface per unit area. The maximum density of single-family housing in
Malaysia which can reach up to 30 units per acre, for example, is much more
than the maximum depicted in the table. Other factors such as building design,
street standards, and subdivision regulations are also different from those in the
USA and would definitely influence the amount of impervious surface. Thus, it has been long overdue that we know exactly the extent of our impervious
surface and its relationship to urbanisation.
Table l: Impervious surface according to urban land use (SCS, USA)
Urban Land Use Average Impervious Surface(%)
Commercial Area 85
Industrial Area 72
I-lousing Area (According to Densit)'.'.):
8 units/acres or more 65
4 units/acres 38
3 units/acres 30
2 units/acres 25
I units/acres 20
I /2 units/acres 12
The relationships between the characteristics of housing areas,
patiicularly density and design, and the amount of impervious surface have been
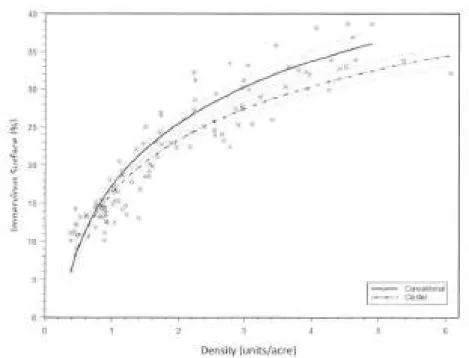
studied extensively in developed countries (see Majid 2005; Stone Jr. 2004; Capeilla & Brown 200 I). Majid (2005), for instance, showed that the amount of
impervious surface was correlated to density and design in a non-linear manner
M. Rafee Majid, Jamal Aimi Ja111a/11din & Wan Yusry~al Wan Ibrahim Es1i111a1io11 of Reside111ial /111pervio11s Swface using GIS Technique
(Figure I). The gross densities calculated in his study were however relatively low compared to what is prevalent in Malaysia, i.e. 0.5-6 units/acre in contrast to about 4-30 units/acre in Malaysia. Thus the impervious surface percentage of between 10-40% reported by him would be well below what is expected for housing areas in Malaysia whose densities are higher.
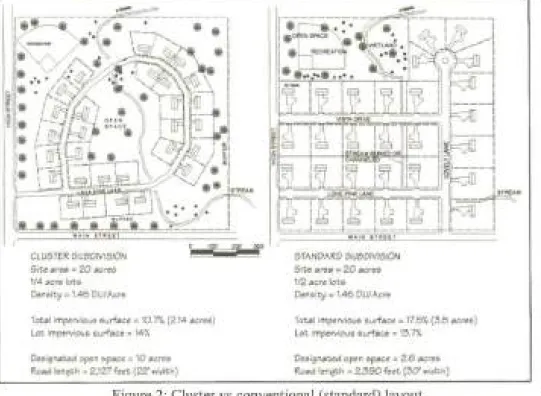
In addition to density, the design of housing layout also plays an important role in determining the amount of impervious surface. In the same study, Majid (2005) also reported that conventional layouts (where the whole development parcelled out into individual housing lots) resulted in higher imperviousness than cluster layouts (conservation layouts that leave some open space for conservation). The difference in imperviousness level between the two layout types is shown in Figure J while Figure 2 highlights the many advantages of a cluster layout over a conventional one. Though originally promoted for conservation of critical open spaces, cluster layouts have lately been promoted more as an alternative design to reduce imperviousness (Arnold
& Gibbons I 996; Schueler 1996; Arendt 1996).
40
35
30
~ 25 a. ~
"
! 20 v~
c ·~
15 a.
c
E
10
0
x
0 x
2
0 0
• .)t ,Go x x x ~-~ ~)(
. x
x
Density (units/acre) 0
'! .. -.
-6
Figure I: Impervious surface vs housing density in North Carolina, USA Source: Majid, 2005
PLANNING MALAYSIA Geospatial Analysis in Urban Planning
Depending on lot size and the road network, Schueler (1996) claims that cluster development can potentially reduce site imperviousness by as much as 10-50%. In density-neutral provision for cluster development, a developer is still committed to the total units as in conventional development but has the flexibility to place them in a way that is more responsive to the physical characteristics of the site. In spite of more open space, density is maintained by allowing smaller lots than the conventional developments. Smaller lot size that results in narrower and shallower Jots also helps reduce the lineal length of streets and total length of driveways. Clustering lots closer together also results in shorter roads.
I ___ ..:::::;__~--
-,
.,__.
·
,
• ·-
.
• •I
I/ •• '--,...,,....I
:- •
,
,
•
~·.. >
-..
1• / ' , 9 __..;r._~X:,. . . I
I•
....
/<
:
)
.>
.}'.
•
.
~>\'~'
1'le / /' '· r :... ',(":~ '
e
·
f.::-' ::r " • •r-
-
-""'
~·
'uifJ
'1~
I
1I II
~I.
t.._J#$L
...
~
r-~ -~
_,
1I
I
iN~,. •••C• II
•
I ~-- --1 , - - I'
•
rIT\Gi~
·
• •
z,
4-
Yf!!. ,
~:
1 1 _ _. --r--r-1 "~ )-' 11
Je r~ ~ (.~
•
I
I J..!_Jllllli=::1I E3. I ~..1---Jt, ,_, / ' -.../ : • I
l ~···~-tt'1~ • ,...,
i- "'M"
I
~,,_
I
I I~ I ' • • II ..L _J-~-J ' • • ' I
I '-- - ,,,. .. ,. ~ I
:.,_._.__.,,,_..__._=·-=-..._...!_::'.::
__
-==~( ... fllll'tll
CLUSTER SUOOl\l:SION
S.te •re. • 20 .ocre5
1/4 •ere lot•
Denelty = 1.45 DU//\Gno
0 I f W f
Tot.I ln-pcrvioue &urf•ce • 10.7'!. (2.14 •cnoe)
Lot lmpef'lliou& &urf.oce • 147,
De6<gNlted c>p<:n &p..:e -10 .ocnoe
R04ld len9tll = 2.1Z7 f~ (22' width)
- - - • ••_ .. !U:Ut ST/IND/IRD SU&DMSION
~te • .,,.. ~ 20 ac:ree
1/2 •ere loi.
Den.-ty = 1.45 DU//\Gno
Tot.I 1mperviou6 &urf•ce = 17.b'/, (:3.5 .ocree) Lot lmperAou6 eurf•ce = 1:3.n.
De•'!!Nlted open ~.oce = 2.6 .ocno• Re.ad '""9t'1 = 2.:390 f~ (:30' w'.dth)
Figure 2: Cluster vs conventional (standard) layout
Source: Arnold & Gibbons 1996
Cluster housing layout as practised in the United States (Figure 2),
however, is rare in Malaysia. Without specific regulations requiring it, housing developers in Malaysia are more content to turn the whole development into housing or commercial lots, leaving only l 0% of the area for open space as required by law. Even for the conventional layouts, there are still vast differences between housing layouts in Malaysia and those in developed
M. Rafee Majid, Jamal Aimi Ja111aludi11 & Wa11 Yusryzal Wa11 lbralii111 Esti111atio11 of Reside111ial Impervious Swface u~·ing CIS Technique
countries. Different street designs, for example, might contribute to the
difference in the overall impervious surface amount. In addition to that, a
peculiar Malaysian penchant for paved compound around their houses, that is to a certain extent encouraged by lack of specific regulations concerning impervious surface limits, does also contribute to the amount of impervious
surface.
REMOTE SENSING AND QUANTIFICATION OF IMPERVIOUS
SURFACE
Remote sensing is a method which records the information of an object or a
phenomenon on earth surface from afar by using electromagnetic wave. It is
usually done through image interpretation gained from afar by using the satellite or aircraft. Most remote sensing image interpretation now uses satellite images of various brands and resolution due to low cost and high resolution. Some of
the currently popular images in accordance to resolution are A VHRR (low
resolution), Landsat TM and SPOT (medium resolution), and IKONOS as well
as Quickbird (high resolution).
The study of the relationship between impervious surface and land use
has long begun since l 970's in the field of urban hydrology (Brabec et al.
2002). According to Brabec et al.(2002), the total size of impervious surface can
be measured through four methods; I) identifying impervious surface in the
aerial photo and made measurements by using planimeter (example Stafford et al. I 974; Graham et al. 1974); 2) by placing grids on the aerial photo and count the number of squares covered by Impervious surface and other land uses (example: Gluck and McCuen 1975; Hammer 1972; Ragan & Jackson 1975); 3)
using the method of remote sensing image classification (example: Ragan and Jackson 1975); 4) corresponding the percentage of urbanisation rate with the
percentage of impervious surface (example: Morisawa & LaFlure 1979).
Several studies also show that there is a significant difference between the relationship of impervious surface percentage and demographic factors
including population density, household size and number of job opportunities
(Stankowski 1972; Graham et al. 1974; Gluck & McCuen 1975). However,
these studies depend solely on the study areas chosen, and are unsuitable to be
implemented for all urban areas.
The early mapping of impervious surface by using remote sensing
images has begun by interpreting visual aerial photos but this method is complicated and time consuming when a large area is involved. Besides, the
PLANNING MALAYSIA
Geospatial Analysis in Urban Planning
manual method is subject to a high tendency of human error, even by skilled personnel. The aerial photos are also taken on different dates and scales, which need further rectification, digitation and time consuming interpretation. The
establishment of Landsat Multispectral Sensor Satellite in year 1972 has
provided the digital satellite image world with full view of the earth surface. By using these images, exclusive computer programs and impervious surface measurement through spectral analysis method begin to produce outputs comparable to that of the manual method - within a sho11er time (Ragan & Jackson 1975).
Compared to aerial photo, remote sensing images covers a larger area and produce a more consistent output - which can also be used in GIS. After the
classification procedure has been determined for a certain image, all the
remaining images shall be classified using the same procedure in a shorter amount of time, as compared to the manual method. Other special attribute of remote sensing image is that is has spectral wires which resembles various types
of land cover spectral reflectance. For instance, the Landsat TM Image has six (6) spectral wires, comparing to coloured aerial photos - which only have three
(3), and black and white aerial photos - which only have one (1).
The weakness of remote sensing image is its large pixel size for certain
cheap images; Landsat TM with 30m x 30m pixel, for instance. However, there
are expensive small pixel images such as IKONOS ( 4m x 4m for multispectral,
Im x 1 m for panchromatic), Quickbird (2.4m x 2.4m for multi spectral, 60cm x
60cm for panchromatic), Geoeye-1 (l.65m x 1.65m for colour and 0.4lm x
0.4lm for black & white) and Worldview-2 (0.46m x 0.46m for panchromatic images). Large sum of monetary cost would be required if used on a wide area
by using these high resolution images because it implicates a large number of
images to be produced. For the current study, Quickbird Image shall be
employed for the area of Johor Bahru Tengah Municipality (MPJBT) and Kulai Jaya Municipality (MPKJ).
The earlier method of impervious surface measurement using spectral
information from remote sensing images are classification method and other clustering, thresholding and modelling methods (see Wu and Murray 2002; Rashed et al. 2003). The outputs are usually presented in the form of maps
which shows the existence of impervious surfaces in certain pixels. Forster
( 1985) reminded about the inaccuracy of this method due to the large pixel size
in representing a land use or, it is impossible for a whole area to be covered with impervious surface, and vice versa. However, this statement was done based on the pixel size of Landsat TM image, which is known to be large (30m
M. Rafee Majid, Jamal Aimi Ja111al11di11 & Wan Y11sryzal Wan lbraltim
Estimation of Residential Impervious Swface 11sing GIS Tecltniq11e
x 30m). The current high resolution satellite images such as IKONOS and Quickbird will produce a more accurate output by using the same method. The
current methods are used for the purpose of improving this weakness by
combining machine learning algorithms and spectral mixture analysis to get impervious surface at the sub-pixel levels. This method is more accurate and has been proven by Flanagan & Civco (2001), Wang et al. (2000), Ji & Jenson ( 1999), Wu & Murray (2002), Ward et al. (2000), Rashed et al. (2003) and Yang et al. (2003). Based on the early visual checks, it shows that the content of impervious surface in the study is high. Hence, the current study shall employ the method of classification based on pixel; not sub-pixel for the purpose of impervious surface measurement. The high content of impervious surface and high resolution images used has been predicted to be able to provide accurate information on the real content of impervious surface in a certain housing area.
ESTIMATION OF IMPERVIOUS SURFACE AREA
Motivated by the lack of specific information on the amount of impervious
surface in urban housing areas in Malaysia and the desire to compare this
amount to those reported by studies carried out in other countries, the authors set out the study with the following objectives: I) to quantify the amount of impervious surface in urban housing areas in Malaysia using remote sensing
images (Quickbird images); 2) to establish the relationship between the amount
of impervious surface as the dependent variable and density of housing as the explanatory or independent variable; and 3) to compare the extent of residential imperviousness in Malaysia to those in other countries.
The study was carried out through the following four steps:
Step I: Identifying residential areas with different densities to measure the total
size of impervious surface;
Step 2: Processing Quickbird Satellite Images by integrating various remote sensing techniques with GIS in order to calculate the total size of impervious surface;
Step 3: Generating a regression model, which is able to forecast the total size of impervious surface based on the densities of the residential areas; and
Step 4: Recommending policies and planning guidelines which are able to
minimize the total size of impervious surface. The following section introduces the study area and discusses the detailed steps involved.
Study area
PLANNING MALAYSIA
Geospatial Analysis in U1·ba11 Planning
Since the study was to investigate the percentage of impervious surface in
housing areas, its unit of analysis was urban housing areas located in two
municipalities in the southern part of Johor. The two municipalities were Johor
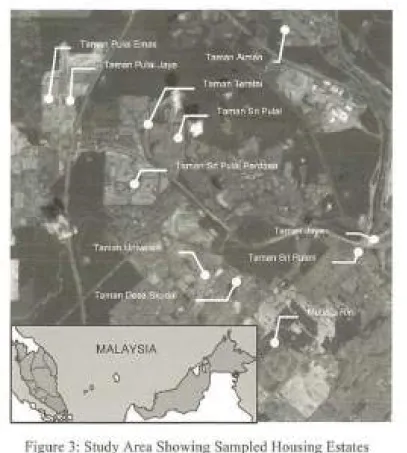
Bahru Tengah Municipality and Kulai Jaya Municipality. Johor Bahru Tengah Municipality covers an area of 339 km2 with a population of roughly 525,351 while Kulai Jaya Municipality has a population of 130,000 within an area of
747 km2• A total of 11 housing areas were randomly selected for the study and Figure 3 below shows their locations. The housing areas come in various sizes from as small as a few hundred acres to as large as close to a thousand acres.
The age of the housing areas varies from as old as 30 years (Taman Jaya, Taman Aman) to as young as less than I 0 years (Taman Pulai Emas, Taman Pulai Jaya). The gross density of each housing area too varies but what is of interest here is the density of each housing type which would in the end determine the amount of impervious surface.
Figure 3: Study Area Showing Sampled Housing Estates
M. Rafee Majid, Jamal Aimi Jamaludin & Wan Yusryzal Wan Ibrahim Estimation of Residential Impervious S111/ace using GIS Teclt11iq11e
Data and Image Processing
The study used two forms of raw data, i.e. QuickBird 0.6m remote sensing images of the study area and digital layout plans delineating the housing lots and boundaries of the housing areas. All of the processing work was done on ERDAS Imagine and ArcGIS 9.2. Pre-processing of the satellite images using a geometric correction technique was first carried out on the images before they could be used. Rectification of the satellite images to the local coordinates, Rectified Skewed Orthomorphic (RSO) coordinates, was carried out with the help of a GPS receiver for collection of ground control points within the study area.
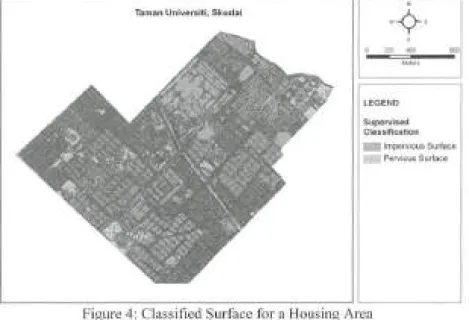
The following stage involved classification of the images in order to distinguish impervious surfaces from previous ones. The classification process involved both unsupervised and supervised classifications. The results of the classification process were classified images that had only two types of land
surfaces, i.e. impervious and pervious surfaces. The classified raster images were then converted into vector format in ArcGIS 9.2 for quantification of the amount of impervious surface. In order to do this, the vectorised classified images were overlaid with the digital layout plan before the images for each of the 11 housing areas were clipped out. Figure 4 shows one such housing area with the impervious and pervious surfaces classified.
© 2013 by MIP
laman Universitl, Skudai
LEGEND
Supervised Clnssiflc;itlon
Impervious Surface Pervious Surface
Figure 4: Classified Surface for a Housing Arca
PLANNING MALAYSIA
Geospatial Analysis in Urban Planning The trend of urban housing development in Malaysia is that each housing area
or estate would have a mixture of houses built in zones differentiated by house types. Thus, in a housing estate one would normally find bungalows in a zone separated from semi-detached (semi-D or duplex) houses which are in their own
zone separated from terraced (linked) houses and so on. In order to capture the
whole range of housing densities, the study made use of these existing housing categories for sampling of house groups to calculate the amount of impervious
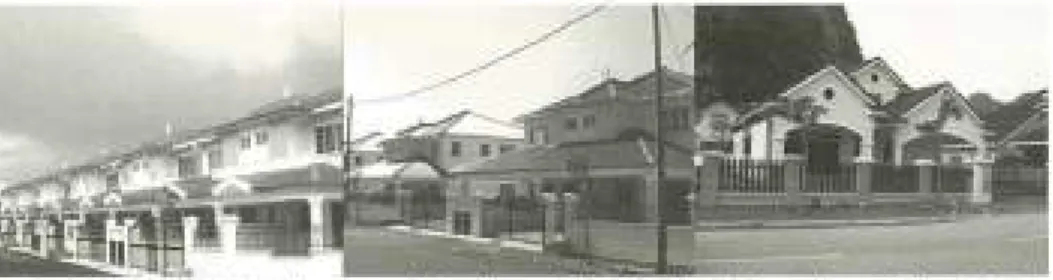
surface. Figures 5 shows typical house types in Malaysian housing estates. A total of 28 housing samples from the selected housing estates were randomly chosen for analysis. For each of these housing samples, the percentage of
impervious surface was computed using zonal summary technique of ArcGIS
9.2.
..
Figure 5: Typical housing types: linked, semi-detached and bungalows (left to right)
RESULTS AND DISCUSSIONS
The ensuing discussion will highlight the relationship between degree of imperviousness and housing density. Before looking into the relationship
between the two variables, however, it is appropriate that we look at the basic
statistics of the variables collected in the study areas. This will give us an overview of the characteristics of the housing areas studied, especially those
concerning intensity of development and impervious surface.
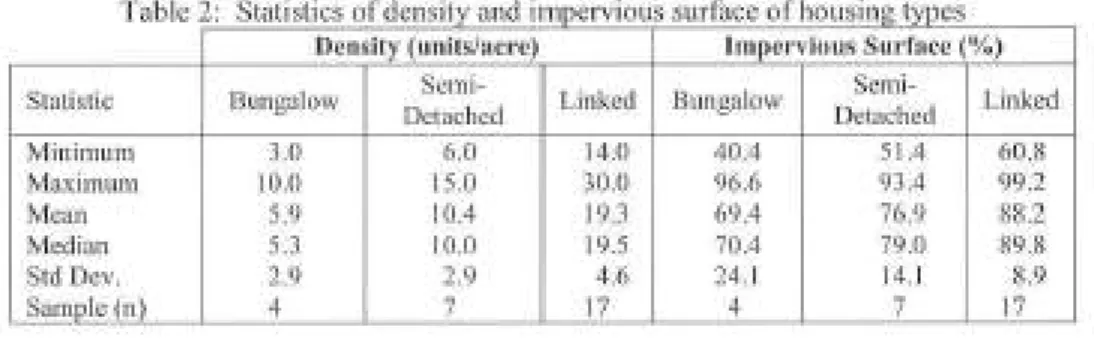
For the three housing types that are the subject of this study, Table 2 gives the details of their densities. In general, densities of the houses cover quite a range from as low as 3 units per acre for bungalows to as high as 30 units per acre for linked houses. These densities seem to double from one type to another
of higher density. The mean density of linked houses, for example, is twice that of the semi-detached houses which itself is about twice the mean density of the
bungalows. Overall, it is evident that housing densities in Malaysia are much
higher than those in the developed countries where previous studies on impervious surface had been carried out (see Stone 2004; Majid 2005; Capeilla
M. Rafee Majid, Jamal Aimi Ja111aludin & Wan Yusryza/ Wan Ibrahim Estimation of Residential Impervious Su1face using GIS Technique
& Brown 2001). Bungalows and semi-detached in the USA, for instance, are built in densities of 2-3 and 4-6 units per acre respectively. It is difficult to find the density of linked houses in the USA as this type of housing is not popular
there.
T a bi e 2 S tat1st1cs o fd ens1ty an d' 1mperv1ous sur f; ace o fh o us mg types
Density (units/acre) Impervious Surface(%)
Statistic Bungalow Semi- Linked Bungalow Semi- Linked
Detached Detached
Minimum 3.0 6.0 14.0 40.4 51.4 60.8
Maximum 10.0 15.0 30.0 96.6 93.4 99.2
Mean 5.9 I 0.4 19.3 69.4 76.9 88.2
Median 5.3 10.0 19.5 70.4 79.0 89.8
Std Dev. 2.9 2.9 4.6 24.1 14.1 8.9
Sample (n) 4 7 17 4 7 17
Table 2.0 also includes the statistical summary of the percentage of
impervious surface for each housing type. They range from as low as 40% for
bungalows to as high as 99% for linked houses. As expected, the higher the density the more the impervious surface. The linked houses have the highest impervious surface percentage that ranges from the minimum of 61 % to the maximum of almost I 00%, with the mean of 88%. Given the density of this kind of housing that can go up to 30 single-family units per acre, the high percentage of impervious surface is expected. What is not expected is the high percentage of impervious surface for the bungalows. At the mean density of 6
units per acre, the mean impervious surface percentage of these bungalow areas
are at 69% which exactly doubles the impervious surface percentage of
American bungalows at the same density (See Figure I).
Among the factors that contribute to the higher percentage of
impervious surface in Malaysia are the road design standards that allow for
excessive pavement, the practice of converting green compounds into paved
ones by some house owners and of course, since we are comparing to overseas planning regulations, lack of regulations in Malaysia that set the limits on the percentage of impervious surface. Of the two major components of impervious
surface studied, rooftops made up on average 70% of the total amount of
impervious surface while road pavement made up 25%. The remaining 5%
consisted of driveways, footpath, etc.
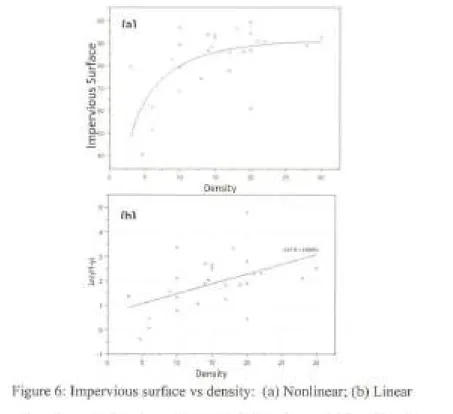
Figure 6.0 plots the relationship between imperviousness and density. The nonlinear fitted curve shows how impervious surface increases rather
dramatically from density of 1 unit/acre to 10 units/acre and then starts to taper
PLANNING MALAYSIA
Geosparial Analysis in Urban Planning
off from there on to about 90%. Ninety percent is the ultimate impervious
surface percentage due to the regulations in Malaysia that require 10% of
housing areas should be open spaces, and open spaces in most cases in Malaysia
mean green vegetation. Comparing the curve of Figure 6(a) to that of Figure l
for the same density range showcases a contrast in term of how impervious surface predominates the housing landscape in Malaysia. It is no wonder that some of these housing estates are experiencing various environmental consequences brought about by this style of urban development. Among the
environmental consequences are urban heat island, water quality deterioration,
flash floods and transformation of beautiful natural streams into disgraceful urban concrete drains.
t;, I a.i•
u
"'
't:•
::J V1 VI 7
/:
::J0
·~
..
Q.j
C...,
E
~
0 ·~
Density
lhl
_, ~
'i.
:s
1..
.._____________
_ ,10 15 20 :• 30 Density
Figure 6: Impervious surface vs density: (a) Nonlinear; (b) Linear
Logit transformation of the dependent variable in the relationship gives us the
linear regression model of the percentage of impervious surface and housing density. The linear model is given by
ln(y/(1-y)) = 0.6716+0.0Sx (Eq. 1)
where:
M. Rafee Majid, Jamal Aimi Ja111a/11di11 & Wan Yusryzal Wa11 Ibrahim £sti111atio11 of Reside11tial /111pervio11s Swface 11si11g GIS Tech11iq11e
y = proportion of impervious surface. x = housing density (units/acre)
Statistical tests indicate that the relationship is significant (p<O.O 1) with a rather low multiple R-squared of 0.25.
The results of the study show that impervious surface is directly correlated to density. This confirms the trend observed overseas. What is more important in this study is the fact that the amount of impervious surface in our housing areas is relatively too high. Too high that it causes a lot of environmental problems previously alluded to in the beginning of the paper. The amount of impervious
surface calculated, 40-90%, cannot sustain any form of lives in the streams as
studies by various researchers (Schueler & Claytor 1997; Booth 1991; Booth & Jackson 1997) have shown that watershed with impervious surface between 20-60% will kill the stream.
CONCLUSIONS
Reducing the amount of impervious surface would be easy if only the authority
were determined enough to do so. There are several ways to achieving lower
impervious surface. Among them are: I) imposing a limit on the percentage of
impervious surface per subdivisional lots or per development; 2) reviewing of
existing road standards that are outdated and very generous on pavement
-skinny streets are now the trend; 3) encouraging more cluster development and
vertical density - the two types of development that would have any chance of
conserving the environmentally sensitive areas while being neutral on density (Richards, Anderson and Santore 2003); 4) regulating renovation of the houses
- renovation that increases the amount of impervious surface within a lot should be tightly regulated; and 5) more usage of porous materials for pavement or
interlocking blocks that encourage water infiltration. There are of course numerous other steps to either reduce the amount of impervious surface or to reduce the impact of impervious surface.
ACKNOWLEDGEMENT
The author acknowledges the funding support for this research provided by the
Ministry of Higher Education, Malaysia through Universiti Teknologi Malaysia
under the Fundamental Research Grant (FRGS) Programme (Yot78 161 ).
REFERENCES
PLANNING MALAYSIA
Geospatial Analysis in Urban Planning
Arendt, R.G. ( 1996). Conservation Design for Subdivisions: A practical guide for creating open space networks. Island Press, Washington DC. 184pp. Arnold, C.L. and C. J. Gibbons. (1996). Impervious surface: The emergence of a
key urban environmental indicator. Journal of the American Planning Association 62(2): 243-258.
Booth, D.B. ( 1991 ). Urbanisation and the natural drainage system-impacts, solutions and prognoses. Northwest Environmental Journal 7( I ):93-118. Booth, D.B. and C.R. Jackson. (1997). Urbanisation of aquatic systems:
Degradation thresholds, stormwater detention and the limits of mitigation. Journal of American Water Resources Association 33(5): I 077-1090. Brabec, E., S. Schulte and P.L. Richards. (2002). Impervious surfaces and water
quality: A review of current literature and its implications for watershed planning. Journal of Planning Literature 16( 4):499-514.
Cappeilla, K. and K. Brown. (2001). Land use and impervious cover in the Chesapeake Bay region. Watershed Protection Techniques 3(4):835-840. Flanagan, M., and D.L. Civco. (2001). Subpixel impervious surface mapping.
Proceedings of the 200I ASPRS Annual Convention, 23-27 Apr. 2001, St. Louis, MO.
Forster, B.C., ( 1985). An examination of some problems and solutions in monitoring urban areas from satellite platforms. International Journal of Remote Sensing 6(1):139-151.
Gluck, W.R. and R.H. McCuen. (1975). Estimating land use characteristics for hydro logic models. Water Resources Research 11 (I): 177-179.
Graham, P.H., S.C. Lawrence and H.J. Mallon. (1974). Estimation of imperviousness and specific curb length for forecasting stormwater quality and quantity. Journal of the Water Pollution Control Federation 46(4):717-725.
Hammer, T.R. ( 1972). Stream enlargement due to urbanisation. Water Resources Bulletin 8(6): 1530-1540.
Majid, M. Rafee. (2005). Residential Imperviousness: Potential Usage of Remote Sensing and Evaluating the Influences of Density and Subdivision Designs.
Unpublished PhD Dissertation. Un iv. of North Carolina. Chapel Hill, NC. Morisawa, M. and E. LaFiure. (1979). Hydraulic geometry, stream equilibrium and
urbanisation. In Adjustments of the fluvial systems -Proceedings of the
HJ"
Annual geomorphology Symposium Series. D.D. Rhodes and G.P. Williams (eds.). Binghamton, NY.MSMA or Manual Saliran Mesra Alam. (2012). 2nd Edition. Department of Irrigation and Drainage. Percetakan Nasional Berhad.
Ragan, R.M. and T.J. Jackson. (1975). Use of satellite data in urban hydrologic models. Journal of the Hydraulics Division ASCE 101: 1469-1475.
M. Rafee Majid, Jamal Aimi Ja111aludin & Wan Yusryzal Wan Ibrahim
Esti111a1ion of Residential Impervious Swface using GIS Technique
Rashed, T., J.R. Weeks, D. Roberts, J. Rogan, and R. Powell. (2003). Measuring the
physical composition of urban morphology using multiple endmember
spectral mixture models. Photogrammetric Engineering & Remote Sensing
69(9): I 011-1020.
Richards, L., G. Anderson and M.K. Santore. (2003). Protecting water resources
with higher density developments. Proceedings of the National Conference on Urban Stormwater: Enhancing program at the Local level. 17-20
February, 2003. Chicago,IL.
Schueler, T.R. ( 1994). The importance of imperviousness. Watershed Protection Techniques 1(3): I 00-1 l l.
Schueler, T.R. ( 1996). Site Planning for Urban Stream Protection. Center for
Watershed Protection. Ellicott City, MD. Available online at
http://www.cwp.org/SPSP/ TOC.htm.
Schueler, T.R. and R. Claytor. ( 1997). impervious cover as an urban stream indicator and a watershed management tool. Jn Effects of watershed
development and management in aquatic ecosystems: proceedings of an
engineering workshop. L.A. Roesner(ed.). ASCE, New York. pp513-529.
Stafford, D.B., J .T. Ligon and M.E. Nettles. ( 1974). Use of aerial photographs to
measure land use changes in remote sensing and water resources
management. Proceedings 17, American. Water Resources Association.
American Water Resources Association. Herndon, VA.
Stankowski, S.J. ( 1972). Population density as an indirect indicator of urban and suburban Land-surface modifications. U.S. Geological Survey Professional
Paper 800-8. U.S. Geological Survey. Washington, DC.
Stone Jr., B. (2004). Paving over paradise: how land use regulations promote
residential imperviousness. landscape and Urban Planning 69: I 01-113. Wang, Y.Q., X. Zhang, and W. Lampa. (2000). Improvement of spatial accuracy in
natural resources mapping using multisensor remote sensing and
multisource spatial data. Proceedings of the 4th International Symposium on Spatial Accuracy Assessment in Natural Resources and Environmental
Sciences. 12-14 July 2000. Amsterdam, The Netherlands. G.B.M. 1-leuvelink and M.J.P. Lemmens (eds.). Delft University Press. Delft,The
Netherlands. pp723-730.
Ward, D., S.R. Phinn and A.T. Murray. (2000). Monitoring growth in rapidly
urbanised areas using remotely sensed data. Professional Geographer
52(3):371-86.
Wu, C. and A.T. Murray. (2002). Estimating impervious surface distribution by spectral mixture analysis. Remote Sensing of Environment 84:493-505.
Yang, L., C. Huang, C.G. Homer, B.K. Wylie and Michael J. Coan.(2003). An
approach for mapping large-area impervious surfaces: synergistic use of
Landsat-7 ETM+ and high spatial resolution imagery. Canadian Journal of Remote Sensing 29(2):230-240.