Empirical Validation of the RCDC and
RCDE Semantic Complexity Metrics for
Object-oriented Software
Glenn W. Cox
1, Sampson E. Gholston
2, Dawn R. Utley
2, Letha H. Etzkorn
1,
Cara Stein Gall
3, Phillip A. Farrington
2and Julie L. Fortune
21Department of Computer Science, University of Alabama in Huntsville, USA
2Industrial and Systems Engineering Management Department, University of Alabama in Huntsville, USA 3Department of Computer Science, Edinboro University of Pennsylvania, USA
The Relative Class Domain Complexity (RCDC) and Relative Class Definition Entropy (RCDE) semantic metrics have been proposed for use as complexity met-rics for object-oriented software. These semantic metmet-rics are calculated on a knowledge-based representation of software, following a knowledge-based program under-standing examination of the software. The metrics have great potential because they can be applied during the software design phase whereas most complexity metrics cannot be applied until after development is complete. In this paper, we present the results of a study to empirically validate the RCDC and RCDE metrics. We show that the metrics compare favorably with the findings of human experts and also that they correlate well with the results of conventional complexity metrics.
Keywords: object-oriented, metrics, semantic metrics, complexity, entropy
1. Introduction
Object-oriented software developers widely con-sider the complexity of code to be one of the top factors determining software cost, reliabil-ity, and main-tainability. Because of this, code complexity is probably the most commonly esti-mated software quality, and complexity metrics are included in nearly every metrics suite used for object-oriented design(OOD).
The majority of the complexity metrics used in OOD are based on the concept that the “com-plexity of an object can be defined to be the cardinality of its set of properties”[1]. Despite this common foundation, because different met-rics designers have focused on different types of properties, there is a wide variety of complexity
metrics. For example, one complexity metric – the Weighted Methods per Class(WMC)metric
[1]– simply assigns a number to represent the complexity of each method in a class, then sums the numbers. Another metric, McCabe’s Cy-clomatic Complexity (CC) metric [2] actually attempts to count the number of independent paths through a segment of code.
Most complexity metrics measure characteris-tics of the code’s syntax. These syntactically-based metrics have certain problems that limit their usefulness. First, they can be biased by in-significant differences in coding style. For ex-ample, it has been shown[3]that small coding choices, such as placing multiple functions in a single line of code rather than multiple lines, can yield different syntactical metrics results, although there is no difference in the complex-ity of the function performed.
Common design metrics measure characteris-tics of the class-level structure of the program. Metrics of this type include the number of classes in the system, the number of functions in the system, etc. Obviously, these metrics are limited in the amount of information they can give about the complexities of individual classes.
A more detailed design metric is Depth of Inher-itance Tree (DIT), which examines the inheri-tance relationship between classes in a system. Although this metric does examine the impact of inheritance on a particular class’s complexity, it is perhaps more useful in providing a system-wide view of class relationships than it is in giving an examination of per class complexity. Another well-known design metric(a variant of the WMC metric)counts the member functions of a class.
While these and other syntactically-based de-sign metrics are capable complexity metrics, they suffer from some of the problems com-mon to most syntactic metrics. For example, they are sensitive to stylistic design differences that human evaluators would consider to be in-significant. Also, most of the conventional de-sign metrics are intended for use at a structural level and give little specific information about particular portions of the system that might have poor designs.
Etzkorn and others addressed these problems by developing the field of Semantic metrics. In-stead of measuring the syntactic characteristics of a module, semantic metrics use knowledge-based program understanding and natural lan-guage processing techniques to analyze the func-tions performed by a program, independent of the way the functions are coded. This earlier work included development of two suites of se-mantic complexity metrics for OO designs. The first was called Relative Class Domain Com-plexity(RCDC)metrics[5]and the second, Rel-ative Class Definition Entropy(RCDE)metrics
[3].
This paper presents the results of an effort to validate the RCDC and RCDE metrics. The validation was performed by comparing the re-sults of the semantic metrics with: (1) com-plexity estimates produced by software devel-opment experts and (2) and results from two conventional syntactic metrics, WMC and the Sum of the Static Complexities of Local Meth-ods(SSCLM).(SSCLM is sometimes referred
to as “WMC-McCabe”. In this paper, we use the name “Sum of the Static Complexities of Local Method” to better clarify the basis on which the metric is calculated.)
The software on which the comparison was based consisted of 40 classes extracted from two widely-used object-oriented Graphical User In-terface(GUI)packages, GINA[6]and wxWin-dows [7] and a widely used matrix math li-brary, Newmat[8]. The semantic metrics were automatically generated by the SemMet met-rics package, a Semantic Metmet-rics generation tool developed by the University of Alabama in Huntsville for the National Aeronautics and Space Administration(NASA). The three sets of results were then correlated to provide a sta-tistical comparison of the different complexity estimation approaches.
The following sections present descriptions of the metrics analyzed in this study, the analyti-cal results, and conclusions and future research directions.
2. Background
This section overviews the program understand-ing approach and tools used in the study, and defines the metrics that were validated
2.1. Program Understanding Tool
Calculation of semantic metrics requires some degree of program understanding in order to de-termine the semantics underlying the specifics of the program. The SemMet tool is based on an automatic program understanding tool called the PATRicia system [9,10]. The PA-TRicia system understands the functionality of a program in order to analyze components in Object-Oriented software. It uses a heuristic ap-proach, deriving information from the linguistic aspects of comments and identifiers, and from other non-linguistic aspects of object-oriented software, such as a class hierarchy. A complete description of the operation of the PATRicia sys-tem is available in[11].
The program understanding and information ex-traction module of the PATRicia system is called
CHRiS (Conceptual Hierarchy for Reuse
Figure 1 [11]. Among other functions, CHRiS is the module that understands program com-ments. When analyzing comments, CHRiS parses a sentence using a simple natural lan-guage parser, then uses an inference engine for semantic processing. For identifiers, CHRiS uses empirical information on common formats for variable and function identifiers to syntacti-cally tag subkeywords.
Figure 1.Operation of the CHRiS module of the PATRicia system[11].
CHRiS uses a weighted, hierarchical semantic network(a structure that represents knowledge as a pattern of interconnected nodes and arcs)
in which higher-level concepts are inferred from lower level concepts. Inference occurs through a form of spreading activation, where active nodes spread to, or infer, surrounding nodes. Natural language tokens from comments and identifiers are applied to an interface layer of the semantic net, which consists of syntactically tagged keywords, and from this layer inference proceeds to the rest of the semantic net.
The semantic network is object-oriented. It is implemented as objects and messages in the expert system shell of CLIPS version 6.0. In CHRiS, a concept is implemented as one or
more CLIPS objects. When a concept is as-serted, weighted messages are sent from that concept to surrounding concepts, and a com-parison of the weights provides an inference mechanism. The CHRiS module of the PATRi-cia system has been satisfactorily validated[9]. CHRiS produces a report that identifies con-cepts and keywords that have been found in each examined class. The report shows the number of times each identified keyword was found. It also shows the number of times each concept
(from interior conceptual graphs)was inferred from the inference engine of the semantic net-work.
2.2. Representing Semantic Information
In SemMet, semantic information is represented using Conceptual Graphs, a widely-used know-ledge representation technique[12]. A concep-tual graph is a finite, connected, bipartite graph that contains two different types of nodes, con-cepts and conceptual relations. A concept is an internal representation of an entity. Conceptual relations specify the role that a concept plays with respect to another concept. Arcs in a con-ceptual graph form links between concepts and conceptual relations.
Figure 2.Conceptual graph example[12].
A frequently used example of a conceptual graph is shown in Figure 2. This conceptual graph states that a Cat is Sitting on a Mat. Specifically, the conceptual graph states that the concept“cat” has the state “sit” at the location “mat”.
Detailed information about semantic graphs can be found in reference[12].
2.3. Mathematical Definition of the RCDC Metrics
the reader’s convenience, the mathematical def-inition is summarized in this and the following section. A more complete definition can be found in references[13]and[14].
The following mathematical notation is used to define the RCDC metrics. Let{C1,C2, . . . ,Cm}
denote the set ofmclasses in a system. For each class Ca, Oa denotes the set of concepts in the
knowledge base associated with Ca and Ka is
the set of keywords in the knowledge base asso-ciated withCa. LetObe the set of all concepts
in the knowledge base. LetIa = Ka∪Oa; this
is called the set of ideas associated with class Ca.
Let→be a relation between conceptspandqin setOsuch thatp→qif and only if there exists a conceptual relation fromptoq.
The RCDC metrics are based on the Class Do-main Complexity (CDC) semantic metric de-fined by Etzkorn and Delugach[5].
The CDC metrics make use of semantic rela-tionships between the concepts to estimate the tightness of the internal coupling within a class. Specifically, CDC is based on the count of the number of conceptual relations that link each concept with other concepts in the class. It is defined by:
CDC counts the concepts and their associated conceptual relations, and multiplies the counts by a weighting factor for each concept. The suggested scale for concept weighting factors ranges from 1.0 for complex concepts to 0.25 for simple concepts[5].
Three versions of the CDC metric have been de-veloped, each of which uses a slightly different method to calculate the metric. The versions are:
•CDC0=
i∈Oa
(1∗wi),
where wi is the weighting factor for concepti.
This metric simply sums the complexity weight-ings for the concepts in the class[13]
•CDC1=
i∈Oa
((1+|{x|i→x∧x∈Oa}|)∗wi)
This metric determines, for each concept in the class, the number of other concepts that have a conceptual relation with it, and takes the weighted sum across all of the concepts in the class[5, 13].
•CDC2=
i∈Ia
((1+|{x|i→x∧x∈Ia}|)∗wi),
This metric extends the CDC1 definition to in-clude keywords identified from the class[14]. The CDC metrics can be viewed as giving an absolute estimate of complexity. In some cases, there is value in considering the complexity of a class with respect to the complexity of the other classes in the same system. This is the goal of the Relative Class Domain Complexity
(RCDC)metrics suite[5].
There are RCDC metrics that correspond to each of the CDC metrics. In general, the RCDC rics are generated by calculating the CDC met-ric, then normalizing by the maximum CDC for all of the classes in the system. That is:
RCDCx for class i=CDCx for class i / maximum CDCx for any class in the system
wherexis 0, 1, or 2. If all CDCx’s in the system are 0, RCDCx is defined to be 0.
It should be noted that the RCDC definition is specific for a knowledge base with a conceptual graph structure.
2.4. RCDE Metrics
The RCDE metrics are based on the Semantic Class Definition Entropy (SCDE) metric de-fined by Etzkorn, Gholston, and Hughes [3]. SCDE is a complexity metric that uses informa-tion theoretic and program understanding ap-proaches to assess the domain information con-tent of a class. It reflects the complexity of the task that the class performs in the domain
(that is, the complexity of the task, if it was performed by a human).
SCDE is defined by:
SCDE =−
n
i=1
[(fi/N)log2(fi/N)]
wherenis the number of unique domain-related concepts or keywords,Nis the total number of
(non-unique) domain related concepts or key-words, and fi, 1 ≤ i ≤ n is the frequency of
occurrence of the ith domain-related concept or keyword.
The Relative Class Definition Entropy(RCDE)
metric expresses the SCDE of a class relative to the other classes in the same system. RCDE is defined by:
RCDE for class i = SCDE of class i / maximum SCDE for any class in the system
RCDEa and RCDEb are calculated in the same way from SCDEa and SCDEb:
RCDEa = SCDEa of the class / max SCDEa for any class in the system
RCDEb = SCDEb of the class / max SCDEb for any class in the system
2.5. Summary of Previous Theoretical Analyses of RCDC and CDC
A theoretical analysis for CDC was presented in reference [5]. Other theoretical analyses for CDC0 and CDC2, as well as for RCDC, were documented in reference [14]. These works showed that all versions of CDC meet the cri-teria for valid metrics defined by Kitchenham et al. [15] as well as the following properties of Briand et al. [16]: Non-negativity, symme-try, and monotonicity(All versions of CDC fail the null value property since they have a non-zero value for any class associated with even a single idea in the domain, even if there are no relationships within the class.) Although the RCDC metrics are measures of relative com-plexity, and not of comcom-plexity, they fulfill the properties of non-negativity and null value. Stein [13] performed a theoretical analysis of RCDE and SCDE. She showed that all three versions of SCDE meet the criteria of non-negativity, null value, and symmetry but do not meet either the disjoint module additivity nor monotonicity criteria. The RCDE metrics meet the same criteria as RCDC.
3. Validation Procedure and Results
The metrics were validated by comparing their results for a representative set of classes with independently generated complexity ratings de-veloped by human experts. Forty (40) classes were chosen from widely used open-source pack-ages to form a representative mix of scientific processing types. Twenty three (23) of the
classes were drawn from the Newmat C++ soft-ware package, which is an open-source mathe-matical application for matrix manipulation[8]. The selected Newmat classes include code for both matrix and scalar processing. The other 17 classes were drawn from two Graphical User Interface (GUI) packages, GINA and
wxWin-dows. These classes include a wide range
of processes for GUI processing techniques, graphical user input, and display management routines.
The validation project was structured as three
independent experiments. For each
experi-ment, the SemMet tool was used to generate the RCDC and RCDE metrics for a selected subset of the 40 classes. The same classes were pro-vided to a team of software developers for inde-pendent rating of the class’s complexity. Each team member rated the complexity of each class using a numeric scale and the results were av-eraged for each class and for each team. The RCDC and RCDE results were then correlated with the team’s ratings.
Experiment 1 focused on the 17 classes from
the two GUI packages. The human team (
re-ferred to as Evaluation Team 1) was made up of seven software engineering experts. Each of the members of the team has a B.S. in computer science or electrical engineering and all but one also have an M.S. degree. Each has from 5-15 years of experience in software design and de-velopment and at least 3 years experience with
C++and GUI development. None of the team
members were initially familiar with the sys-tems examined.
Experiment 2 concentrated on the 13 wxWin-dows classes. The human team, Evaluation Team 2, was composed of 15 graduate stu-dents drawn from a graduate-level software en-gineering class. Each of the members of the team had prior experience in object-oriented software, particularly C++, and most had sev-eral years of experience in software design and development. By covering many of the same classes as Experiment 1, Experiment 2 helped verify Experiment 1 results as well as adding in-formation about the performance of the metrics for the wxWindows classes.
In each experiment, team members rated the complexity of each class on a scale from 0 to 1, where “not complex” = 1.00, “fairly com-plex”=0.50, and “very complex”=0.00. The numeric ratings were combined to compute an average expert rating for each class. Group inter-rater reliability for Evaluation Team 1 was 0.9038, for Evaluation Team 2 was 0.4160, and for Evaluation Team 3 was 0.5208.
In addition to correlating RCDC and RCDE with the human experts, the two semantic met-rics were also correlated with SSCLM. SSCLM is a traditional (syntactic) development-phase complexity metric[10]that is an advanced ver-sion of Chidamber and Kemerer’s WMC metric
[1]. SSCLM is calculated by
SSCLM =
n
i=1
ci
where nis the number of methods in the class andciis the McCabe’s Cyclomatic Complexity
[2] of the ith method. In a previous study[10], Etzkorn has shown that SSCLM provides a good measure of the complexity of an object-oriented class and is superior, in fact, to the widely-used WMC metric.
A statistical analysis was performed to corre-late the metrics with each other and to gain in-sight into the relevance of common factors con-sidered by the metrics. Comparing metrics to other metrics using a correlation is a common research method. For example, Kabaili et al.
[18] correlated cohesion metrics with coupling metrics to validate cohesion metrics as change-ability indicators. Mitchell and Power[18] cor-related run time coupling metrics with a static coupling metric to examine the usefulness of the run time coupling metrics. Li and Henry [19] examined correlations between various metrics in order to determine their usefulness within a multi-variate regression model.
3.1. Complexity Metrics Compared to Evaluation Team Ratings
The analysis was based on the hypotheses: H0 : p = 0(Null hypothesis)– There is no significant correlation between the specified complexity metric and the average rating produced by the specified Evaluation Team. H1:p=0(Alternative hypothesis)– There is significant correlation between the
speci-fied complexity metric and the average rat-ing produced by the specified Evaluation Team.
Correlation was measured using the standard Pearson’s correlation coefficient, which mea-sures the strength of the linear relationship be-tween the two variables. The coefficient ranges between -1 and 1, where 1 corresponds to per-fect correlation between the two variables, -1 corresponds to perfect negative correlation, and 0 indicates there is no linear relationship. The strength of the correlation is determined by the magnitude of the coefficient. Adjective ratings of correlation strength follow the definitions de-veloped by Hopkins[20]and Cohen[22]:
• < 0.1 “Trivial”
• 0.1 to 0.3 “Minor”
• 0.3 to 0.5 “Moderate”
• 0.5 to 0.7 “Large”
• 0.7 to 0.9 “Very large”
• 0.9 to 1 “Almost perfect”
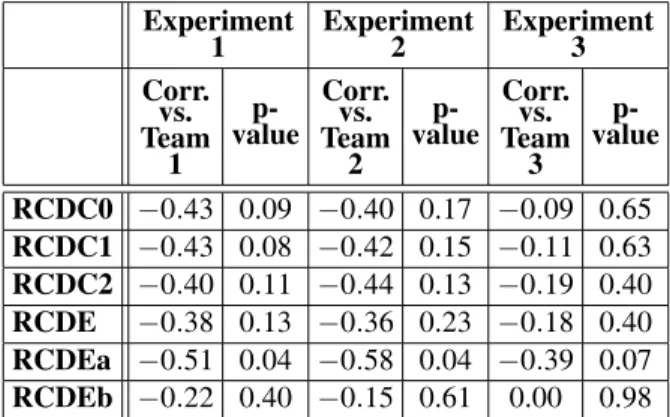
The quality of the correlation results was as-sessed by calculating the p-value for each cal-culation(the p-value corresponds to the proba-bility that the measured correlation could be due to purely random effects). Correlation results with p-values greater than 0.10 were rejected. Table 1 shows the results of correlating the met-rics results with the human-generated complex-ity ratings. The results for Experiment 1 show that RCDC0 and RCDC1 have moderate corre-lation with the expert ratings. RCDEa has large correlation in both Experiments 1 and 2, and moderate correlation in Experiment 3.
The results indicate that the RCDEa metric is a statistically valid measure of complexity for the entire test suite.
Experiment
1 Experiment2 Experiment3 Corr.
vs. Team
1 p-value
Corr. vs. Team
2 p-value
Corr. vs. Team
3 p-value
RCDC0 −0.43 0.09 −0.40 0.17 −0.09 0.65
RCDC1 −0.43 0.08 −0.42 0.15 −0.11 0.63
RCDC2 −0.40 0.11 −0.44 0.13 −0.19 0.40
RCDE −0.38 0.13 −0.36 0.23 −0.18 0.40
RCDEa −0.51 0.04 −0.58 0.04 −0.39 0.07
RCDEb −0.22 0.40 −0.15 0.61 0.00 0.98
It may be noted that there is good consistency between the ratings generated by the two teams with overlapping focus(Evaluation Teams 1 and 2); a correlation of the teams’ results gives a correlation coefficient of 0.83 (very large). To simplify the presentation, in the following parts of this paper , the results from these two teams are combined.
3.2. RCDC and RCDE vs. SSCLM
Following the validation effort, the performance of the RCDC and RCDE semantic metrics was compared with that of the SSCLM syntactic metric. The results are shown in Tables 2a and 2b.
For both the GUI and math packages, the re-sults show a “large”-to-“very large” correla-tion between the RCDEa and SSLCM metric and “moderate”-to-“large” correlation between SSLCM and both RCDC2 and RCDE. This is a key result, since the RCDC and RCDE met-rics can be applied in the design phase while SSCLM is a development-phase metric.
Experiment 1 &
2 Experiment 3
Corr. vs.
SSCLM valuep- Corr. vs.SSCLM value
p-RCDC0 0.60 0.01 0.30 0.17
RCDC1 0.57 0.02 0.28 0.20
RCDC2 0.58 0.01 0.45 0.03
RCDE 0.54 0.03 0.48 0.02
RCDEa 0.64 0.01 0.72 0.00
RCDEb 0.46 0.07 −0.12 0.61
Table 2.Correlation of Complexity metrics with SSLCM.
RCDEa – and to a lesser extent, RCDC2 and RCDE – can consequently be understood as early predictors of the complexity of a class. They provide a way to manage class complexity as a part of the design effort, when cost-effective changes can be implemented.
3.3. Complexity Metrics Compared to Each Other
In a third analysis, the results of each metric were correlated with the results of every other metric. The objective of this analysis was to
identify possible commonalities in the perfor-mance of the various metrics.
The results of the study are shown in Tables 3a and 3b. The results show almost perfect correla-tion between the three RCDC metrics(RCDC0, RCDC1, RCDC2). This is a surprising result since it indicates that the simple metric RCDC0 – a metric that merely sums complexity weight-ing factors – provides results that are consistent with the complex RCDC1 and RCDC2 metrics, which count concept and/or keyword linkages. If this is found to be borne out by large-scale studies focused on this specific issue, it may be possible to apply quite simple calculation tech-niques to the sophisticated semantic complexity metrics.
RCDC0 RCDC1 RCDC2 RCDE RCDEa
RCDC1 0.995
RCDC2 0.98 0.98
RCDE 0.80 0.79 0.81
RCDEa 0.83 0.82 0.85 0.85
RCDEb 0.40 0.41 0.42 0.63 0.31
Table 3a. Correlation of Complexity metrics with each other(Experiment 1 and 2).
RCDC0 RCDC1 RCDC2 RCDE RCDEa
RCDC1 0.995
RCDC2 0.97 0.97
RCDE 0.96 0.96 0.99
RCDEa 0.42 0.43 0.62 0.61
RCDEb 0.79 0.77 0.65 0.64 −0.10
Table 3b.Correlation of Complexity metrics with each other(Experiment 3).
3.4. Principal Component Analysis
A Principal Component Analysis (PCA) was
corre-lated, it is likely that they measure the same class properties. PCA is a standard technique that has the objective of grouping the data set into a smaller set of orthogonal groups. The groups are formed so that the members of a group have similar variance characteristics and, presumably, similar underlying measurement characteristics [21,22]. When using PCA, the larger the sample size the better. It has been rec-ommended that an acceptable sample size has ten times the number of observations as there are variables being analyzed[17]. The data set utilized in this research exceeded the suggested ten times number and therefore the results of the principle component analysis are regarded as valid.
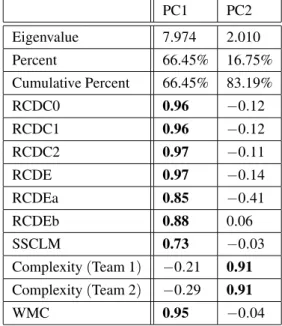
Table 4a shows the PCA results for Experi-ments 1 and 2. Principal Component 1 (PC1), the members of which are indicated by bold numbers in the PC1 column, includes all of the RCDC and RCDE metrics. This is consistent with the results of the Experiment 3 PCA(Table 4b), for which those metrics, with the exception of RCDEa, were also grouped.
PCA is a tool that suggests similar underlying measurement characteristics, but does not by itself yield conclusive results. For definitive re-sults, further statistical analysis to validate the groupings is required. However the results of Principal Components analysis do provide use-ful indicators of commonalities between metrics and help define further analysis.
PC1 PC2
Eigenvalue 7.974 2.010 Percent 66.45% 16.75% Cumulative Percent 66.45% 83.19%
RCDC0 0.96 −0.12
RCDC1 0.96 −0.12
RCDC2 0.97 −0.11
RCDE 0.97 −0.14
RCDEa 0.85 −0.41
RCDEb 0.88 0.06
SSCLM 0.73 −0.03
Complexity(Team 1) −0.21 0.91
Complexity(Team 2) −0.29 0.91
WMC 0.95 −0.04
Table 4a.Results of Principal Component Analysis
(Experiments 1 & 2).
PC1 PC2 Eigenvalue 5.3167 2.2788 Percent 53.17% 22.79% Cumulative Percent 53.17% 75.96% RCDC0 0.99 −0.13 RCDC1 0.99 −0.13 RCDC2 0.93 −0.36
RCDE 0.92 −0.38
RCDEa 0.30 −0.41
RCDEb 0.86 0.35
Complexity(Team 3) 0.02 0.53
WMC 0.15 −0.04
SSCLM 0.18 −0.81
Table 4b.Results of Principal Component Analysis
(Experiment 3).
In this study, the Principal Components Anal-ysis results lend support to the view that the RCDC and RCDE metrics have commonalities in their underlying measurement characteris-tics. This result, if borne out in detailed stud-ies, would be significant because of the large variance in the complexity of the various met-rics; finding that the simpler metrics measure the same or similar features as the more com-plex ones could greatly simplify the comcom-plexity estimation process.
4. Conclusions and Further Work
The validation results show that three of the metrics produce statistically valid complexity ratings, correlating with expert ratings at the “large” and “moderate” levels. The remaining metrics correlate to a lesser degree, but none were found to correlate poorly. Data are not sufficient to determine with certainty that all of the metrics would correlate well with the expert data. However, since there is a very high degree of correlation among the entire set of metrics, it is to be expected that all of the metrics correlate well. In future work, the authors will expand the number of classes for which human ratings are available, allowing a more comprehensive validation.
important result, since the RCDC and RCDE metrics can be applied earlier in the software development process than SSCLM. The results indicate that the semantic metrics can be used as predictors of class complexity from design information alone, facilitating early correction of poor class design practices.
Another important finding is that the three
RCDC-based metrics (RCDC0, RCDC1, and
RCDC2) are almost perfectly correlated, de-spite considerable conceptual differences in the way they are calculated. In future work, the authors will conduct detailed investigations of this apparent similarity between the three met-rics. If consistent results are found, it may be practical to compact the set of RCDC metrics. Unlike the RCDC metrics, it was found that the entropy-based RCDE metrics yield consid-erably different results among themselves. The indication is that concepts may be slightly un-derweighted in RCDE relative to keywords and that gaining a comprehensive understanding of the characteristics requires generating RCDEb in addition to one of the other RCDE metrics.
5. Acknowledgement
The research in this paper was partially sup-ported by NASA grants NAG5-12725 and NCC8-200.
References
[1] S. CHIDAMBER, C. KEMERER, Towards a metrics
suite for object-oriented design.Proceedings of the Conference on Object-Oriented Programming: Systems, Languages and Applications, (1991), pp. 197–211.
[2] T. MCCABE, C. BUTLER, Design complexity
mea-surement and testing. Communications of the As-sociation for Computing Machinery (ACM), 32
(1989), 12, pp. 1415–1425.
[3] L. H. ETZKORN, S. GHOLSTON, W. HUGHES, A
se-mantic entropy metric.Journal of Software Main-tenance and Evolution: Research and Practice, 14
(2002), pp. 1–18.
[4] R. PRESSMAN, Software engineering: a
prac-titioner’s approach (6th ed), McGraw-Hill(2005), New York.
[5] L. H. ETZKORN, H. DELUGACH, Towards a semantic
metrics suite for object-oriented design. Proceed-ings of the 34th International Conference on Tech-nology of Object-Oriented Languages and Systems (TOOLS USA 34), Institute of Electrical and Elec-tronics Engineers(IEEE)Computer Society Press,
(2000), pp. 71–80.
[6] M. SPENKE, C. BEILKIN, An overview of GINA a` the generic interactive application.Proceedings of the Workshop on User Interface Management Systems and Environments on User Interface Management and Design,(1993), pp. 273–293.
[7] J. SMART, wxWindows, Retrieved 2005 from
http://www.wxwindows.org/.
[8] R. DAVIES,Newmat C++ Matrix Library, (2006),
(pp. 17), Wellington, New Zealand,
http://www.robertnz.net/ol doc.htm/, [retrieved 23 April 2006].
[9] L. H. ETZKORN, C. DAVIS, Automatically
identify-ing reusable components in object-oriented legacy code.Institute of Electrical and Electronics Engi-neers (IEEE) Computer, 30(1997), 10, pp. 66–71.
[10] L. H. ETZKORN, J. BANSIYA, C. DAVIS, Design and
complexity metrics for OO classes. Journal of Object-Oriented Programming, 12(1999), 1, pp. 35–40.
[11] L. H. ETZKORN, A Metrics-Based Approach to the Automated Identification of Object-Oriented Reusable Software Components. Doctoral Disser-tation, The University of Alabama in Huntsville,
(1997).
[12] J. SOWA,Conceptual Structures: Information Pro-cessing in Mind and Machine. Addison-Wesley, Reading, Massachusetts,(1984).
[13] C. STEIN, Semantic Metrics for Source Code and
Design. Doctoral Dissertation, The University of Alabama in Huntsville,(2004).
[14] C. STEIN, L. H. ETZKORN, G. W. COX, P. FARRING -TON, S. GHOLSTON, D. UTLEY, J. FORTUNE, Pro-ceedings of the 1st International Workshop on Soft-ware Audit and Metrics, Porto, Portugal, (2004), pp. 49–58.
[15] B. KITCHENHAM, S. PLEEGER, N. FENTON, Towards
a Framework for Software Measurement Valida-tion.IEEE Transactions on Software Engineering, 21(1995), 12, pp. 929–944.
[16] L. BRIAND, S. MORASCA, V. BASILI, Property-based
software engineering measurement.IEEE Transac-tions on Software Engineering, 22(1996), 1, pp. 68–86.
[17] KABAILI, R. KELLER, F. LUSTMAN, G. SAINT-DENIS, Class cohesion revisited: an empirical study on in-dustrial systems. Fifth European Conference on Software Maintenance and Reengineering,(2001), pp. 39–47.
[18] A. MITCHELL, J. POWER, An empirical
[19] W. LI, S. HENRY, Object-oriented metrics that
pre-dict maintainability. Journal of Systems and Soft-ware, 23(1993), 2, pp. 111–122.
[20] W. HOPKINS, A new view of statistics.SportScience: Dunedin, New Zealand. Retrieved 2005 from
www.sportsci.org/resource/stats//. [21] J. COHEN,Statistical power analysis for the
behav-ioral sciences (2nd ed). Lawrence Erlbaum Publish-ing, Mahwah, New Jersey,(1988).
[22] W. DILLON, M. GOLDSTEIN,Multivariate analysis:
methods and applications. John Wiley and Sons, New York,(1984).
Received:January, 2006
Revised:November, 2006
Accepted:December, 2006
Contact addresses:
Glenn Cox Department of Computer Science University of Alabama in Huntsville Huntsville, Alabama, USA e-mail:[email protected]
Sampson Gholston Industrial and Systems Engineering Management Department University of Alabama in Huntsville Huntsville, Alabama, USA
Dawn R. Utley Industrial and Systems Engineering Management Department University of Alabama in Huntsville Huntsville, Alabama, USA
Letha H. Etzkorn Department of Computer Science University of Alabama in Huntsville Huntsville, Alabama, USA
Cara Stein Gall Department of Computer Science Edinboro University of Pennsylvania Edinboro, Pennsylvania, USA
Phillip A. Farrington Industrial and Systems Engineering Management Department University of Alabama in Huntsville Huntsville, Alabama, USA
Julie Fortune Industrial and Systems Engineering Management Department University of Alabama in Huntsville Huntsville, Alabama, USA
DR. GLENNCOXis an Associate Professor in the Computer Science De-partment of the University of Alabama in Huntsville. He holds Ph.D., Masters, and Bachelors degrees in Electrical Engineering from Auburn University. He has published more than 40 conference and journal pa-pers in the areas of software metrics, computer networking, modeling and simulation, and integrated circuit design. He worked for 22 years in industry prior to his academic career.
DR. SAMPSONGHOLSTONis an Associate Professor at the University of Alabama in Huntsville. He has a Ph.D. degree from the University of Alabama in Huntsville in Industrial and Systems Engineering and a Masters degree from the University of Alabama in Industrial Engi-neering. He has also worked for the Saturn Corporation as a Supplier Quality Engineer. His research interests include quality engineering, quality management, and applied statistics.
DR. DAWNR. UTLEY, PH.D., P.E. is an Associate Professor at the Uni-versity of Alabama in Huntsville, teaches and conducts research in the area of engineering management. Dr. Utley has worked in the specific area of quality measures for 15 years. She has a Ph.D. in Industrial and Systems Engineering(Engineering Management)from UAH, an M.S. degree in Industrial Engineering(Engineering Management)from the University of Tennessee, and a B.S. in Civil Engineering from Ten-nessee Technological University. She worked for six years for TVA as a structural civil engineer prior to her academic career.
DR. LETHAH. ETZKORNis an Associate Professor in the Computer Science department at the University of Alabama in Huntsville. She has published more than 60 papers in refereed journals and confer-ences. She teaches in several areas, including software engineering, client/server systems, and networking. Her primary research interests are in software engineering(primarily software metrics and program comprehension), and mobile and intelligent agents.
DR. CARASTEINGALLis an Assistant Professor in the Math and
Com-puter Science Department at Edinboro University of Pennsylvania. She received her Ph.D. in Computer Science from the University of Alabama in Huntsville. She teaches Programming, Computer Architecture, and Computer Literacy. Her research interests are in software metrics.
DR. PHILLIPA. FARRINGTONis an Associate Professor in the Depart-ment of Industrial and Systems Engineering and Engineering Manage-ment at the University of Alabama in Huntsville. He holds B.S. and M.S. degrees in Industrial Engineering from the University of Missouri-Columbia and a Ph.D. in Industrial Engineering and Management from Oklahoma State University. His research interests include collaborative systems engineering, integrated product development, quality engineer-ing, and rapid simulation model development.
![Figure 1 [11]. Among other functions, CHRiS is the module that understands program com-ments](https://thumb-us.123doks.com/thumbv2/123dok_us/8043835.2129959/3.892.100.436.320.753/figure-functions-chris-module-understands-program-com-ments.webp)