ABSTRACT
The rheological properties of four different Kuwaiti crude oils in the presence of polyacrylamide (PAA) were investigated. PAA was varied at three different concentrations of 25, 50, and 75 ppm to study the viscoelastic properties in the untreated samples. Four different temperatures (25, 30, 35, and 40 °C) were used to evaluate different viscoelastic parameters of the treated and untreated Kuwaiti crude oils. The sulfur content and physical properties; such as, density and refractive index of Kuwaiti crude oils were also measured.
An important observation noted from the rheological analysis is that the dynamic viscoelastic parameters like complex modulus, elastic modulus, and storage modulus were found to be a function of the amount of sulfur present in the crude oil. The most important observation noted is that PAA acts as a drag reducing agent in lowering the viscosity, shear stress, and all the viscoelastic parameters of the Kuwaiti crude oil. Carreau model was used in this investigation to determine the relaxation time and the shear thinning characteristics of the treated and untreated crude oil samples at different temperatures.
Keywords: Crude oil, Rheology, Polyacrylamide, Elemental Analysis, Complex Modulus, Storage Modulus Bader H. Albusairi* and Adam Al-Mulla
Department of Chemical Engineering, Kuwait University, Kuwait
A Study of Flow Properties of Kuwaiti Crude Oil Obtained from Different
Sources
*Corresponding author
Bader H. Albusairi
Email: [email protected]
Tel:+96 59 9255676 Fax:+96 59 9255676
Article history
Received: October 28, 2015
Received in revised form: March 15, 2016 Accepted: April 04, 2016
Available online: February 20, 2017
INTRODUCTION
N-paraffins and asphaltenes form the main constituents of crude oil. They are a cause of crystallite formation when a temperature drop in crude oil occurs [1, 2]. International energy sources indicate that around 52% of the international heavy crude oil are recoverable, but it is not economically feasible for processing due to its high viscosity, causing refining and transportation problems. The heavy crude oil possesses many technological problems related to production, refining, and transportation, but the need for energy outweighs
these issues which are inherently flow related. Thus there is a need to probe for innovative and amicable solutions which are mainly related to the production, refining, and transportation of the high viscosity crude oil. For a smooth flow in a pipeline, the viscosity of crude oil should be lower than 400 MPa, but the viscosity of the heavy crude oil is normally greater than 105 MPa. This is due to the complex nature of
cobalt existing in the heavy crude oil [4]. The amount of carbon in the paraffinic wax ranges between C18-C70 and it mainly consists of saturates and the asphaltene. The asphaltene composition consists of polycyclic aromatic hydrocarbons [5]. Petroleum crude from varying wells and sources have properties which are different [6]. The heavy crude oil having very high viscosity values [7] has large amounts of asphaltenes and low molecular weight hydrocarbons [8- 10]. Wax precipitation in crude oil is a thermodynamic process. As low temperatures are encountered by the oil, the wax precipitates, and these waxes show shear thinning. The wax built up at the interphase between the borewell and the reservoir can cause skin effect, leading to increased roughness and a pressure drop in pipelines which are carrying crude oil. The build-up of wax can cause malfunctioning and plugging of equipment during the transportation of crude oil. Various methods are employed to reduce the viscosity of crude oils, the various methods include forming oil in water emulsions [11] and preheating the crude oils or adding light oil fractions to reduce the viscosity to facilitate pumping [12]. Additive help changes the wax crystal structure or act as a dispersant to enhance the flow properties of crude oil at temperatures below 20°C [13]. However, the drawbacks of the emulsion method is that it involves huge capital costs in terms of using costly surfactants to stabilize the oil in water emulsion during transportation and also separation of crude oil from water once the destination is reached. Also, huge capital costs which are involved in heating pipelines include covering large distances and altering the chemical composition of the original crude oil by heating or adding external substances
Knowing the rheology of crude oil is important for reducing the cost involved in transportation. The
rheological study would help know the viscosity of crude oil during its production, transportation from reservoir to gathering centers, and transportation from the gathering centers to refineries or crude oil filling stations. A limited number of research papers exist on the study of rheological property of crude oil, containing large amounts of maltenes [10]. The size distribution of isoparaffinic waxes, asphaltenes, and maltenes determines the role of temperature and rheology in the flow properties of crude oil (14]. The rheological properties are affected by the shear conditions, the temperature conditions, and the external dilution of parent crude oil using mineral oils [15]. Rasha et al. [16] has also observed that incorporation of copolymers of maleic anhydride and octadecane have altered the flow characteristics of heavy crude oil. Yang et al. [17] have used copolymers of lauric amine and dodecylbenzenesulfonic acid to alter the crystal structure of waxes, which could change the rheological characteristics of crude oil. Different types of flow improvers have been reported in the literature. The most commonly used approaches are comb-shaped copolymers and linear polymers; such as, ethylene-butylene [11, 12] and ethylene vinyl acetate [8-10] copolymers. These polymers interact with wax crystallization, breaking their crystal structures and decreasing the viscosity of crude oils. The main objective of this work was to study the amount of sulfur presented in different Kuwaiti crude oils obtained from different locations, and relate the sulfur content to rheology. Another important objective was to evaluate the effect of drag reducing agent on its rheological properties.
Methodology
oils have been used for studying the effect of a drag reducing polymer on its rheological properties at four different temperatures. The samples have been obtained from different wells which are located approximately 10 km away from each other. The samples were analyzed for its sulfur content using Antek by PAC instrumentation (Multitek), density using density meter and refractive index using Mettler Toledo RM40/RM50 refractometer at 25°C.
Emulsion Preparation
Polyacrylamide (PAA), a synthetic polymer was used as the surfactant in the present study. PAA was dissolved in 100 mL of crude oil by vigorously stirring it for a period of 15 minutes at room temperature, and this solution was further subjected to high speed shearing at 3000 rpm using a Silverson SL-2 machine for a time period of 15 minutes. Three different concentrations (25, 50, and 75 ppm) of PAA were used in the drag reducing analysis. 50 ppm was chosen as the optimum concentration after carrying out viscosity measurements.
Rheological Analysis
Gemini 200 rheometer supplied by Bohlin Instrument Co., UK using CP 180 cylinder peltier was used for measuring the rheology of fluids. The rheological measurements were carried out at 25, 30, 35, and 40°C. The temperatures in the rheometer system were controlled using a Julabo F 25 water bath. A linear viscoelastic region was obtained by plotting storage modulus (G’) as a function of stress; moreover, the linear viscoelastic region was found to be in the range of 0.01-0.75 Pa. The stress value was kept constant at 0.5 Pa, and it was obtained from the linear region, and it was kept constant for further rheological studies carried out in the oscillation test mode. The
uniform frictionless transmission of applied stress to the crude oil was controlled by an air bearing mounted in the middle of the shaft. A digital encoder was used to process the deformations occurring in the crude oil at 106 impulses per revolution. These impulses help to measure the minute strains or shear rates or small yield stress values. The gap which was kept between the spindle and the cylinder peltier was 0.15 mm; also, the cone angle was 4°. The samples were brought to equilibrium at the experimental temperature before the test. A set of three experiments was conducted for each run to obtain reproducibility, and the estimated error between each run was approximately 3%. In the viscometry experiments, a cutoff point of 100 s-1 for
the shear rate values was chosen due to inconsistent trend observed in the viscosity and shear stress values. Similarly a cutoff point of 0.7 s-1 was kept in
the frequency values in the oscillatory mode because an inconsistent trend was noted for complex modulus (G*), storage modulus (G’), and loss modulus (G”).
RESULTS AND DISCUSSION
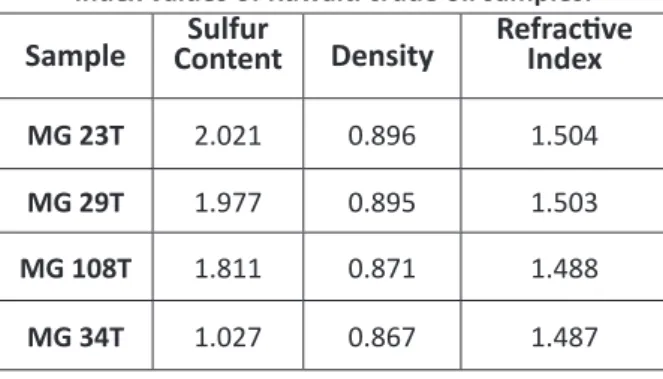
Four different Kuwaiti crude oils were characterized for sulfur content, density, and refractive index, and the values are indicated in Table 1.
Table 1: The sulfur content, density, and the refractive index values of Kuwaiti crude oil samples. Sample ContentSulfur Density Refractive Index
MG 23T 2.021 0.896 1.504
MG 29T 1.977 0.895 1.503
MG 108T 1.811 0.871 1.488
Figure 1: Plot comparing the viscosity versus shear rate for MG 23T at four different temperatures.
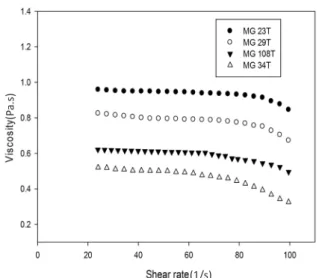
Figure 2 depicts the variation of viscosity with the shear rate for four different Kuwaiti crude oils at 30°C. It is seen that the crude oil MG 23T has the highest amount of sulfur (Table 1) and the crude oil MG 23T exhibits the maximum viscosity. The viscosity values are found to decrease as the percentage of sulfur decreases. All the crude oil samples show a non-Newtonian behavior.
Figure 2: Comparing viscosity versus shear rate for four different Kuwaiti crude oils at 30°C.
Figure 3 depicts a plot of viscosity versus a shear rate for a typical sample MG 108T which is treated with PAA of three different concentrations of 30, 50, and 75 ppm. The addition of 75% of DRA polymer decreases the viscosity by 15%, while the difference noted between 50 and 75 ppm was hardly 2%. This is a clear observation that the addition of PAA leads to a decrease in viscosity. Therefore, the concentration of 50 ppm was chosen as the optimum concentration of PAA for all the further studies.
Figure 3: Variation of polyacrylamide (PAA) concentrations 30, 50, and 75 ppm at 30°C for MG 108T.
Variation of viscosity with a shear rate for a typical Kuwaiti crude oil (MG 23T) at four different temperatures are displayed in Figure 1. The majority of the crude oils show a Newtonian behavior. The flow becomes complex and non-Newtonian due to wax precipitation at lower temperatures [18]. As seen in Figure 1, the viscosity values are found to decrease with a rise in the temperature, showing a drop by 30% in viscosity between the lowest and highest temperature. This indicates a strong dependence of temperature on viscosity for all the different types of crude oil. This behavior is due to the structure breakdown of complex asphaltenes and maltenes in the presence of temperature. The viscosity values are also found to be high at low shear rates because at low shear rates, more time is provided to break the complex chemical structures of the crude oil sample at the corresponding temperature.
(P
a.s)
(1/s)
(P
a.s)
(1/s)
(1/s)
(P
Figure 4 shows the comparison which is made on the study of variation of viscosity versus the shear rate for untreated and PAA-treated MG 34T crude oil sample at 30°C. From this figure, it is noted that untreated crude oil has higher viscosity than the treated crude oil sample possibly due to the breakdown of chemical complex structures by PAA in the crude oil sample.
Figure 4: Comparison of viscosity versus shear rate for the untreated and treated MG 34T sample (50ppm) at 30°C. Figure 5 indicates the plot of viscosity versus the shear rate at 40°C for four different crude oils containing 50 ppm PAA. It is clear from Figure 5 that a decrease in the crude oil viscosity occurs when the amount of sulfur content in the oil (Table 1) decreases.
Figure 5: Comparison of viscosity versus shear rate for four different crude oils containing PAA at 40 °C and 50 ppm.
Figure 6 shows the variation of the shear stress as a function of the shear rate for four different untreated crude oils at 30°C. The shear stress behavior is found to be dependent on the amount of sulfur which presents in the crude oil. High shear stress values are noted for the crude oil which is containing the maximum amount of sulfur.
Figure 6: Comparison of shear stress versus the shear rate at 30°C for four different untreated crude oils.
Figure 7: Comparison of shear stress versus shear rate of MG 34T untreated and treated (50 ppm) at 30°C. (1/s)
(P
a.s)
(1/s)
(P
a.s)
(P
a)
(1/s)
Figure 7 is comparing the change in shear stress versus the shear rate for the untreated and treated MG 34T at 30°C. It is obvious that the untreated crude oil sample has higher shear stress compared to the treated sample and PAA is found to decrease the shear stress of the crude oil sample.
(1/s)
(P
The values of yield stress for the neat crude oil is 5.2 Pa, while that of the PAA treated sample is 4.1 Pa, indicating that the breakdown of the complex wax structure has occurred. Figure 8 compares the shear stress as a function of shear rate for different crude oils containing 50 ppm PAA at 40°C. This figure clearly indicates that shear stress values are higher for crude oil containing the maximum amount of sulfur in a system containing 50 ppm PAA. Systems (Figures 6 to 8) which contain microstructure domains display thixotropic phenomenon which implies the extent of micro-structural changes occurring from the initial state to the final state and reverting back to the initial state due to the application of predefined stress. The micro-structural changes under the influence of stress and time determine the viscosity or shear stress of the sample at the relevant shear rate. Thixotropic hysteresis curve was unnoticeable for treated and untreated crude oil possibly due to the fact that large microstructures under the influence of progressively increasing shear rate break down into small flocks and immediately convert back into the parent structures in a very short time interval. The dynamic behavior (varied oscillating stress or strain) of the treated and the untreated samples determines its viscoelastic nature. The total resistance of a material under a given strain represents the complex modulus of a material.
Figure 8: Comparison of shear stress versus shear rate for four different crude oils containing 50 ppm PAA at 40°C.
A dynamic test is important to determine the linear viscoelastic (LV) properties of the crude oil under varying temperatures and varying concentrations of PAA. When the analysis of the crude oil is carried out in the LV region, the chemical nature of the crude oil remains unchanged with the application of stress. The only parameter which can change the flow property in the LV region is temperature. In stress-sweep experiments, the LV region corresponds to complex modulus (G*) which denotes whether the chemical structure of the sample is broken or is left intact. The stress value was kept constant at 0.5 Pa, which is in the linear viscoelastic range (0.01-0.75) of the sample, where G* would show a constant response.
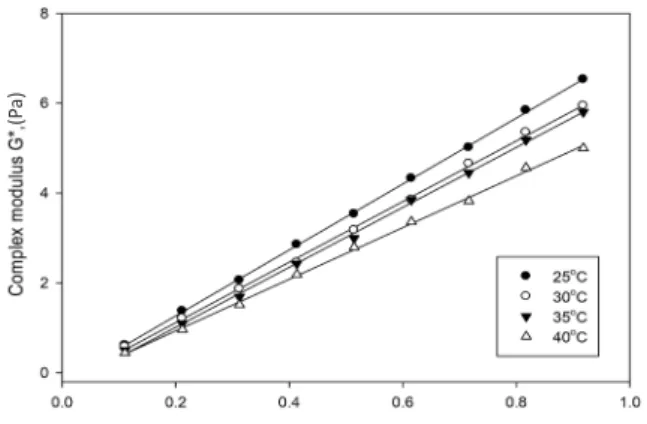
Figure 9 depicts the variations of complex modulus versus frequency (ω) for the untreated crude oil (MG 29T) at different temperatures. Figure 9 shows that the complex modulus is strongly dependent on temperature, and it decreases with an increase in temperature. This observation implies that resistance is a function of strain and decreases by raising temperature.
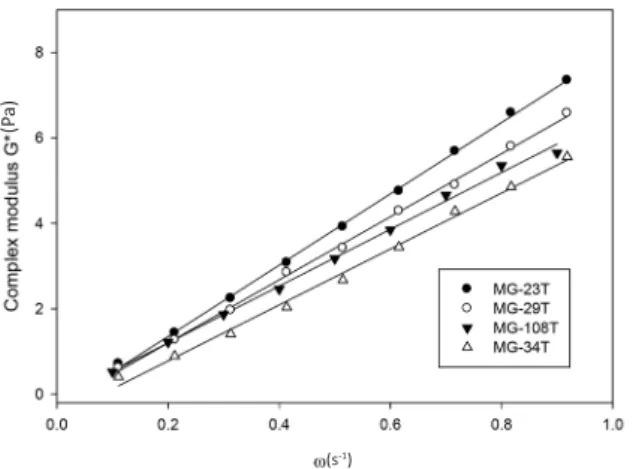
Figure 9: Complex modulus as a function of frequency for untreated crude oil MG 29T at different temperatures. Figure 10 shows complex modulus versus frequency for different untreated Kuwaiti crude oils at 30°C. The complex modulus is found to increase linearly with increasing frequency. As noted from the previous
(P
a)
(1/s)
(P
a)
graphs, the samples with the maximum amount of sulfur content show the maximum value of complex modulus. At high frequencies, the complex modulus values increase as the sulfur content rises.
Figure 10: Comparison of complex modulus versus frequency at 30°C for four different untreated Kuwaiti crude oils.
Figure 11 displays complex modulus versus frequency for untreated and treated MG 34T at 30°C. This figure indicates that the addition of PAA decreases the complex modulus, which implies that less resistance is offered by the treated sample compared to the untreated sample.
Figure 11: Comparison of complex modulus versus frequency for MG 34T untreated and treated (50 ppm) at 30°C.
Plotting storage modulus (G’) versus frequency (Figure 12) shows that the high G’ values are noted for untreated MG23T sample containing high sulfur content. A conclusion that can be obtained from this plot is that crude oil with high sulfur content has a high amount of energy per unit cycle stored in it, and it decreases with decreasing sulfur content at high frequencies.
Figure 12: Storage modulus versus frequency at 30°C for four different untreated Kuwaiti crude oils.
Figure 13 indicates that low G’ values are noted for PAA treated crude oil compared to untreated crude oil implying that energy stored per unit cycle in the material decreases with the addition of PAA.
Figure 13: Storage modulus versus frequency for MG 29T for untreated and treated crude oil at 50 ppm and 30°C.
(s-1)
(P
a)
(s-1)
(P
a)
(s-1)
(P
a)
(P
a)
Figure 14 depicts loss modulus (G”) versus frequency; moreover, according to this figure, the amount of energy lost per unit cycle in the untreated samples containing high amount of sulfur is higher. The loss modulus values show linear relationships over the entire range of frequencies
Figure 14: Loss modulus versus frequency at 30°C for four different untreated Kuwaiti crude oils.
Figure 15 compares the loss modulus values for treated (50 ppm) and untreated samples at 30°C. The plot indicates that the energy loss per unit cycle of the treated sample is lower than that of the untreated sample over the complete frequency range.
Figure 15: Loss modulus versus frequency for untreated and treated (50 ppm) crude oil at 30°C.
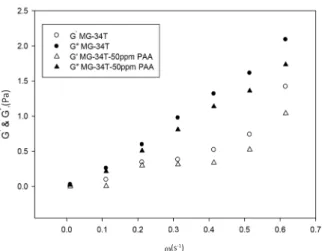
The G’ and G” are constant terms in the LV region of the crude oil. It is affected by varying sinusoidal stresses. The effect of frequency in the crude oil sample can be determined by subjecting the sample to a frequency scan. G’ and G” are dependent on frequency. The waxy viscous nature of crude oil (G”) is found to be greater the G’ (Figure 16). As seen in Figures 14 and 15, G” shows a linear relationship, while G‘s do not show linearity over the entire frequency range. It is also noted that the G” values are higher for treated and untreated samples compared to the storage modulus values, which indirectly implies that the amount of energy stored in the crude oil per unit cycle is lower than the amount of energy lost as heat per unit cycle; this causes the crude oil samples to depict the solid characteristics lower than their viscous nature over the entire frequency range.
Figure 16: Comparison of G’ and G” versus frequency for untreated and treated (50 ppm) MG 34T at 25°C.
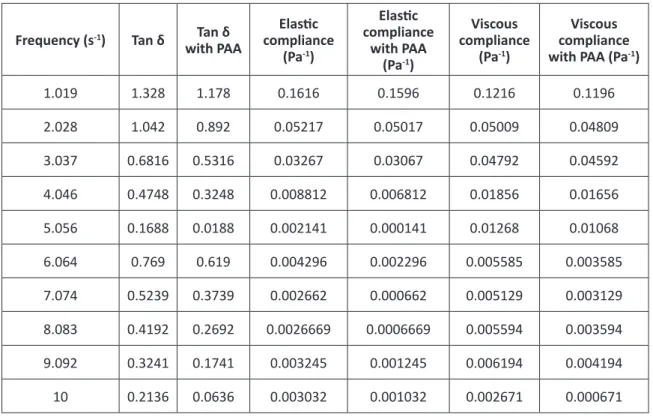
The loss tangent is the ratio of G” (energy dissipation stress) and G’ (energy preserving stress), which defines the viscous and the elastic components of the material respectively. The loss tangent data at different frequencies are indicated in Table 2. Table 2 shows
(s-1)
(P
a)
(s-1)
(P
a) (s-1)
(P
high tan δ values at low frequencies and the value decreases with increasing frequencies. High tan δ values indicate an ability to dissipate deformation energy and relax stresses which would possibly lead to breaking of wax crystals.
The energy stored and recovered per cycle which corresponds to the elastic compliance is found to decrease by reducing time (Table 2). With the addition of PAA to the crude oil, the elastic compliance values are found to decrease further as a function of time,
indicating that the elastic properties of the crude oil has decreased due to the disruption of the wax structure. The amount of heat or energy which is given out as the quantity of heat per sinusoidal cycle is found to be less on the addition of PAA to the crude oil. This is a clear indication that the wax present in crude oil after the addition of PAA does not have a large complex structure similar to the crude oil, and thus the amount of heat dissipated is less compared to the neat crude oil.
Table 2: Tan δ and compliance values for the treated and untreated crude oil samples at 25°C.
Frequency (s-1) Tan δ Tan δ
with PAA
Elastic compliance
(Pa-1)
Elastic compliance
with PAA (Pa-1)
Viscous compliance
(Pa-1)
Viscous compliance with PAA (Pa-1)
1.019 1.328 1.178 0.1616 0.1596 0.1216 0.1196
2.028 1.042 0.892 0.05217 0.05017 0.05009 0.04809
3.037 0.6816 0.5316 0.03267 0.03067 0.04792 0.04592
4.046 0.4748 0.3248 0.008812 0.006812 0.01856 0.01656
5.056 0.1688 0.0188 0.002141 0.000141 0.01268 0.01068
6.064 0.769 0.619 0.004296 0.002296 0.005585 0.003585
7.074 0.5239 0.3739 0.002662 0.000662 0.005129 0.003129
8.083 0.4192 0.2692 0.0026669 0.0006669 0.005594 0.003594
9.092 0.3241 0.1741 0.003245 0.001245 0.006194 0.004194
10 0.2136 0.0636 0.003032 0.001032 0.002671 0.000671
Table 3: Carreau model constants and coefficient of determination (r2).
Temperature (°C) 25 30 35 40
λ 0.11237893 0.12034426 0.12073778 0.12981699
N 0.17212747 0.1811687 0.18215563 0.19354373
The shear thinning characteristics (N) and the relaxation time (λ) for the Kuwaiti crude oil was estimated (Table 3) using the Carreau model, which is applicable to both Newtonian and non-Newtonian fluids and is given by the following equation:
(1) where, η corresponds to viscosity; γ corresponds to shear rate; η0 is the zero shear viscosity at zero shear rate, and λ and Ν represent the characteristics of the fluid.
The built in solver function in Microsoft Excel 2013 was used to determine the values of λ, Ν, and the coefficient of determination (r2) for the fit between the experimental viscosity values and those predicted theoretically using Equation 1.
It is noted that the relaxation time (λ) and the shear thinning constant (N) increase as the temperature rises. Thus a longer relaxation time is needed for the molecular aggregation of the sheared complex substances in the crude oil to reach equilibrium at the temperature in this investigation. The r2 values are found to be above 0.99 indicating a good fit between the theoretically and experimentally predicted values.
CONCLUSIONS
The present work was performed to evaluate the rheological characteristics of PAA treated Kuwaiti crude oils. The following conclusions are drawn:
1. Non-Newtonian (shear thinning characteristics) behavior is exhibited by the treated and untreated crude oil. With increasing the shear rate and temperature, a decrease in the viscosity of crude oil was observed.
2. The addition of three different concentrations of PAA (25, 50, and 75 ppm) showed that the concentration of 50 ppm PAA is the optimum
concentration for decreasing the viscoelastic properties of untreated Kuwaiti crude oils. 3. Plots of viscosity versus the shear rate at varying
temperatures indicated that the viscosity values decreased with a decrease in the percentage of sulfur. All the crude oil samples showed a non-Newtonian behavior.
4. Thixotropic behavior was unnoticeable for the treated and untreated crude oil samples because the time required for breakdown and re-flocculation was minimal.
5. With increasing temperature, the complex modulus of the crude oil was found to decrease because the total resistance to flow decreased with a rise in temperature.
6. It is noticed that tan δ values are high at low frequencies and these values decrease by the addition of PAA to the sample, indicating that the wax crystals have a non-cross-linked structure compared to the neat crude oil.
7. The lower elastic compliance values of PAA with respect to the neat crude oil indicate the disruption of wax crystal structure.
8. The loss of energy as heat per cycle with the addition of PAA was found to be lower than that of neat crude oil due to the breakdown of complex structures in wax in the presence of PAA.
9. Carreau model was used to determine the relaxation time (λ) and the shear thinning constant (N) at different temperatures. It was found that these constants were temperature dependent in the case of both treated and untreated samples.
ACKNOWLEDGEMENTS
funds from project RE 01/13. The authors would like to acknowledge Johnson Mathew, Joyson John, and Bader Masier for the technical support provided during the course of this work. The authors would also like to acknowledge the PRP center GE 03/08 for analyzing the crude oil samples.
NOMENCLATURE
PAA : Polyacrylamide G’ : Elastic modulus (Pa) G” : Loss modulus (Pa) G* : Complex modulus (Pa) DRA : Drag reducing agent LV : Linear viscoelastic Ω : Frequency (s-1)δ : Phase angle (Tan δ= G”/G’) η : Viscosity (Pas)
η0 : Zero shear viscosity λ : Relaxation time (s) γ : Shear rate (1/s)
N : Shear thinning constant r2 : Coefficient of determination
REFERENCES
1. Herh P. K., Mai B. C., Roye N., and Hedmann K., “Rheology of Crude Oil at High Pressure,” Am. Lab., 2003, 9, 28-30.
2. Asma E., “Microbial Treatment of Waxy Crude Oil for Migration of Wax Precipitation,” Journal
of Petroleum Science & Engineering, 2007, 55,
111-121.
3. Johnsen E. E. and Ronningsen H. P., “Viscosity of Live Water-in-Crude-Oil Emulsions: Experimental Work and Validation of Correlations,” Journal
of Petroleum Science & Engineering, 2003, 38,
23–36.
4. Sjoblom J., Aske N., Auflem I. H., Brandal, O., and et al., “Our Current Understanding of Water in Crude Oil Emulsions, Recent Characterization Techniques and High Pressure Performance,”
Journal of Colloid Interface Science, 2002,
100-102, 399-473.
5. Groffe D., Takhar S., Anderson S. I., Stenby E. H., et al., “A Waxy Inhibition Solution to Problematic Fields: A Chemical Remediation Process,”
Petroleum Science & Technology, 2001, 19,
205-217.
6. Yaghi B. M., and Al-Bemani A., “Heavy Crude Oil Viscosity Reduction for Pipeline Transportation,”
Ener. Sources, 2002, 24, 93-102.
7. Centeno G., Sanchez-Reyna G., Ancheyta J., Munoz J., et al., “Testing Various Mixing Rules for Calculation of Viscosity of Petroleum Blends,”
Fuel, 2011, 90, 3561–3570.
8. Castro L. V. and Vazquez F., “Fractionation and Characterization of Mexican Crude Oils,” Energy and Fuel, 2009, 23, 1603–1609.
9. Murillo-Hernandez J., Garcia-Cruz I., Lopez-Ramirez S., Duran-Valencia C. et al., ”Aggregation Behavior of Heavy Crude Oil-Ionic Liquid Solutions by Fluorescence Spectroscopy,” Energy and Fuel, 2009, 23, 4584–4592.
10. Evdokimov I. N., Eliseev N. Y., and Eliseev D. Y., “Rheological Evidence of Structural Phase Transitions in Asphaltene-containing Petroleum Fluids,” Journal of Petroleum Science &
Engineering, 2001, 30, 199–211.
11. Pal R. and Rhodes E., “Viscosity/Concentration Relationships for Emulsions,” J. Rheol., 1989, 33, 1021–1045.
12. Ghannam M. T. and Esmail N., “Flow Enhancement of Medium-Viscosity Crude Oil,”
J. Pet. Sci. Technol., 2006, 24, 985-999.
13. Feustel M., Oshmann H. J., and Kentsche U., “Additives Based on Component Present in Petroleum for Improving the Cold Flow Properties of Crude and Distillate Oils,” 2004, U.S. Patent No. 4728412.
14. Banerjee S., Kumar R., Mandal A., and Naiya T. K., “Use of Novel Natural Surfactant for Improving Flowability of Indian Heavy Crude Oil,” Pet. Sci.
Technol., 2015, 33, 819-826.
16. Rasha A., Atta A., and Kabel K., “Modified Maleic Anhydride-Co-Octadecane as Flow Improver for Waxy Egyptian Crude Oil,” Journal
of Petroleum Science & Engineering, 2014, 122,
411-419.
17. Yang F., Li C., Yang S., Zhang Q. et al., “Effect of Dodecyl Benzene Sulfonic Acid (DBSA) and Lauric Amine (LA) on the Associating State and Rheology of Heavy Oils,” Journal of Petroleum
Science & Engineering, 2014, 124, 19-26.