ABSTRACT
The aqueous mixtures of light gas molecules under low-temperature and high-pressure conditions are candidates to form gas hydrate clathrates. The formation of gas hydrate may lead to various problems and extra charges in natural gas production and processing. The presence of hydrate crystals forming a stable solid phase can potentially block the wells, pipes, and process facilities. To avoid such problems, hydrate formation must be studied in different conditions. In this regard, this study aims to design an experimental procedure to determine gas hydrate formation in water based drilling mud. In addition to this, the effect of different inhibitors (i.e. NaCl, methanol, and ethylene glycol) on the hydrate temperature suppression is studied. The designed apparatus is capable of determining hydrate formation conditions in both static and dynamic conditions. Based on the obtained results, among the combinations of NaCl with methanol or ethylene glycol at different concentrations, a mixture of 10 wt.% NaCl + 10 wt.% methanol shows the best inhibition effects (i.e. higher temperature suppression and longer induction time). Furthermore, the experimentally obtained temperature suppression data were fitted and compared against two different thermodynamic models. Temperature suppression variation with inhibitor concentration is described in an acceptable manner by both models.
Keywords: Gas Hydrate, Drilling Mud, Inhibitor, Sodium Chloride, Ethylene Alcohol, Methyl Alcohol, Temperature Suppression
Ali Bakhtyari, Yasin Fayazi, Feridun Esmaeilzadeh*, and Jamshid Fathikaljahi Department of Chemical and Petroleum Engineering, School of Engineering, Shiraz University, Shiraz, Iran
Experimental Determination of the Temperature Suppression in
Formation of Gas Hydrate in Water Based Drilling Mud
*Corresponding author Feridun Esmaeilzadeh Email: [email protected] Tel: +98 71 1613 3710 Fax: +98 71 1613 3710
Article history
Received: June 22, 2016
Received in revised form: March 05, 2017 Accepted: April 03, 2017
Available online: January 07, 2018
INTRODUCTION
An important factor in drilling oil and gas wells is drilling fluid. The adverse selection of drilling fluids may lead to remarkable extra charges and irreparable defects such as derrick destruction. Drilling fluids are complex mixtures of different components, including polymers, bentonite, surfactants, weighting agents, and treatment
control formation, pressure, lubrication, cooling, and removing rock fragments from the drilling well [3]. The explorations and developments of the drilling operations to deep waters, where particular conditions such as lower temperature, higher pressure, and water content are prepared, increase the possibility of gas hydrate formation. The issues of gas hydrate formation in drilling operations are serious. Hence, every attempt to guarantee to remove hydrate formation or to significantly decrease the risk of hydrate formation is appreciated.
Although gas hydrates may be considered as hydrocarbon resources and a medium for storing and transporting natural gas, they could lead to problems with the flow, wellbore collapse, uncontrollable gas release, and blowouts [4-8]. Hydrates are inclusion compounds, where small hydrophobic gas molecules such as methane and carbon dioxide appear to be inside a host molecule such as water at a low temperature and a high pressure. Consequently, gas molecules are trapped into the vacant spaces of water molecules. In other words, the simultaneous crystallization of water molecules and surrounding small gas molecules is the beginning of gas hydrate formation. The cage like crystals is thermodynamically stable in a certain range of temperature and pressure through van der Waals type interaction between the water molecules and the trapped gas molecules. Hydrocarbons such as C1 to C7 and light gases such as nitrogen, carbon dioxide, and hydrogen sulfide are possible candidates to form gas hydrates in water [4,9]. More information on the structures of hydrates could be found elsewhere [4,5]. Hydrates are generally considered a potential
hazard in drilling operations. Blocking subsea risers, obstructing drilling fluid flow and choking and killing lines, and blowing out preventer stacks may be caused by solid hydrates formed in drilling operations in deep water [9,10]. McConnell et al. reviewed the progress in evaluating gas hydrate hazards in drilling operations [11].
hydration conditions in a natural water-based drilling mud is experimentally studied in static and dynamic conditions. Furthermore, two well-known models with thermodynamic backgrounds are used to correlate experimental hydrate suppression data. As far as the authors know, there is no published work in the open literature investigating the effect of different thermodynamic inhibitors on the hydrate suppression in a natural water-based drilling mud in both static and dynamic conditions.
EXPERIMENTAL PROCEDURES
Materials
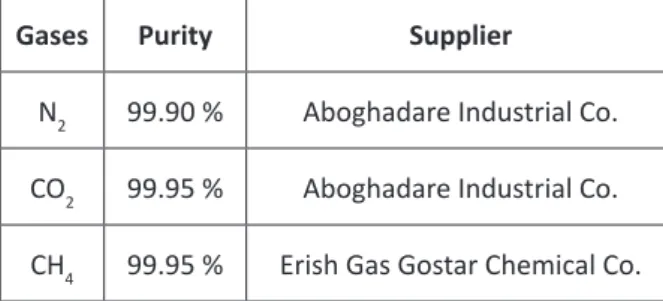
The water-based drilling mud (containing bentonite, water, surfactants, and weighting agents), which is used as the aqueous phase, was donated by National Iranian Oil Company (N.I.O.C.). Carbon dioxide, methane, and nitrogen were used as the gaseous hydrate formers. Gases used in this work, their purities, and their suppliers are shown in Table 1.
Table 1: Details of the used gases in this study.
Gases Purity Supplier
N2 99.90 % Aboghadare Industrial Co.
CO2 99.95 % Aboghadare Industrial Co.
CH4 99.95 % Erish Gas Gostar Chemical Co.
Apparatus and Procedure
The experimental apparatus used in this study to generate hydrate in water-based drilling mud in the presence or absence of the thermodynamic inhibitors is sketched in Figure 1 [3,7].
Figure 1: A schematic diagram of the pilot-scale apparatus for gas hydrate generation loop; T1 and T2: Temperature sensors; P1 and P2: Bourdon pressure gauge; and DP1: Pressure drop gauge.
Model Description
Over the years, different researchers have tried to develop empirical and theoretical expressions for the temperature suppression of hydrate formation in the presence of various inhibitors. A trend similar to the suppression of the freezing point of water with increasing inhibitor concentration is expected for the temperature suppression of hydrate formation [16].
Yousif and Young’s Model
Yousif and Young [17] suggested a simple correlation with a thermodynamic background to evaluate the temperature suppression (ΔT) of hydrate formation in drilling fluids:
3
1 in 2 in2 3 in T a x a x a x
∆ = + +
(1)
were prevented from undesired impurities. A stainless steel bath equipped with a circulator (using ethylene glycol as the coolant) was used to decrease the temperature of the entire loop at a rate of 1.85 K/hr. In addition, the temperature of the fluid inside the loop was measured by locate thermocouples. The initial temperature of all the experiments was 300 K. In each experiment, about 4 liters of the prepared raw drilling mud was loaded to the apparatus from the valve located above the loop. It was then pressurized by using a gaseous mixture containing 26% CH4, 27% N2, and 47% CO2 (on the molar basis). Once the pressure of the cell was reached the desired level (typically 150 bar), the temperature of the cell was started to decrease at a rate of 1.85 K/hr. Inherently, a decrease in the pressure of the cell was observed during the cooling process. The temperature and pressure of the system were monitored over the time. A more sharp decrease in the pressure history of the system was observed at the time of reaching thermodynamic conditions of hydrate formation. Such observation was an indication of gas enclosure in a hydrate structure. Moreover, a mild increase in the temperature of the system was observed due to the exothermic nature of hydrate formation. In the dynamic experiments, a sudden increase in the rate of gas consumption also indicates the hydrate formation. It should be mentioned that the mud with a density of 9230 kg/m3 and a viscosity of 24.2
cP, when moved at a velocity of 0.5 m/s in the flow loop, led to a Reynolds number of 4630. The gas hydrate generator described above can be utilized at pressures up to 150 bar and in the temperatures range of 273 to 300 K.
where, a1, a2, and a3 are constants obtained
by using the regression of the available data of hydrate formation temperature in the presence of different inhibitors. In this equation, xin stands for the molar fraction of salts+inhibitor in the aqueous phase. To calculate xin in a mixture containing salts, glycerol, and alcohols, the molecular weights of salts (MW) need to be corrected to obtain the apparent molecular weights (Maim). This is due to the association of the dissolved salts and the interactions with the glycerol and alcohols [14,15]:
(2)
1
1 1 1
=
= +
α
∑
α NSi
m i
(3)
αNaCl=-3.635028 × 10⁻⁵ W3 + 1.813359 × 10⁻³ W2
-
0.044152W + 0.974734 (4) In the above equations, MWi is the actual molecular weight of the salt i; ni is number of ions resulting from the salt i (i.e. ni=1 for NaCl); αi and αm stand for the degree of ionization of salt i and
(
1 1)
=
α − +i im
m i MW Ma
(
)
2(
2 3)
solute solute 1 2 3
T -a ln 1- x bx c W c W c W
∆ = + + + +
(10) where, W represents the weight percent (wt.%) of the salt; a, b, c1, c2, and c3 are model constants
obtaining by fitting experimental data.
The parameters of Equations 1 and 10 are determined by minimizing an appropriate objective function. Average relative deviation was selected as an appropriate objective function to obtain the parameters of Equations 1 and 10 by using a non-linear regression method such as simplex search method [20]:
. . 1 100 = ∆ − ∆ = ∆
∑
model exp NDP i i exp i i T T %ARDNDP T (11)
RESULTS AND DISCUSSION
The experimentally obtained hydrate temperatures in the presence of different inhibitor compositions are discussed in this section. Moreover, the predicted temperature suppression of hydrate formation of the models is compared with the experimental ones.
Hydrate Formation Temperature
Hydrate formation conditions for a mixture containing 27% nitrogen, 26% methane, and 47% carbon dioxide (on a molar basis) with and without thermodynamic inhibitors were experimentally determined in static and dynamic conditions. The initial conditions, i.e. the total pressure of 150 bar and the temperature of 300 K, were set for all the experiments.
Pure salt (NaCl) and different combinations of salt and methanol (MeOH) or ethylene glycol (EG) were used as the thermodynamic inhibitors. The desired weight percent of the thermodynamic inhibitors in the solution was achieved by the the mixture respectively. W is the weight percent
(wt. %) of the salt [16,17]. Mohammadi and Tohidi [16] and stergaard et al. [18,19] investigated the accuracy of this model and presented some hints in the application of this model.
Mohammadi and Tohidi’s Model
Applying rigorous thermodynamic equations, Mohammadi and Tohidi obtained a correlation for the estimation of hydrate temperature suppression in a mixture of water and salts+organic inhibitors [16]. This model was tested against independent experimental data, and acceptable consistency was observed. They developed their model by considering the non-ideality of the system caused by both organic inhibitors and salts.
(5)
where,γw is the activity of aqueous phase composed of non-electrolyte and electrostatic contributions:
(
)
T ln 1 ln − ln
∆ = −α − + γNon Electrolyte+ γElectrolyte
solute w w
x
(6) Two-suffix Margules equation is used for the non-electrolyte contribution caused by the organic inhibitors. Electrolyte contribution caused by the presence of salts could be expressed by Debye-Hückel equation:
2
lnγNon Electrolyte− =
w bxsolute (7)
( )
(
)
( )
Electrolyte ' ' 2 ' 3
w ws 1 2 3
lnγ =ch f B I =c c W c W c W f B I+ +
(8)
The function f (B I) could be eliminated if B I<1. Hence:
Electrolyte 2 3
w ws 1 2 3
lnγ =ch =c W c W+ +c W (9)
Substituting Equations 7 and 9 into Equation 6 results in the following equation:
(
)
T ln 1 x ln
injection of samples as an aqueous solution. The hydrate formation conditions are recognized in two ways: an instantaneous peak in the temperature of system due to the exothermic nature of gas hydrate formation and an increase in pressure drop in the system due to trapping gas molecules in the formed ice crystals. In addition, increasing the gas consumption rate in the dynamic experiments is a clue to gas hydrate formation.
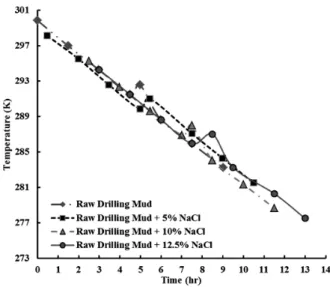
The obtained results for the experiments in static conditions are shown in Figures 2-6. Changes in temperature and pressure versus time for the raw drilling mud (RDM) sample at different concentrations of salt (NaCl) are shown in Figures 2 and 3 respectively. The observed temperature peaks in Figure 2 are the evidence for the gas hydrate formation in the system.
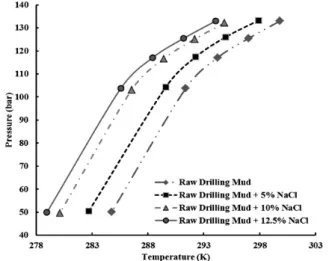
The peaks observed in the temperature are coinciding with the steeper changes in the pressure of system, as shown in Figure 3. As can be seen in these figures, increasing NaCl concentration (as a thermodynamic inhibitor) not only reduces the temperature of gas hydrate formation, but also increases the induction time. A stronger bond comparing to van der Waals forces forms through interactions between the ions of inhibitor and the dipoles of present water molecules. As a result, clusters form around the molecules of the solutes [21]. Moreover, the solubility of guest molecules drops in water due to clustering. Both clustering and reducing solubility of guest molecules make the hydrate formation harder as a lower temperature is required to form hydrate crystals [21]. Figure 4 shows pressure change versus temperature at different concentrations of NaCl. A steeper change in pressure versus temperature is observed at the hydrate formation temperature.
Figure 2: Temperature change versus time for the raw drilling mud sample at different concentrations (wt.%) of salt in static conditions.
Figure 3: Pressure change versus time for the raw drilling mud sample at different concentrations (wt.%) of salt in static conditions.
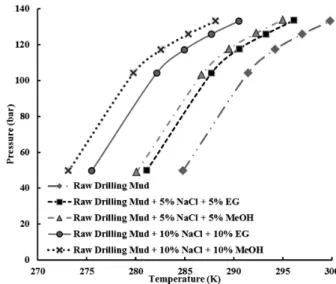
The history curves of temperature, pressure, and time at different concentrations of NaCl and ethylene glycol (EG) or methanol (MeOH) in static conditions are shown in Figures 5 and 6. Mixtures of 5% NaCl + 5% EG and mixtures of 5% NaCl + 5% MeOH reduce the temperature of gas hydrate formation but increase the induction time. A further reduction in the induction time is observed in the mixture of 5% NaCl + 5% MeOH. Clearly, increasing inhibitor concentrations leads to a lower temperature and a longer induction time in hydrate formation. A considerable reduction in the temperature and an increase in the induction time of hydrate formation are observed for a mixture of 10% NaCl + 10% MeOH. Adding MeOH leads to a further increase in the induction time in comparison with EG. In fact, NaCl and alcohols could disrupt formed hydrogen bonding in ice crystals. As a result, hydrate formation and trapping gas molecules are postponed. Hence, increasing the inhibitor concentration causes the temperature of gas hydrate formation to reduce but increases the induction time.
Figure 5: Temperature change versus time for the raw drilling mud sample at different concentrations (wt.%) of salt and EG or MeOH in static conditions.
Figure 6: Pressure change versus temperature for the raw drilling mud sample at different concentrations (wt.%) of salt and EG or MeOH in static conditions.
A quantitative comparison of hydrate formation conditions at different concentrations of thermodynamic inhibitors are presented in Tables 2 and 3.
wt.% NaCl + 5 wt.% EG (Mix. 5) leads to a 3.7 K and 1 hour change respectively in the temperature and induction time of gas hydrate formation. A similar
Table 2: Gas hydrate formation conditions at different inhibitor concentrations in static conditions.
Mixture Composition (wt%) Hydrate Formation Temperature (K) a Hydrate Formation Pressure (bar)b Induction Time (hr.)
Mix. 1 (No inhibitor added)RDM 292.6 106.7 5.0
Mix. 2 RDM+5 NaCl 290.5 106.7 5.5
Mix. 3 RDM+10 NaCl 287.9 106.7 7.5
Mix. 4 RDM+12.5 NaCl 286.8 106.7 8.5
Mix. 5 RDM+5 NaCl+5 EG 288.9 106.7 6.5
Mix. 6 RDM+ NaCl+5 MeOH 287.8 106.7 8.0
Mix. 7 RDM+10 NaCl+10 EG 283.2 106.7 9.0
Mix. 8 RDM+10 NaCl+10 MeOH 280.9 106.7 10.5
a: Measured with ± 0.1 K uncertainty b: Measured with ± 0.7 bar uncertainty
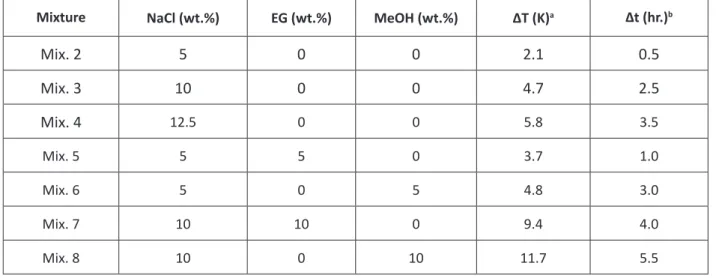
Table 3: Comparing temperature suppression (ΔT) and induction time change (Δt) for gas hydrate formation at different concentrations of inhibitors in static conditions.
Mixture NaCl (wt.%) EG (wt.%) MeOH (wt.%) ΔT (K)a Δt (hr.)b
Mix. 2 5 0 0 2.1 0.5
Mix. 3 10 0 0 4.7 2.5
Mix. 4 12.5 0 0 5.8 3.5
Mix. 5 5 5 0 3.7 1.0
Mix. 6 5 0 5 4.8 3.0
Mix. 7 10 10 0 9.4 4.0
Mix. 8 10 0 10 11.7 5.5
a: Suppression of hydrate formation temperature
b: Change in induction time compared withthe raw drilling mud (no inhibitor added)
A comparison between the different mixtures reveals that the best effect in gas hydrate formation inhibition is observed for a mixture of 10 wt.% NaCl + 10 wt.% MeOH (Mix. 8) showing a 11.7 K reduction in the temperature of hydrate formation and a 5.5-hour increase in the induction time. Totally, it is observed that induction times in the presence of NaCl + MeOH would be longer and hydrate formation temperatures would considerably be lower in comparison with the mixtures in the presence of the other inhibitors. The experimentally obtained results for the dynamic system are shown in Figures 7-10. As previously mentioned, an immediate increase in the temperature of system is a criterion for gas hydrate formation. Moreover, a sudden increase in the gas consumption rate due to trapping gas molecules in the formed crystals is evidence for gas hydrate formation in the system. Consequently, gas consumption should be scanned in addition to temperature history curves.
Gas consumption and temperature profiles versus time for the RDM sample and different mixtures of NaCl are shown in Figures 7 and 8 respectively. Hydrate formation in the system could be recognized by peaks in temperature profiles as shown in Figure 7. The observed temperature peaks are coinciding with the higher gas consumption rate as shown in Figure 8. As can be seen in these figures, an increase in NaCl concentration leads to gas hydrate formation at lower temperatures and longer induction times. Accordingly, NaCl can have a remarkable kinetic inhibition effect on gas hydrate formation.
Figure 7: Gas consumption variation against time for the raw drilling mud at different concentrations (wt.%) of salt in dynamic conditions.
Figure 8: Temperature variation against time for the raw drilling mud at different concentrations (wt.%) of salt in dynamic conditions.
increase in the induction time were observed in tandem. . Mixtures containing MeOH show better inhibition effects in comparison with the mixtures having EG. Increasing inhibitor concentrations lead to form gas hydrate at lower temperatures and longer induction times. A significant reduction in the temperature and an increase in the induction time of gas hydrate formation are observed for a mixture containing 10% NaCl + 10% MeOH. Adding MeOH causes more delay in the induction time compared to adding EG.
Figure 9: Gas consumption variation against time for the raw drilling mud at different concentrations (wt.%) of salt and EG or MeOH in dynamic conditions.
Figure 10: Temperature variation against time for the raw drilling mud at different concentrations (wt.%) of salt and EG or MeOH in dynamic conditions.
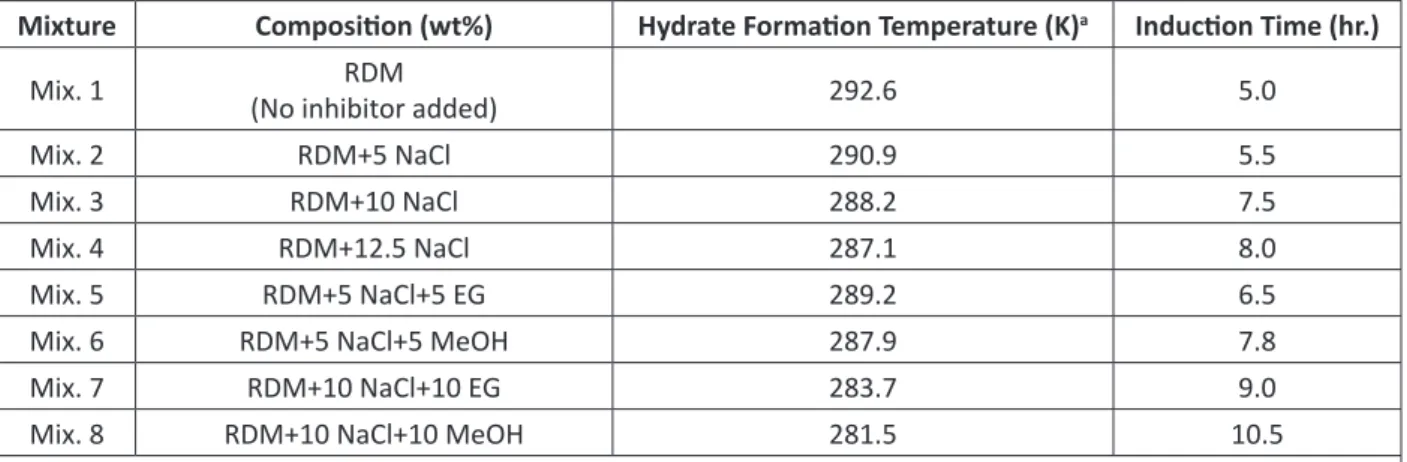
Hydrate formation conditions at the different concentrations of thermodynamic inhibitors are quantitatively compared in Tables 4 and 5. The injection of 5, 10, and 12.5 wt.% of pure NaCl to the RDM sample in dynamic conditions (Mix. 2, Mix. 3, and Mix. 4) leads to a decrease of 1.7, 4.4, and 5.5 K in gas hydrate formation temperature respectively. Nevertheless, an increase of 0.5, 2.5, and 3 hours in the induction time is observed with the addition of 5, 10, and 12.5 wt.% of pure NaCl respectively. Consequently, both thermodynamic and kinetic inhibition effects are enhanced together by increasing NaCl concentration.
Table 4: Summary of gas hydrate formation conditions for different inhibitors in dynamic conditions. Mixture Composition (wt%) Hydrate Formation Temperature (K)a Induction Time (hr.)
Mix. 1 (No inhibitor added)RDM 292.6 5.0
Mix. 2 RDM+5 NaCl 290.9 5.5
Mix. 3 RDM+10 NaCl 288.2 7.5
Mix. 4 RDM+12.5 NaCl 287.1 8.0
Mix. 5 RDM+5 NaCl+5 EG 289.2 6.5
Mix. 6 RDM+5 NaCl+5 MeOH 287.9 7.8
Mix. 7 RDM+10 NaCl+10 EG 283.7 9.0
Mix. 8 RDM+10 NaCl+10 MeOH 281.5 10.5
Table 5: Comparing temperature suppression (ΔT) and induction time change (Δt) for gas hydrate formation at different concentrations of inhibitors in dynamic conditions.
Mixture NaCl
(wt.%) (wt.%)EG (wt.%) ΔT (K)MeOH a (hr.)Δt b
Mix. 2 5 0 0 1.7 0.5
Mix. 3 10 0 0 4.4 2.5
Mix. 4 12.5 0 0 5.5 3.0
Mix. 5 5 5 0 3.4 1.5
Mix. 6 5 0 5 4.7 2.8
Mix. 7 10 10 0 8.9 4.0
Mix. 8 10 0 10 11.1 5.5
a: Suppression of hydrate formation temperature
b: Change in induction time compared withthe raw drilling mud (no inhibitor added)
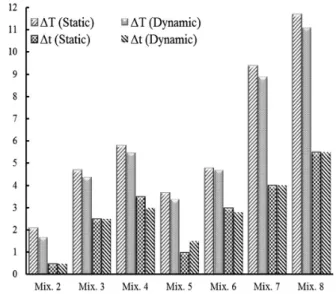
Same as what has been observed in the static conditions, the addition of MeOH shows better results in the hydrate formation conditions in comparison with the mixtures of EG. As can be seen in Tables 4 and 5 and Figure 11, a mixture of 5 wt.% NaCl + 5 wt.% MeOH (i.e. Mix. 6) leads to 4.7 K reduction in the temperature of gas hydrate formation as well as 2.8 hours increase in the induction time. Moreover, utilizing 5 wt.% NaCl + 5 wt.% EG (i.e. utilizing Mix. 5) causes the gas hydrate temperature and induction time to change 3.4 K and 1.5 hours, respectively. Mix. 7 and Mix. 8 with different concentrations of EG and MeOH show similar trends.
Figure 11: Comparison of changes in temperature (ΔT [K]) and induction time (Δt [hr.]) for gas hydrate formation in dynamic and static conditions.
By comparing different formulations, we could find out that the mixture of 10 wt.% NaCl + 10 wt.% MeOH (Mix. 8) with a 11.1 K reduction in gas hydrate formation temperature and a 5.5-hour increase in the induction time shows the best results in the process of inhibiting gas hydrate formation in drilling mud. The same results were obtained in static conditions.
conditions in the system lead to more effective contact between the gas and water molecules. Consequently, the transfer of gas molecules from gas phase to the water phase enhances. A similar observation was reported by Lee et al. in the formation of CH4 hydrate [22]. They observed that by increasing fluid velocity, the temperature of hydrate formation increased.
Hydrate Temperature Suppression
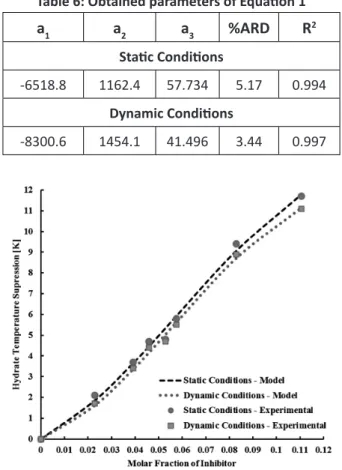
The best-fit parameters of Equations 1 (i.e. Yousif and Young’s model) are tabulated in Table 6. As can be seen, this model has a good performance in describing temperature suppressions of both static and dynamic conditions. However, higher accuracy was observed in describing temperature suppressions in dynamic conditions. The experimental results and the results of this model in both static and dynamic conditions are compared in Figure 12. Clearly, the variation of temperature suppression with the molar fraction of inhibitor is well described by this model. Consequently, this model has a capability to describe hydrate temperature suppressions of the drilling mud with a mixture of NaCl and organic inhibitors. As depicted in this figure, lower temperature suppressions are observed in dynamic conditions. In fact, hydrate crystals are formed at higher temperatures in dynamic conditions. Such an observation could be due to turbulence in the system produced by flowing fluid.
Table 6: Obtained parameters of Equation 1
a1 a2 a3 %ARD R2
Static Conditions
-6518.8 1162.4 57.734 5.17 0.994 Dynamic Conditions
-8300.6 1454.1 41.496 3.44 0.997
Figure 12: Comparing variation of temperature suppression with the molar fraction of inhibitor in both static and dynamic conditions.
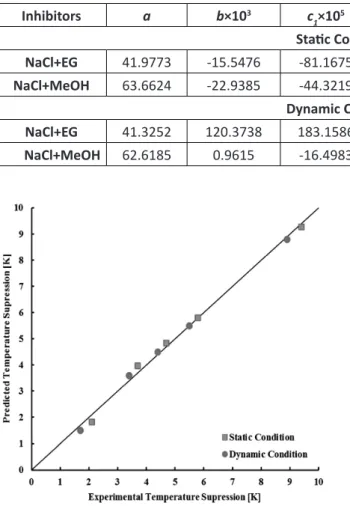
Table 7: Obtained parameters of Equation 10
Inhibitors a b×103 c
1×10⁵ c2×104 c3×105 %ARD R2 Static Conditions
NaCl+EG 41.9773 -15.5476 -81.1675 -20.7718 10.0633 5.01 0.996
NaCl+MeOH 63.6624 -22.9385 -44.3219 -13.8872 6.7291 4.72 0.998
Dynamic Conditions
NaCl+EG 41.3252 120.3738 183.1586 -23.6088 10.8979 4.25 0.997
NaCl+MeOH 62.6185 0.9615 -16.4983 -12.7624 5.8184 2.02 0.999
Figure 13: Comparing predictions of Mohammad and Tohidi’s model with the experimental data (NaCl+EG data).
Figure 14: Comparing predictions of Mohammad and Tohidi’s model with the experimental data (NaCl+MeOH data).
CONCLUSIONS
The gas hydrate formation for a gaseous mixture containing 26% CH4, 27% N2, and 47% CO2 in a drilling mud sample in the presence of different concentrations of thermodynamic inhibitors such as pure NaCl and mixtures of NaCl with EG or MeOH were experimentally studied. In this regard, an apparatus working in both static and dynamic conditions was introduced. By extracting temperature, pressure, and gas consumption rate from the apparatus, the conditions of gas hydrate formation were determined. A peak in the temperature history curve and a sharp pressure change were considered as evidence for gas hydrate formation in the static experiments, while an increase in gas consumption and a peak in the temperature history curve were considered as clues to gas hydrate formation in dynamic experiments. Followings are the advancements of the present study:
• In static conditions, the hydrates were formed in a drilling mud sample without any thermodynamic inhibitors at a temperature of 292.6 K after 5 hours.
• Increasing pure NaCl concentration up to 12.5 wt.% leads to a drop of 5.8 K and 5.5 K in the hydrate formation temperature in static and dynamic conditions respectively.
supporting this research.
REFERENCES
1. Liyia Ch., Shenga W., and Changwena Y., “Effect of Gas Hydrate Drilling Fluids Using Low Solid Phase Mud System in Plateau Permafrost,”
Procedia Engineering, 2014, 73, 318-325. 2. Xiaolan L., Zuohui L., Yong Z., and Rongqiang
L., “Gas Hydrate Inhibition of Drilling Fluid Additives,” 7th International Conference on Gas
Hydrates (ICGH), United Kingdom, 2011. 3. Esmaeilzadeh F., Fayazi Y., and Fathikaljahi
J., “Experimental Investigation of a Mixture of Methane, Carbon Dioxide & Nitrogen Gas Hydrate Formation in Water-Based Drilling Mud in the Presence or Absence of Thermodynamic Inhibitors,” Proceedings of World Academy of
Science, Engineering and Technology, 2009.
4. Esmaeilzadeh F., “Simulation Examines Ice, Hydrate Formation in Iran Separator Centers,” Oil & Gas Journal, 2006, 104, 46-52.
5. Esmaeilzadeh F., Zeighami M. E., and Fathi J., “1-D Modeling of Hydrate Decomposition in Porous Media,” Proceedings of World Academy
of Science, Engineering and Technology, 2008.
6. Sarshar M., Esmaeilzadeh F., and Fathikaljahi J., “Predicting the Induction Time of Hydrate Formation on a Water Droplet,” Oil & Gas
Science and Technology, 2008, 63, 657-667.
7. Talaghat M. R., Esmaeilzadeh F., and Fathikaljahi J., “Experimental and Theoretical Investigation of Double Gas Hydrate Formation in the Presence or Absence of Kinetic Inhibitors in a Flow Mini-Loop Apparatus,” Chemical Engineering & Technology, 2009, 32, 805-819. 8. Klauda J. B. and Sandler S. I., “Global
Distribution of Methane Hydrate in Ocean the induction time was respectively
observed in static and dynamic conditions. • In static conditions, the addition of 10 wt.% NaCl + 10 wt.% EG to the drilling mud causes the hydrate formation temperature to decrease by 3.2% (i.e. 9.4 K) and the induction time to increase by 80% (i.e. 4 hrs).
• In static conditions, the addition of 10 wt.% NaCl + 10 wt.% MeOH to the system suppresses hydrate formation temperature by 4% (i.e. 11.7 K) but raises the induction time by 110% (i.e. 5.5 hrs).
• In dynamic conditions, the effect of inhibitor addition was similar to the one in static conditions with slight suppression of hydrate formation temperature. The observed decrease was due to turbulence in the system. • Two different correlations with theoretical backgrounds were used to correlate suppression of hydrate formation temperature. Based on the obtained results, both models are capable of representing the temperature suppression of hydrate formation in a drilling mud sample in the presence of NaCl and an organic inhibitor.
Authors believe that more investigations and analyses are required to determine the structure of the formed hydrate clathrates and the fraction of trapped molecules in the crystals of hydrates. Structure I is formed in the presence of small molecules such as CO2 and CH4, while the formation of structure II is dominant in the presence of larger molecules such as N2.
ACKNOWLEDGEMENTS
Sediment,” Energy & Fuels, 2005, 19, 459-470. 9. Sun J., Ning F., Wu N., Li S., and et al., “The Effect of Drilling Mud Properties on Shallow Lateral Resistivity Logging of Gas Hydrate Bearing Sediments,” Journal of Petroleum Science and Engineering, 2015, 127, 259-269.
10. Zhao X., Qiu Z., Zhou G., and Huang W., “Synergism of Thermodynamic Hydrate Inhibitors on the Performance of Poly (Pinyl Pyrrolidone) in Deepwater Drilling Fluid,” Journal of Natural Gas Science and Engineering, 2015, 23, 47–54.
11. McConnell D. R., Zhang Z., and Boswell R., “Review of Progress in Evaluating Gas Hydrate Drilling Hazards,” Marine and Petroleum
Geology, 2012, 34, 209–223.
12. Lai D. T. and Dzialowski A. K., “Investigation of Natural Gas Hydrates in Various Drilling Fluids,” SPE 18637, SPE/IADC Drilling Conference, New Orleans, 1989.
13. Pakulski M., Qu Q., and Pearcy R., “Gulf of Mexico deepwater Well Completion with Hydrate Inhibitors,” SPE Paper No. 92971, 2005.
14. Quigley M. S. and Hubbard J. C., “Gas Hydrates Formation in Drilling Fluids,” Drilling Managers Technical Meeting at Mobil Research & Development Corp., 1990.
15. Kotkoskie T. S., AI-Ubaldi B., Wildeman T. R., “Sloan, E. D. Jr., Inhibition of Gas Hydrates in Water-Based Drilling Muds,” SPE Drilling Engineering, Society of Petroleum Engineers, SPE-20437-PA, 1992.
16. Mohammadi A. H. and Tohidi B., “A Novel Predictive Technique for Estimating the Hydrate Inhibition Effects of Single and Mixed Thermodynamic Inhibitors,” The Canadian
Journal of Chemical Engineering, 2005, 83,
951-961.
17. Yousif M. H. and Young D. B., “A Simple Correlation to Predict the Hydrate Point Suppression in Drilling Fluids,” SPE/IADC 25705, SPE/IADC Drilling Conference, Amsterdam, The Netherlands, 1993.
18. stergaard K. K., “Gas Hydrate Stability in the Petroleum Industry and its Application in Gas-Liquid Separation,” PhD Thesis, Heriot-Watt University, Edinburgh, U.K., 2000.
19. stergaard K. K., Tohidi B., Danesh A., and Todd A. C., “Gas Hydrates and Offshore Drilling: Predicting the Hydrate Free Zone,” Annals of New York Academy of Sciences, 2000. 20. Lagarias J. C. and Reeds J. A., Wright M. H.,
and Wright P. E., “Convergence Properties of the Nelder-Mead Simplex Method in Low Dimensions,” SIAM Journal of Optimization, 1998, 9, 112-147.
21. Sloan E. D. Jr., “Clathrate Hydrates of Natural Gases,” Marcel Dekker Inc.: New York 10016, 1990.