Integrated Reporting Governance Committee
Confirm Terms of Reference (20 mins)
Program Updates (40 min)
Financial Analytics Reports
Tuition Allocation Model
IR Roadmap (30 mins)
FY14/15 Funded Projects
Proposed Projects :
SEoT, Marianne Schroeder
PAIR, Marcela Hernandez
Confirm Terms of Reference (20 mins)
Program Updates (40 min)
Financial Analytics Reports Tuition Allocation Model
IR Roadmap (30 mins)
FY14/15 Funded Projects Proposed Projects :
SEoT, Marianne Schroeder PAIR, Marcela Hernandez
Confirm Terms of Reference (20 mins)
Program Updates (40 min)
Financial Analytics Reports
Tuition Allocation Model
IR Roadmap (30 mins)
FY14/15 Funded Projects Proposed Projects :
SEoT, Marianne Schroeder PAIR, Marcela Hernandez
User Acceptance Training (UAT)
Testing of
Foundational
Platform: Replicate
Nquery Reports and
prove data.
Arts & Science Pilot
Focus on “look and
Feel” of FAR, Test
intuitiveness, get
feedback from non
accounting type
users
CFBA/NUBO Pilot
Focus on
Visualizations and
new Home Page.
Reinforce financial
functionality with
power finance users.
Project Gates: Finance R1 Completion Schedule
March 2014
March 3-7 Mar 10-31
Using Current Production Environment User Setup
New Home Page
Reinforce Financial Functionality
Request Feedback for Improvement
Iterative Approach with All Users Improve Navigation
Additional Dashboards Summary Visualizations
Move Executive dashboards to R2
Request Feedback for Improvement
Current Issues / Risks: Finance R1
Risks Priority
H-M-L
Comments 1. Oracle BI Apps – Financial package. Found significant
immaturities in the package and the vendor has not been responsive in addressing these.
H Impacts: UBC has experienced significant impacts to project time-lines due to immaturity of product. Currently, we have issues with crossing fiscal year boundaries – the feature does exist in parallel product.
Mitigation: Work with Oracle (not successful), review feature in parallel product, work with consultant for interim custom solution.
2. Planned changes may impact to campus during year end timeframe.
M Mitigation: Review impact with UAT for recommendation.
Issues Priority
H-M-L
Comments
1. Financial Analytics Historical Chart field attributes. M Action: Custom work – post effective dated trees solution (might have a combined solution with #2 as an option.
2. Financial Analytics Effective Dated Trees. H Action: Working with Oracle and consultant for custom solution. Feature is in parallel product, but not in our version. See risks.
1. Operations and Support Resources M Action: Technical skills availability is limited. Project manager still supporting FMS and IR.
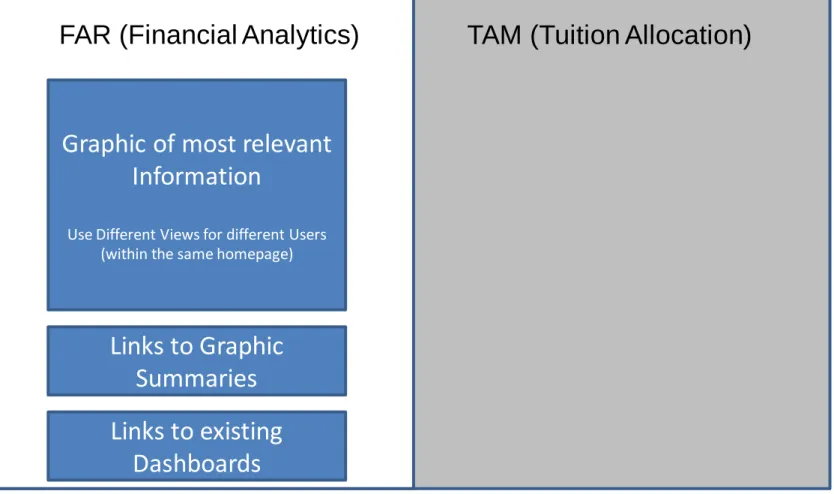
Home Page Summary level Graphics - Executive Summary level Graphics – Finance user (Nquery) Summary level Graphics – Casual, Non Finance or Research User General Ledger Dashboard AP Dashboard Payroll Dashboard PO Dashboard Commitments Dashboard New
Graphic of most relevant Information
Use Different Views for different Users (within the same homepage)
Links to existing Dashboards Links to Graphic
Summaries
FAR (Financial Analytics) TAM (Tuition Allocation)
HOME PAGE
Use Different Views-
Home Page Summary level Graphics - Executive Summary level Graphics – Finance user (Nquery) Summary level Graphics – Casual, Non Finance or Research User General Ledger Dashboard AP Dashboard Payroll Dashboard PO Dashboard Commitments Dashboard
Summary level Graphics - Executive Summary level Graphics – Finance user (Nquery) Summary level Graphics – Casual, Non Finance or Research User
• A summary level can be created to facilitate navigation from the homepage as well as offer users new management tools
• Set up would be similar to Homepage with selectable views for different user groups
• This level can have different areas (dashboards), presenting Management focused summaries (Performance, time comparison, variance analysis, etc) • Passing of filters can be helped by having this summary level
• Use of Views can be used to switch between summary and detail, tables and graphs, and high level summary to lower level summaries
• This level can be accessed directly from link on Homepage, or navigated to from the Homepage graphic
Home Page Summary level Graphics - Executive Summary level Graphics – Finance user (Nquery) Summary level Graphics – Casual, Non Finance or Research User General Ledger Dashboard AP Dashboard Payroll Dashboard PO Dashboard Commitments Dashboard
General Ledger Dashboard AP Dashboard Payroll Dashboard PO DashBoard Commitments Dashboard
• Existing Dashboards can be improved to include Views that can toggle between summary and detailed reports
• Currently Dashboards were designed to replicate Nquery and are detail oriented and facilitate troubleshooting at the transaction detail
• Views can let users select between all fields or few fields (similar to customizations) • This view can be accessed directly from Homepage, or navigated to from
Homepage
• Since these existing Dashboards are resource heavy, having the Homepage present users with relevant summaries may help direct traffic away from detailed reports (Saving system resources, and load)
Confirm Terms of Reference (20 mins)
Program Updates (40 min)
Financial Analytics Reports
Tuition Allocation Model
IR Roadmap (30 mins)
FY14/15 Funded Projects Proposed Projects :
PAIR, Marcela Hernandez SEoT, Marianne Schroeder
Deconstruction of XLS model
To automate what we can
To operationalize what we cannot automate
Better Visibility into TAM Information
Analytical Access to TAM results for Projection Run and Final Run
• Drill into the detailed information behind the TAM • To enhance understanding, increase insight
• To use for other purposes, e.g. allocation within the faculty
To compare results from one run to another
Eventually to monitor how changes in registration impact TAM
24
Project Scope: Student R1
Original Scope In Scope Out of Scope
Tuition Allocation Model (TAM)
• Per Faculty Allocation
• Driver Detail Views
• Summary Dashboard
• ISI Dashboard
Tuition Allocation Model (TAM)
• Per Faculty Allocation
• Driver Detail Views
• Summary Dashboard
• ISI Dashboard
• Central Finance Dashboard
TAM Monitoring Analysis NEW (Daily/Weekly/Monthly)
Annual Operational Reviews:
Next Fiscal Year Templates including any New Functional Work – i.e., TAM for UBCO; Vantage College; Use of Course Ownership Table. Can also include Future Report Decommission Exercises.
Undergraduate Admissions Undergraduate Admissions
• R2: FY2014/15 Funded
Registration & Student Finance Foundation
Residual Registration & Residual Student Financials
Project Gates: Student R1 Completion Schedule
25
PROG Pre-Prod
February 2014 March 2014 April 2014
Feb 5 TA/QA Feb 20 TA/QA Mar 31 TA/QA Apr 15 TA/QA
Full PROG/SECT Pre-Prod
PROG FY 2013 Data
Per Faculty Allocation Driver Detail Views
PROG-SECT Bugs/Fixes
FY 2014 Rules & FY2014 Data Summary Dashboard
Remaining SECT Bugs/Fixes Integrity Cleanup
ISI Dashboard
Central Finance Dashboard
Base TAM Dashboards
TAM Monitoring Analysis
√
Early UAT Feb 18-19
- Student Finance
Early UAT Mar 4-14
- Student Finance
- Select Users (Mar 10-14)
UAT Apr 10-14
- Student Finance - Select Users
UAT Apr 24-28
- Student Finance
Change Management Strategy Training: April 29/30
End User Access and Handout Material
Support & Service Transition
Continued Development UAT Sign-off – Go / No Go Approval
Integrity Cleanup Pre-Prod
Production Rollout
Early Look and Feel
- Governance Committee and Working Committee Demos - Student Finance Access
Current Issues / Risks: Student R1
Risks Priority
H-M-L
Comments
1. System Performance Monitoring.
2. Evolution of Business Processes and
Integration with other Systems.
M
M
Mitigation: (1) Began
monitoring in February 2014. (2) Determine a performance testing strategy moving into March-April 2014.
Mitigation: (1) Engage business for direction (2) Revisit design model once complete Student R1.
Confirm Terms of Reference (20 mins)
Program Updates (40 min)
Financial Analytics Reports Tuition Allocation Model
IR Roadmap (30 mins)
FY14/15 Funded Projects
Proposed Projects :
SEoT, Marianne Schroeder PAIR, Marcela Hernandez
FY 10/11
FY 11/12
FY 12/13
FY 13/14
FY 14/15
FY 15/16
Phase 0 (Initiation) Phase 1 (Discovery) Phase 2 (Foundation) Phase 3 (Transformation) •Conduct RFP to choose BI vendor•Secure approval & initial funding from program sponsors •Mobilize program team •Establish program governance •Establish solution blueprint •Prototype solution •Confirm Release 1 Detailed Scope •Implement enterprise data warehouse foundation • Initial integration of core Student & Financial base data
• Tuition Allocation Model & Financial Analysis
Release 1:
• Finance (FMS)
• Student Bio (SIS)
• Student Records & Reg. (SIS)
• Student Revenue (SIS) • Admission (SIS) •Continue integration of remaining core Student •Integration of HR data • Integration of Budget & Planning data Release 2: •Employee (HRMS) •Budget & Planning (Hyperion) •Recruitment (SIS) •Begin integration of broader sets of campus data subject areas and analytics *Release 3: •Learning (SEoT) •Classroom Scheduling •Grad Studies •Continue integration of broader sets of campus data subject areas and anayltics
*Release 4:
•Research (RISE)
•Land & Building
•Alumni
IR Program Roadmap: Originally
* Phase 3 Funding and Scope to be confirmed with Governance committee in FY13/14
IR Program Roadmap
Phase 0: Initiation Procure Funding Vendor Selection Phase 1: Discovery Team Mobilization Program Governance Solution Blueprint Foundation Scope Student Prototype: ISIPhase 2: Enterprise Data Warehouse Foundation
Finance R1 Finance R2 Student R1 Student R2 HR R1 FY 10/11 FY 11/12 FY 12/13 FY 13/14 FY 14/15 FY 15/16 Q1 Q2 Q3 Q4 Q1 Q2 Q3 Q4 Q1 Q2 Q3 Q4 Q1 Q2 Q3 Q4 Q1 Q2 Q3 Q4 Q1 Q2 Q3 Q4 Not Started (timeline tbc) Completed In-Progress • Student Bio • Registration • Student Financials
• Tuition Allocation Model (TAM) Reports • CFBA, Budget Office roll-out • Finance (FMS) data integration
• nQuery online operational report replacement • Chartfields, JV, Payroll, AP, PO, Commitments • Multi-Ledger GL Summary
• Plan & Forecast Ledger • Arts, Science, CFBA/NUBO roll-out
• Undergraduate Admissions • Residual Registration • Residual Student Financials • Researcher Report
• nQuery Decommission • Broader roll-out
Today Where we are & What is funded for FY14/15
• Integrate Foundation HR data • Subject Areas TBC
Confirm Terms of Reference (20 mins)
Program Updates (40 min)
Financial Analytics Reports
Tuition Allocation Model
IR Roadmap (30 mins)
FY14/15 Funded Projects
Proposed Projects :
SEoT, Marianne Schroeder
PAIR, Marcela Hernandez
CTLT supports and advances scholarly and innovative
approaches to teaching, learning, curriculum and educational
technology practices.
New Senate Policy on Student Evaluation of Teaching enacted in
May 2007; monitored by Senate annually
CTLT tasked with implementing online evaluation; all Faculties on
both campuses use it
CTLT and PAIR were charged with responsibility for the
institutional data
SEoT data is confidential, requiring high levels of
security; access is defined by Senate Policy. The data
is used for high stakes decision making.
The SEoT Reporting database design does not follow
best practices, and to offer this service in a sustainable
way would require substantial new investment.
Problem Statement
PoC was funded as part of the SiTP project, using IR
resources. Implementation was never scheduled.
It is inefficient and ineffective (as well as risky from a
data security point of view) to duplicate services.
In order to follow best practices in research and
evaluation methodology, to ensure data security, to
make effective and efficient use of UBC resources, the
data needs to be moved to SERA.
Extend license for current software for another six
months
Work with IR Team to determine when roadmap
permits moving from PoC to production
Present results at next Governance meeting
Confirm Terms of Reference (20 mins)
Program Updates (40 min)
Financial Analytics Reports
Tuition Allocation Model
IR Roadmap (30 mins)
FY14/15 Funded Projects
Proposed Projects :
SEoT, Marianne Schroeder
PAIR, Marcela Hernandez
Agenda
1. PAIR Mandate
2. PAIR Data sets – Problem Statement 3. Proposed Solution
PAIR Mandate
Foster an environment where PAIR staff work effectively, efficiently, and collaboratively, sharing best practices,
strengths in research methodology, access to resources, and knowledge of critical issues in higher education.
To transform data into information, knowledge and strategic intelligence in support of the goals of the University of British Columbia
To fulfill our mandate:
Problem Statement
To work effectively:
Single source of data
Agree on data definitions and best practices
Eliminate security risks
Collaboration and knowledge transfer
Appropriate ETL tools
The EDW currently doesn’t contain all the datasets required by PAIR.
Problem Statement
To work effectively with Tableau:
Define and implement a Tableau server environment
Define and implement proper Security
Best practices and use of UBC data definitions
Tableau is a tool for data analytics to be used to query departmental data sets.
Proposed solution
Two projects:
Project 1: Tableau Implementation
Establish a vision for Tableau in the UBC Community
• Working with IR team and faculties to source a proper Tableau Server environment
• Project management
• Ongoing server and application support • Tableau security
Proposed solution
Two projects:
Project 2: PAIR Database
Single source of data for PAIR combining data from various systems across campus:
• Shared data definitions
• Best practices and collaboration
• Security and database administration IT functions should reside in IT
Proposed Solution – Integrated Reporting
In collaboration with the Integrated Reporting Team
Work performed for implementation of the PAIR database will be
used in the IR project when new data sources are incorporated
Tableau implementation will be in collaboration with the IR Team
to ensure best practices, minimize security risks and ensure proper ownership and administration of Tableau is in place.
Proposed solution – Next Steps
Initiate the project and establish a roadmap to incorporate PAIR
data sets into IR.
Initiate the implementation of Tableau Server in collaboration
with the IR team.
Confirm Terms of Reference (20 mins)
Program Updates (40 min)
Financial Analytics Reports
Tuition Allocation Model
IR Roadmap (30 mins)
FY14/15 Funded Projects
Proposed Projects :
SEoT, Marianne Schroeder
PAIR, Marcela Hernandez