TopoMon
: A Monitoring Tool for Grid
Network Topology
Mathijs den Burger, Thilo Kielmann, and Henri E. Bal
Division of Mathematics and Computer Science, Vrije Universiteit, De Boelelaan 1081a, 1081HV Amsterdam, The Netherlands
{mathijs,kielmann,bal}@cs.vu.nl http://www.cs.vu.nl/albatross/
Abstract. In Grid environments, high-performance applications have to take into account the available network performance between the indi-vidual sites. Existing monitoring tools like the Network Weather Service (NWS) measure bandwidth and latency of end-to-end network paths. This information is necessary but not sufficient. With more than two par-ticipating sites, simultaneous transmissions may collide with each other on shared links of the wide-area network. If this occurs, applications may obtain lower network performance than predicted by NWS.
In this paper, we describe TopoMon, a monitoring tool for Grid
net-works that augments NWS with additional sensors for the routes be-tween the sites of a Grid environment. Our tool conforms to the Grid Monitoring Architecture (GMA) defined by the Global Grid Forum. It unites NWS performance and topology discovery in a single monitoring architecture. Our topology consumer process collects route information between the sites of a Grid environment and derives the overall topology for utilization by application programs and communication libraries. The topology can also be visualized for Grid application developers.
1
Introduction
A difficult problem in designing efficient applications for computational Grids is that the wide-area interconnection network is highly complex, dynamic, and heterogeneous. A more traditional computing platform such as a cluster or su-percomputer typically has a highly regular network with constant, guaranteed performance. With a Grid, however, the network has an irregular and asym-metric topology, where different links have different speeds, which even change over time. The Network Weather Service (NWS) [23] is a tool that addresses this problem by providing dynamic bandwidth and latency measurements and predictions.
Unfortunately, the information provided by NWS is insufficient for applica-tions with communication patterns where multiple sites compete for the same links. For example, if two pairs of communicating sites are used, NWS will pre-dict performance for each pair separately. If the two communication streams have some links in common, however, these predictions will clearly be too opti-mistic, as the bandwidth for these links has to be shared by the two streams. The
current NWS system cannot solve this problem, because it lacks topology infor-mation and thus cannot know which links are shared. This problem is especially important for applications that use collective communication, where many sites communicate with each other simultaneously. The work on MPICH-G (the MPI implementation of Globus [5]) has shown that our wide-area collective commni-cation library (MagPIe, [10]) has exactly this problem for shared links [8].
In this paper, we present a new tool, TopoMon, which augments NWS
with topology information about the wide-area network. The added value of integrating both performance and topology information is that applications or communication libraries can not only predict their communication performance, but can also avoid congestion on those Internet links that are shared by multiple, simultaneous data streams.
To foster interoperability with other Grid services, our tool conforms to the Grid Monitoring Architecture (GMA) defined by the Global Grid Forum, rec-ommending a structure of separate processes with sensor, producer, consumer,
and directory-service functionality.TopoMoncan analyze which paths between
Grid sites overlap with each other, possibly resulting in performance (congestion)
problems. The topology is determined by sensors that internally use traceroute
and is output in the form of XML event descriptions. The NWS measurements and predictions are likewise wrapped using XML. The data from both NWS and topology sensors is sent to a consumer process, which combines the data, for example to compute an optimal spanning tree or to export it for visualization.
The paper is structured as follows. In Section 2, we present TopoMon’s
design and implementation. Section 3 illustrates the added value of integrating
performance and topology data withinTopoMon’s topology consumer process.
Section 4 discusses related work, Section 5 concludes.
2
Tool Design and Implementation
In this section, we describeTopoMon. We present its architecture, the topology
sensors, and the performance and topology information transferred to interested consumer processes.
2.1 The Topology Monitoring Architecture
Our goal is to build a Grid network monitoring system that integrates perfor-mance data with information about the Grid network topology. The system is designed to run on various different platforms that are used by the sites of a Grid
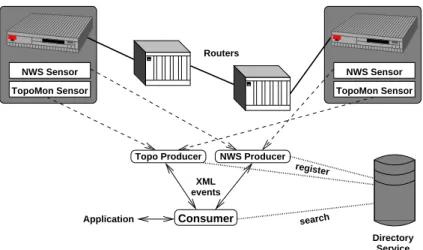
environment. Therefore,TopoMon’s overall architecture (as shown in Figure 1)
follows the proposed Grid Monitoring Architecture (GMA) [3]. For portability, we implemented all processes as Java programs that communicate with each other using TCP sockets. (The platform-specific sensors are written in C.)
According to the GMA, different functionality is implemented in specialized processes that interoperate using specific network protocols. We distinguish
mon-NWS Sensor TopoMon Sensor NWS Sensor TopoMon Sensor NWS Producer Topo Producer Directory Service Consumer XML events search Application Routers register
Fig. 1.TheTopoMonarchitecture
itoring data from one or more sensors to interestedconsumers), and adirectory
service that allows producers and consumers to contact each other.
The Network Weather Service (NWS) [23] already provides excellent per-formance measurements (and forecasts) for end-to-end network bandwidth and latency. Its architecture also conforms with the ideas of GMA. We therefore decided to augment the existing NWS with network topology information. How-ever, the NWS processes communicate with proprietary protocols using binary representations for the data items exchanged. For interoperability, Grid
moni-toring data should be exchanged as XML descriptions of monimoni-toringevents[20].
TopoMon’s implementation builds a wrapper layer around the NWS. The TopoMon performance (“NWS producer”) process presents its performance
data as XML descriptions to its consumer processes. It directly wraps the NWS
producer processes (calledmemoryandforecaster), and translates NWS data to
XML-event descriptions. As with the original NWS software, the NWS memory
processes directly communicate with the NWS network sensors, located at the
participating Grid sites. Furthermore, TopoMon also directly uses the NWS
directory service, calledname server.
In addition to wrapping NWS, TopoMon implements an infrastructure
to generate network topology information. At each participating Grid site, a
TopoMon sensor determines the network paths to all other sites. The Topo
Producer process retrieves the topology information from the sensors in their
respective data format, and presents it as XML event descriptions. We also im-plemented a consumer process that retrieves both the topology and NWS per-formance information, and presents it to application programs. We now describe
the topology-related parts of TopoMonin detail.
2.2 Topology Sensors
TopoMon’s topology sensors explore the structure of the network connecting
the sites of a Grid environment. For high-performance applications, we are in-terested in identifying the end-to-end paths between all sites of a Grid. The performance (bandwidth and latency) of those paths is monitored by the NWS sensors. In addition, we need to identify which parts of the end-to-end paths overlap with each other, as such overlap may cause congestion and performance decrease, if the links are used simultaneously.
As Grid networks are part of the global Internet, identifying end-to-end paths corresponds to observing the respective IP routing information, as used by the
Border Gateway Protocol (BGP) [16]. However, the routing data available from
BGP is restricted to routing betweenAutonomous Systems (AS), which are the
organizational units of the Internet, such as ISPs and their customers. In order to maintain global scalability of routing information, BGP data is restricted to entry and exit routers for each AS; routing inside each AS is performed locally. As a consequence, end-to-end paths and their possible intersections, as needed byTopoMon, can not be derived from BGP data.
Alternatively, path information could be taken from Internet topology repos-itories, like the ones maintained by CAIDA [19]. Unfortunately, those reposito-ries only provide information about the sites included in their own monitoring efforts, a consequence of the intractable size of the Internet as a whole. As
TopoMon’s purpose is to explore the topology exactly between the sites of a Grid environment, general Internet topology repositories do not provide the required information about the specific sites in use.
As a consequence,TopoMon has to perform its own, active topology
dis-covery. The only feasible approach is to perform probes as done by traceroute,
or to run the tool directly between the sites of a Grid environment [18].
trace-routeis directly based on the ubiquitous IP and ICMP protocols. It discovers the routers on a path from one site in the Internet to another one, without relying on any additional network management protocol like SNMP, which is only available
within local network installations. We implemented the TopoMonsensors as
wrapper processes around the locally available traceroute programs.
2.3 Performance and Topology Event Data
The XML producer-consumer protocol, as proposed by the GGF performance working group [20], describes all performance data as timestamped events of name-value pairs. The respective GGF document prescribes the protocol be-tween producers and consumers, covering both subscription to services and the exchange of event data itself. The messages of this protocol, including the event data, are formatted as XML documents.
<NWSBandwidthTcp xmlns="http://www.cs.vu.nl/albatross/TopoMon"> <SourceHostName>das0fs.cs.vu.nl</SourceHostName>
<DestinationHostName>das2fs.wins.uva.nl</DestinationHostName> <NWSForecast> <Value unit="Mb/s">2.31</Value>
<Error>0.010219</Error> </NWSForecast> <TimeStamp>2001-11-25T16.14.38Z</TimeStamp> </NWSBandwidthTcp> <NWSLatencyTcp xmlns="http://www.cs.vu.nl/albatross/TopoMon"> <SourceHostName>das0fs.cs.vu.nl</SourceHostName> <DestinationHostName>huron.cs.unh.edu</DestinationHostName> <NWSForecast> <Value unit="ms">12.3</Value>
<Error>0.00354</Error> </NWSForecast>
<TimeStamp>2001-11-25T16.23.01Z</TimeStamp> </NWSLatencyTcp>
Fig. 2.XML events for NWS bandwidth and latency data
The GGF document also provides simple XML schemas for performance data like network roundtrip times. We use similar XML schemas for representing the data generated by NWS. They are shown using example events in Figure 2. For simplicity of presentation, we present example events rather than the formal schema descriptions themselves. The latter are only needed by the producer and consumer processes implementing the protocols.
The figure shows both a bandwidth and a latency data event. Both event schemas are easily human-readable, which is one of the advantages of using XML [20]. The NWS performance events start with a tag indicating their type, followed by information about source and destination host, identifying the pair of NWS sensors that generated this event. The events are completed with the predicted data value, its predicted error, and the event timestamp.
It should be noted that the bandwidth and latency event descriptions are specific to NWS, the network monitoring tool that generates the events. Unfor-tunately, network performance data is strongly dependent on the measurement method used for generating the data. For example, message roundtrip times
mea-sured by NWS and bypingcan be very different because of the different protocols
its measurement method has to be added. We are involved in the newly-founded
Network Measurements Working Group(NMWG) of the GGF. The NMWG aims
to develop standards to ensure the compatibility of metrics across measurement
systems. Until such standards exist, however, tools likeTopoMonhave to define
their own metrics.
<Traceroute xmlns="http://www.cs.vu.nl/albatross/TopoMon"> maxHops="30" probeSize="38"> <SourceHost> <Name>das0fs.cs.vu.nl</Name> <IP4Address>130.37.26.4</IP4Address> </SourceHost> <DestinationHost> <Name>das2fs.wins.uva.nl</Name> <IP4Address>146.50.13.20</IP4Address> </DestinationHost>
<Hop index="1"> <Host> <Name>brandaris</Name>
<IP4Address>130.37.26.1</IP4Address> </Host>
<RTT>1.068</RTT> <RTT>1.032</RTT> <RTT>1.017</RTT> </Hop>
<Hop index="2"> <Host> <Name>wnxswitch</Name>
<IP4Address>130.37.14.1</IP4Address> </Host>
<RTT>0.551</RTT> <RTT>0.406</RTT> <RTT>0.395</RTT> </Hop>
...
<Hop index="8"> <Host> <Name>das2fs.wins.uva.nl</Name> <IP4Address>146.50.13.20</IP4Address> </Host> <RTT>1.584</RTT> <RTT>2.140</RTT> <RTT>2.226</RTT> </Hop> <TimeStamp>2001-11-25T16.15.20Z</TimeStamp> </Traceroute>
Fig. 3.XML event for traceroute information
Figure 3 shows an example event for the traceroute information, as gath-ered by the topology producers. The traceroute event mainly consists of source and destination host, and of a list of hops, for which the name, IP address, and the measured round-trip times are reported. The XML representation for traceroute data also is easy to understand by humans. Translating the already textual representation of the “raw” data produced by the traceroute sensors into another textual representation has two advantages. First, the very regular XML description is easier to parse by a consumer process. Second, the XML de-scription removes error messages and the (slight) differences in the data formats produced by the traceroute implementations on the various platforms.
3
Topology Consumer Functionality
We have implemented a topology consumer process that queries the producer processes and provides the information in preprocessed form to Grid application programs. The consumer thus takes as input the network topology descriptions and the NWS measurement data (see Figure 1), both in XML form. Our con-sumer process implementation illustrates the capabilities of a Grid monitoring
architecture that integrates both performance and topology information. It sup-ports the development of collective communication libraries like MagPIe [10]. Other application domains may develop consumers tailored for their specific needs.
The consumer computes the overall topology of a Grid by combining the topology (traceroute) results between all respective sites, and transitively re-moving those intermediate nodes with exactly two neighbors – that do not con-tribute to the determination of overlapping paths. In order to cover the potential path asymmetry between pairs of Grid sites, all links in this topology graph are unidirectional.
All links of the precomputed topology are then attributed with latency and bandwidth values. Latency values are taken from the traceroute data. Bandwidth
values are taken from the NWS measurements; for each linkl, the maximum of
the end-to-end bandwidth values of all connections using l is used as the link’s
estimated bandwidth. This computation of individual link bandwidth is a con-servative estimate, as Internet backbone links may provide higher accumulated bandwidth to multiple, simultaneous transmissions. As NWS currently mini-mizes the intrusiveness of its measurements, concurrent measurements across shared links are not provided. We are currently developing a scheme to augment NWS by additionally performing such measurements, where the number of ad-ditional probes can be limited to those paths where links are actually shared, according to the traceroute results.
The consumer process reports its information to application programs and communication libraries like MagPIe. It can provide end-to-end latency and bandwidth, the path between two endpoints, and the shared parts of two paths between two pairs of endpoints. The consumer can also export the graph
con-necting the endpoints to theGraphViz graph visualization package [7], the latter
to support Grid application developers. Figure 4 shows a topology graph between four sites. The endpoints are denoted by shaded boxes. For clarity of presenta-tion, only bandwidth numbers (in Mbit/s) are shown in the figure.
Most importantly, the consumer can also compute (multicast) spanning trees from one endpoint to all other endpoints. As we are interested in application-level communication, only endpoints (Grid sites) can actively forward messages. The consumer process can compute the spanning trees either with minimal latency, or with maximal bandwidth. The former case minimizes the completion time for multicasting a short message to all endpoints, which is mostly independent of the available bandwidth. The latter case optimizes multicast for long messages, which is mostly independent of latency. Computing these spanning trees gener-alizes our work on MPI-style collective communication [9] from homogeneous to heterogeneous Grid networks.
Spanning trees with minimal latency can be computed based on end-to-end latency values only. For short messages, link bandwidth and thus overlapping paths can be ignored. However, for computing spanning trees with maximal
bandwidth, theTopoMonconsumer combines all NWS predictions and
their estimated bandwidth. Based on these annotations, the maximum overall bandwidth from one endpoint to the others, can be computed by applying Di-jkstra’s algorithm to compute a tree of shortest paths, using the reciprocals of the bandwidth values as distance metrics [1].
das3fs.tn.tudelft.nl BR1.Delft.surf.net das0fs.cs.vu.nl AR5.Amsterdam1.surf.net charcoal.cs.ucsb.edu ipls-kscy.abilene.ucaid.edu huron.cs.unh.edu ipls-clev.abilene.ucaid.edu PO10-0.CR1.Amsterdam2.surf.net PO1-0.CR2.Amsterdam2.surf.net AT2-0-4.BR1.Chicago1.surf.net PO5-0.CR1.Amsterdam2.surf.net tudelft-router.Customer.surf.net vu-router.Customer.surf.net ipls-surfnet.abilene.ucaid.edu clev-ipls.abilene.ucaid.edu kscy-ipls.abilene.ucaid.edu 6.0 6.0 6.0 6.5 6.5 6.5 6.5 0.6 0.6 0.6 0.6 0.6 1.4 1.4 1.4 1.4 1.4 1.4 0.6 0.6 0.6 0.6 0.6 0.6
Fig. 4.Topology and link bandwidth (in Mbit/s) derived fromTopoMondata
4
Related Work
Many researchers have found that high-performance Grid applications need to be aware of the interconnection network in use [4, 8, 9, 15, 17]. Performance mon-itoring systems thus are becoming integral parts of Grid computing platforms.
The Global Grid Forum has proposed the GMA architecture [3] that describes the components of monitoring systems and their interactions. In an accompa-nying document [20], an XML-based producer-consumer protocol has been
pro-posed for the GMA.TopoMon follows the GMA structure, and also uses the
XML-based protocol for portability reasons. For TopoMon, we had to define
additional XML schemas for expressing performance and topology information. There exist several monitoring systems for the Internet that either measure network performance [2, 13, 14] or explore network topology [6, 19]. However, their usefulness for Grid applications is limited as they only provide data for the nodes involved in their own monitoring efforts. For our purposes, we need information (topology and performance) about exactly those parts of the global Internet that connect the sites of a Grid environment. While Internet-related tools provide useful monitoring techniques, Grid environments have to apply
them to their own sites.TopoMonintegrates performance and topology
infor-mation for given Grid platforms.
Some systems explore the topology of LAN installations in great detail. Most prominently, Remos [4] uses SNMP to collect the necessary information. How-ever, SNMP is not available for general Internet connections. The BGP [16] routing protocol provides global topology information, however only with the granularity of Autonomous Systems, which is insufficient for our purposes.
The most advanced performance monitoring system for Grids is the Net-work Weather Service (NWS) [23]. However, NWS only provides performance
data between pairs of Grid sites.TopoMonaugments this data with
informa-tion about the topology of the interconnecting networks. Only the combinainforma-tion of both kinds of data allows Grid applications to both predict communication performance and avoid contention between multiple of its own data streams.
Instead of NWS and traceroute, other network sensor tools could be used as well [11, 12, 21]. However, our choice of sensors was determined by low intrusive-ness, widespread availability, and for NWS also by application-level measurement
using TCP streams. Other sensors might easily be integrated into TopoMon
simply by adapting the respective producer process.
5
Conclusions and Future Work
We have presentedTopoMon, a Grid network monitoring tool that integrates
both performance and topology information.TopoMonhas been designed
ac-cording to the GGF monitoring architecture (GMA) to foster interoperability with other Grid services.
The added value of integrating both performance and topology information is that applications or communication libraries can not only predict their communi-cation performance, but can also avoid congestion on those Internet links that are
shared by multiple, simultaneous data streams. TopoMon’s consumer process
computes spanning trees between the sites of a Grid environment that minimize either overall latency (for multicasting short messages) or overall bandwidth (for long messages). This process has been specifically designed to support collective
communication as in our MagPIe library [10]. Other application domains, such as distributed simulations on large data sets, can easily integrate their own con-sumer functionality, to optimally use the existing network resources.
TopoMon currently conservatively underestimates the bandwidth of
net-work links, neglecting the possibly higher backbone bandwidth that might be observed by multiple, simultaneous transmissions. This is a direct consequence of using NWS for network measurements. NWS carefully avoids simultaneous measurements both for minimizing intrusiveness and for accuracy [22]. We are currently working on a scheme to augment NWS to additionally perform con-current measurements that both explores the potential of the Internet backbone and minimizes the necessary, additional measurements. Exploiting the topology of the given network connections is key to this scheme. We are also working on a better graphical representation of the network topology to visualize conflict-ing data streams. Finally, we are augmentconflict-ing our MagPIe library with collective
communication algorithms that exploit the information derived byTopoMon.
Acknowledgements
We would like to thank Rich Wolski and Martin Swany for the lively exchange of ideas about network monitoring. Jason Maassen, Rob van Nieuwpoort, and Guil-leaume Pierre made valuable comments on drafts of this work. The following people kindly granted us access to their systems for performing topology experimentation: Luc Boug´e (ENS Cachan), Edgar Gabriel (HLRS), Sergei Gorlatch (TU Berlin), Phil Hatcher (Univ. of New Hampshire), Thomas Kunz (Carleton Univ.), Ludek Matyska (Masaryk Univ.), Jarek Nabrzysky (PNSC), Steven Newhouse (Imperial College), Guil-laume Pierre (INRIA Rocquencourt), Satoshi Sekiguchi (ETL), Rich Wolski (UCSB).
References
1. R. K. Ahuja, T. L. Magnanti, and J. B. Orlin.Network Flows. Prentice Hall, 1993. 2. Active Measurement Project (AMP). http://amp.nlanr.net.
3. R. Aydt, D. Gunter, W. Smith, M. Swany, V. Taylor, B. Tierney, and R. Wolski. A Grid Monitoring Architecture. Global Grid Forum, Performance Working Group, Grid Working Document GWD-Perf-16-1, 2001.
4. P. Dinda, T. Gross, R. Karrer, B. Lowekamp, N. Miller, P. Steenkiste, and D. Sutherland. The Architecture of the Remos System. In IEEE Symposium on High Performance Distributed Computing (HPDC10), San Francisco, CA, 2001. 5. I. Foster and C. Kesselman. Globus: A Metacomputing Infrastructure Toolkit.Int.
Journal of Supercomputer Applications, 11(2):115–128, 1997.
6. P. Francis, S. Jamin, C. Jin, Y. Jin, D. Raz, Y. Shavitt, and L. Zhang. IDMaps: A Global Internet Host Distance Estimation Service. IEEE/ACM Transactions on Networking, 2001.
7. E. R. Gansner, E. Koutsofios, S. C. North, and K.-P. Vo. A Technique for Drawing Directed Graphs. IEEE Trans. of Software Engineering, 19(3):214–230, 1993.
8. N. T. Karonis, B. R. de Supinski, I. Foster, W. Gropp, E. Lusk, and J. Bresnahan. Exploiting Hierarchy in Parallel Computer Networks to Optimize Collective Opera-tion Performance. InInternational Parallel and Distributed Processing Symposium (IPDPS 2000), pages 377–384, Cancun, Mexico, May 2000. IEEE.
9. T. Kielmann, H. E. Bal, S. Gorlatch, K. Verstoep, and R. F. H. Hofman. Network Performance-aware Collective Communication for Clustered Wide Area Systems. Parallel Computing, 27(11):1431–1456, 2001.
10. T. Kielmann, R. F. H. Hofman, H. E. Bal, A. Plaat, and R. A. F. Bhoedjang. Mag-PIe: MPI’s Collective Communication Operations for Clustered Wide Area Sys-tems. InSymposium on Principles and Practice of Parallel Programming (PPoPP), pages 131–140, Atlanta, GA, May 1999.
11. B. A. Mah. pchar. http://www.caida.org/tools/utilities/others/pathchar/. 12. Pathrate. http://www.pathrate.org/.
13. V. Paxson, J. Mahdavi, A. Adams, and M. Mathis. An Architecture for Large-scale Internet Measurement. IEEE Communications, 1988.
14. PingER. http://www-iepm.slac.stanford.edu/pinger/.
15. A. Plaat, H. E. Bal, R. F. Hofman, and T. Kielmann. Sensitivity of Parallel Applications to Large Differences in Bandwidth and Latency in Two-Layer Inter-connects. Future Generation Computer Systems, 17(6):769–782, 2001.
16. Y. Rekhter and T. Li. A Border Gateway Protocol 4 (BGP-4). IETF Network Working Group, RFC 1771, 1995. http://www.faqs.org/rfcs/rfc1771.html. 17. G. Shao, F. Berman, and R. Wolski. Using Effective Network Views to Promote
Distributed Application Performance. InParallel and Distributed Processing Tech-niques and Applications (PDPTA), 1999.
18. R. Siamwalla, R. Sharma, and S. Keshav. Discovering Internet Topology. InIEEE INFOCOM, 1999.
19. Skitter. http://www.caida.org/tools/measurement/skitter.
20. W. Smith, D. Gunter, and D. Quesnel. A Simple XML Producer-Consumer Pro-tocol. Global Grid Forum, Performance Working Group, Grid Working Document GWD-Perf-8-2, 2001.
21. Sprobe. http://sprobe.cs.washington.edu/.
22. M. Swany and R. Wolski. Topology Discovery for the Network Weather Service. Submitted for publication.
23. R. Wolski, N. Spring, and J. Hayes. The Network Weather Service: A Distributed Resource Performance Forecasting Service for Metacomputing.Future Generation Computing Systems, 15(5–6):757–768, 1999.