SI: EPIGENETICS OF AGING
A longitudinal study of DNA methylation as a potential
mediator of age-related diabetes risk
Crystal D. Grant&Nadereh Jafari&Lifang Hou&Yun Li&James D. Stewart& Guosheng Zhang&Archana Lamichhane&JoAnn E. Manson&Andrea A. Baccarelli& Eric A. Whitsel&Karen N. Conneely
Received: 16 July 2017 / Accepted: 2 November 2017 / Published online: 20 November 2017
#American Aging Association 2017
Abstract DNA methylation (DNAm) has been found to show robust and widespread age-related changes across the genome. DNAm profiles from whole blood can be used to predict human aging rates with great accuracy. We sought to test whether DNAm-based pre-dictions of age are related to phenotypes associated with type 2 diabetes (T2D), with the goal of identifying risk factors potentially mediated by DNAm. Our participants
were 43 women enrolled in the Women’s Health Initia-tive. We obtained methylation data via the Illumina 450K Methylation array on whole blood samples from participants at three timepoints, covering on average 16 years per participant. We employed the method and software of Horvath, which uses DNAm at 353 CpGs to form a DNAm-based estimate of chronological age. We then calculated the epigenetic age acceleration, orΔage, https://doi.org/10.1007/s11357-017-0001-z
Electronic supplementary material The online version of this article (https://doi.org/10.1007/s11357-017-0001-z) contains supplementary material, which is available to authorized users.
C. D. Grant (*)
Genetics and Molecular Biology Graduate Program, Emory University, Atlanta, GA, USA
e-mail: [email protected]
C. D. Grant
:
K. N. ConneelyDepartment of Human Genetics, School of Medicine, Emory University, Atlanta, GA, USA
N. Jafari
Center for Genetic Medicine, Feinberg School of Medicine, Northwestern University, Chicago, IL, USA
L. Hou
Department of Preventive Medicine, Feinberg School of Medicine, Northwestern University, Chicago, IL, USA
L. Hou
Robert H. Lurie Comprehensive Cancer Center, Feinberg School of Medicine, Northwestern University, Chicago, IL, USA
Y. Li
:
G. ZhangDepartment of Genetics, School of Medicine, University of North Carolina, Chapel Hill, NC, USA
Y. Li
Department of Biostatistics, Gillings School of Global Public Health, University of North Carolina, Chapel Hill, NC, USA
Y. Li
Department of Computer Science, University of North Carolina, Chapel Hill, NC, USA
J. D. Stewart
Carolina Population Center, University of North Carolina, Chapel Hill, NC, USA
A. Lamichhane
Environmental Health Sciences, RTI International, Research Triangle Park, NC, USA
A. Lamichhane
at each timepoint. We fit linear mixed models to char-acterize howΔagecontributed to a longitudinal model of aging and diabetes-related phenotypes and risk factors. For most participants,Δageremained constant, indicat-ing that age acceleration is generally stable over time. We found that Δage associated with body mass index (p = 0.0012), waist circumference (p = 0.033), and fasting glucose (p= 0.0073), with the relationship with BMI maintaining significance after correction for mul-tiple testing. Replication in a larger cohort of 157 WHI participants spanning 3 years was unsuccessful, possi-bly due to the shorter time frame covered. Our results suggest that DNAm has the potential to act as a mediator between aging and diabetes-related phenotypes, or al-ternatively, may serve as a biomarker of these phenotypes.
Keywords Aging . diabetes . DNA methylation . BMI . biomarker . biological age
Introduction
Worldwide, the population aged 65 years and older is growing rapidly, with a 150% expansion projected over the next few decades (He et al. 2016). Despite these recent global gains in life expectancy, age-related dis-ease burden and the incidence of chronic disabilities remain high (Burch et al. 2014). The healthspan, or years spent in good health, among the aging population remains highly variable, with some maintaining good health throughout their lives while others fall ill (Kennedy et al. 2014). Age itself is the leading risk factor for the development of most diseases and condi-tions that drive morbidity and mortality and contribute to limited healthspan (Kaeberlein et al.2015; Kennedy
et al.2014). In many countries, age-related diseases like cardiovascular disease, diabetes, cancer, and neurodegen-erative disorders are among the predominant health prob-lems faced by the population (Niccoli and Partridge2012). A particularly widespread age-related disease adverse-ly impacting the healthspan of millions worldwide is type 2 diabetes (T2D), which is now considered a global epidemic (International Diabetes Federation2015). Due to population growth, increased longevity, and urbaniza-tion (which can promote physical inactivity and an un-healthy diet) (Hu 2011), the global burden of T2D is expected to worsen over time as the prevalence increases from 415 million living with the disease in 2015 to an estimated 642 million in 2040 (International Diabe-tes Federation2015; Shaw et al.2010). There are many well-documented risk factors associated with the devel-opment of T2D, including weight gain (Ford et al.1997), high body mass index (BMI) (Chan et al. 1994), high waist circumference (Koh-Banerjee et al.2004), ethnicity (Shai et al.2006), smoking status (Hu et al.2001), high fasting glucose (Nathan et al.2007), high fasting insulin (Weyer et al.2000), and age (Mokdad et al.2003; Stamler et al. 1993). Diabetes contributed to approximately 5 million deaths globally in 2015 (International Diabe-tes Federation2015) and is itself a risk factor for numer-ous other comorbidities. Globally, ~ 50% of diabetic individuals are unaware of their condition, and subse-quently are unaware of their increased risk of diabetes-related complications. Thus, a better marker of early T2D risk could provide mechanistic insights and facilitate earlier identification of high-risk individuals most likely to benefit from targeted lifestyle interventions (Interna-tional Diabetes Federation2015).
Differential susceptibility to age-related diseases can be attributed to biological differences between individ-uals, which work to modify disease risk (reviewed in Feinberg2007). Among these biological differences are epigenetic changes, which arise without changes to the underlying DNA sequence and have the potential to modify disease risk through their regulatory influence on gene expression (Goldberg et al.2007). Additionally, because the major risk factors for T2D are lifestyle factors, such as diet and exercise behavior (Pan et al.
1997), an epigenetic mechanism in which these factors can modify underlying genetic predisposition to disease incidence is highly plausible. DNA methylation (DNAm), the presence of a methyl group on the cyto-sine within a CpG dinucleotide, is the most studied epigenetic modification. The robust and genome-wide J. E. Manson
Department of Medicine, Brigham and Women’s Hospital, Harvard Medical School, Boston, MA, USA
A. A. Baccarelli
Department of Environmental Health Sciences, Mailman School of Public Health, Columbia University, New York, NY, USA
E. A. Whitsel
Department of Epidemiology, Gillings School of Global Public Health, University of North Carolina, Chapel Hill, NC, USA
E. A. Whitsel
changes to DNAm observed with age make it an ideal biomarker of aging (Alisch et al. 2012; Bollati et al.
2009; Christensen et al.2009; Teschendorff et al.2010; Xu and Taylor2014). Biomarkers of aging are indica-tors of the biological age of an organism that predict its physiological functioning and disease susceptibility bet-ter than its chronological age alone (Baker and Sprott
1988; Johnson 2006). Recently, highly accurate bio-markers of aging have been developed that capitalize on age-related changes to DNAm at a subset of CpGs across the genome to predict chronological age (Hannum et al.2013; Horvath2013). The approach of Horvath (Horvath2013) uses methylation data from just 353 CpGs to form a multi-tissue, DNAm-based estimate of chronological age (DNAm age). Using DNAm age as a measure of biological age, the difference between a participants’DNAm age and their chronological age can be calculated. This measure is termed the participants’ epigenetic age acceleration (Δage) and may proxy for the general health or rate of aging of the individual (Horvath
2013). Instances in which the Δage term is positive indicate an epigenetic age that is higher than the partic-ipant’s chronological age.
Many studies support the hypothesis that epigenetic
Δage is associated with negative health outcomes, in-cluding increased risk of premature mortality (Chen et al. 2016; Christiansen et al. 2016; Marioni et al.
2015a; Perna et al.2016; Zheng et al.2016), early onset of age-related disease (Breitling et al.2016; Levine et al.
2015), and changes in physical and cognitive fitness (Marioni et al.2015b). These findings indicate thatΔage contributes more predictive information about these health outcomes than chronological age alone. This is consistent with the possibility thatΔagemay be acting to mediate the health outcome or risk of disease onset, but also with the possibility that DNAm age may be mark-ing another biological process that is actmark-ing as a medi-ator. Consistent with the adverse health outcomes asso-ciated with positiveΔage, a negativeΔage can predict positive outcomes: centenarians in an Italian population and their offspring tended to have a DNAm age that was lower than their chronological age (Horvath et al.2015). Taken together, these results support that epigenetics can be important in predicting both negative health outcomes and healthy aging.
Previous studies (Hidalgo et al.2014; Nilsson et al.
2014; Ronn and Ling2015) have reported associations between site-specific methylation differences and T2D as well as related phenotypes across several cell types
and tissues. Our study aims to assess the potential of 5mC as a mediator between aging and age-related T2D risk phenotypes. To model age-related 5mC patterns, we focus on a well-studied methylation-based biomarker of aging (Horvath2013) which identified 353 CpG sites as being the most predictive in modeling chronological age. We take advantage of a longitudinal study spanning 16 years to (1) characterize the changes to participants’
Δageover time, and (2) characterize the contribution of DNAm age andΔagein modeling T2D susceptibility. Given that many T2D risk factors (including high BMI, waist circumference, and fasting glucose and insulin levels) reflect age-related changes, a measure of biolog-ical aging may help predict which participants are at a higher risk of T2D incidence throughout the study. Though we do not have the power to model incidence of clinical T2D in our sample, the longitudinal nature of this study allows us to model changes to phenotypes intermediate between age and disease risk. We will use the DNAm-based measure of biological age as a proxy for genome-wide DNAm and other age-related biolog-ical processes that may underlie age-related disease risk. We aim to inform future studies by assessing the utility of genome-wide methylation changes and other biolog-ical processes as potential mediators between age and risk factors for and indicators of T2D (subsequently referred to asBdiabetes-related phenotypes^).
Methods
Study population and study design
Participants are a subsample from the 68,132 women who took part in the Women’s Health Initiative (WHI) Clinical Trials (CT) Cohort. The WHI was a national study which sought to investigate interventions and treat-ments for the prevention and management of common causes of morbidity and mortality among older women (The Women’s Health Initiative Study Group1998). All WHI participants were post-menopausal women, aged 50 to 79 years at the time of enrollment, with minority women recruited at the same proportion found in the US population at the time (Hays et al.2003). Women in the WHI were also more likely to be overweight, with three quarters of the women overweight or obese at the time of enrollment (Hays et al.2003).
information (including their age and race), current health behaviors (including weekly physical activity and smoking behavior), and current health status (any disease diagnosis and medications or supplements cur-rently prescribed). Participants also attended scheduled clinic visits in which anthropometric measurements were assessed, including the following: weight, height, and waist circumference; from these measures, body mass index was calculated. Additionally, a 6% minority oversample of participants had blood drawn during these clinic visits from which insulin, glucose, triglyc-eride, and high-density lipoprotein cholesterol concen-trations were measured and buffy coat was archived.
BEpigenetic Mechanisms of PM-Mediated CVD Risk^ (WHI-EMPC) measured DNAm on a genome-wide scale using DNA extracted from the archived buffy coat in a stratified, random sample (N = 2200) of the partic-ipants who were examined between 1993 and 2001. Among a subset (N = 200) of the 2200 participants, WHI-EMPC also measured DNAm in buffy coat ar-chived at a second timepoint on average 3.3 years later. Subsequently, aBLongitudinal Study of DNA Methyla-tion as a Mediator between Age and Cardiovascular Risk^ (AS #534) measured DNAm in buffy coat ar-chived at the third timepoint, on average 16.1 years after the first, for a subset (N = 43) of the 200 participants who were followed up as part of the Long Life Study (LLS). These 43 participants are included in our study and described in Table1.
Data cleaning
Chronological age of the participants was approximated at each timepoint as participant’s self-reported age at screening (in years) + 0.5 + number of days between screening and blood sampling / 365.25. Phenotypic measures include the following: BMI measured as weight (kg) divided by the square of height (m2), waist circumference (cm), fasting glucose (mg/dL), and fasting insulin (μIU/mL). Homeostasis Model Assess-ment of Insulin Resistance, termed HOMA-IR, was calculated using the following equation: Insulin (μU/ mL) × Glucose (mg/dL) / 405 (Yokoyama et al.2003). The ratio of plasma triglycerides (mg/dL) to high-density lipoprotein cholesterol concentration (mg/dL), termed TG/HDL-C ratio, was calculated (McLaughlin et al. 2003). Lastly, the triglyceride-glucose index, termed the TyG index, was calculated using the follow-ing equation: ln[Triglycerides / (Fastfollow-ing glucose / 2)]
(Simental-Mendía et al. 2008). Both TG/HDL-C and TyG were included as markers of insulin resistance.
with daily intake less than 600 kcal or greater than 3500 kcal) were excluded (N = 2) (Patterson et al.
1999). In characterizing family history, participants were asked:BDid your mother, or father, or full-blooded sis-ters, full-blooded brothers, daughsis-ters, or sons ever have sugar diabetes or high blood sugar that first appeared as an adult?^Participants’responses were as follows:BYes^ (11 participants),BNo^(31 participants), orBUnsure^(1 participants). For the model, participants who answered either BNo^ or BUnsure^ were combined into BNo or Unsure.^ Incident diabetes and incident diabetes treat-ment occurring within the study period were also char-acterized as part of the sensitivity analysis. Incident dia-betes was defined, according to standards set by the American Diabetes Association (Association2016), as anyone who fasted for eight or more hours and has a glucose measure≥126 mg/dL, or anyone who fasted for fewer than 8 h and has a glucose measure≥200 mg/dL (4 participants). Timepoints occurring after a participant indicated they were prescribed medication to treat diabe-tes were considered incident treatment with an antidia-betic agent (4 participants).
DNA methylation data
DNA was extracted from buffy coat from participants at each timepoint. DNA (500 ng) was used for the bisulfite conversion with the EZ-96 DNA Methyla-tion Kit (Zymo Research, Irvine, CA, USA),
following the manufacturer’s protocol. Once convert-ed and amplificonvert-ed, DNA (15μL) was fragmented, and hybridized to the Infinium HumanMethylation450 Bead Chip (Illumina Inc., CA, USA). DNAm profiles of > 485,000 cytosine-guanine (CpG) sites were mea-sured using the Infinium HumanMethylation450 BeadChip at the Northwestern University Genomics Core Facility in two batches, with the first two timepoints run as part of WHI-EMPC and the third run as part of AS #534. DNA methylation was sub-ject to quality controls: excluding probes targeting CpG sites on the Y chromosome, probes with detec-tion p values > 0.01 in > 10% of samples, and samples with detection p values > 0.01 across in > 1% of probes; 484,220 CpG sites passed this qual-ity control step and were eligible for further analysis. Two control DNA samples on each BeadChip were used to assess reproducibility, and duplicates from the first batch were run with the second to account for batch effects. Methylated (M) and unmethylated (U) signals were used to compute estimates of the methylation proportion,β-values, (β= M/(U + M)). Next, beta-mixture quantile normalization (BMIQ) was performed to reduce technical variation and intra-array bias between differing types of probes (Teschendorff et al. 2013). Lastly, ComBat, which employs an empirical Bayes method to adjust for batch effects, was used to adjust for differences be-tween the two batches (Leek et al.2012).
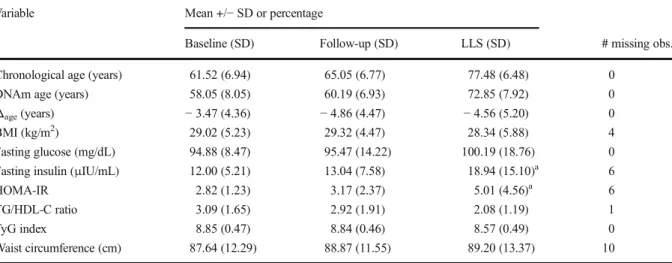
Table 1 Demographic and clinical characteristics of study population (N= 43)
Variable Mean +/−SD or percentage
Baseline (SD) Follow-up (SD) LLS (SD) # missing obs.
Chronological age (years) 61.52 (6.94) 65.05 (6.77) 77.48 (6.48) 0
DNAm age (years) 58.05 (8.05) 60.19 (6.93) 72.85 (7.92) 0
Δage(years) −3.47 (4.36) −4.86 (4.47) −4.56 (5.20) 0
BMI (kg/m2) 29.02 (5.23) 29.32 (4.47) 28.34 (5.88) 4
Fasting glucose (mg/dL) 94.88 (8.47) 95.47 (14.22) 100.19 (18.76) 0 Fasting insulin (μIU/mL) 12.00 (5.21) 13.04 (7.58) 18.94 (15.10)a 6
HOMA-IR 2.82 (1.23) 3.17 (2.37) 5.01 (4.56)a 6
TG/HDL-C ratio 3.09 (1.65) 2.92 (1.91) 2.08 (1.19) 1
TyG index 8.85 (0.47) 8.84 (0.46) 8.57 (0.49) 0
Waist circumference (cm) 87.64 (12.29) 88.87 (11.55) 89.20 (13.37) 10
a
Measures of DNA methylation age andΔage
DNAm age at each timepoint was calculated using the methylation profiles from 353 CpGs and the R pipeline detailed in Horvath (2013). The difference between DNAm predicted age and the chronological age of each participant at each of the three timepoints, termedBage acceleration^(Δage), was calculated at each point.
Testing for association between age and DNA methylation
Using the R package CpGassoc (Barfield et al. 2012), we performed an epigenome-wide association study (EWAS) to test for association between chronological age and DNAm. For each CpG site, we fit a linear mixed model that included a random effect for each participant to account for the repeated measures within participants, and self-reported ethnicity and Illumina chip and row as covariates.
Testing for association betweenΔage and diabetes-related phenotypes
Phenotypes analyzed included seven diabetes-related phenotypes: fasting insulin and glucose, HOMA-IR, BMI, waist circumference, TG/HDL-C ratio, and TyG index. Using the R package nlme (Pinheiro et al. 2016), we fit longitudinal, mixed effect models with the phenotype as the outcome and a random effect for participants. For each phenotype, two models were fit: the first regressed each phenotype on chronological age and relevant covariates, while the second regressed each pheno-type on both chronological age and Δage, in addi-tion to other covariates. Our goal was to assess whether the additional term Δage associates inde-pendently with the phenotype, indicating that Δage contributes to our ability to model the phenotype. Thus, for participant (i) at timepoint (j), the fol-lowing models were fit:
Model 1:
Diabetes−relatedphenotypeij
¼β0þβ1ageijþβ2ethnicityiþβ3smokingi
þβ4fasting hoursijþνiþεij
Model 2:
Diabetes−relatedphenotypeij
¼β0þβ1ageijþγΔageijþβ2ethnicityi
þβ3smokingiþβ4fasting hoursijþνiþεij
whereΔageijrepresents age acceleration for
individu-aliat timej,νirepresents a random effect
(individual-specific error term) for individuali, andεijrepresents the
error term for individualiand timepointj. Significance of the age acceleration coefficientγin the second model was taken to suggest that the relationship between chro-nological age and that phenotype could potentially be mediated by methylation or a related biological process, or thatΔagecould serve as a biomarker for this pheno-type. To adjust for potential confounding, ethnicity, cigarette smoking, and fasting hours (where relevant) were included as covariates. Sensitivity analysis were performed with several well-known T2D risk factors added individually as covariates, including total energy expenditure, total caloric intake, alcohol intake, and family history of diabetes.
Estimation of blood cell proportions based on DNA methylation
A complication in analysis of whole blood samples in aging studies is that cell proportions in whole blood change with age (Fagnoni et al.2000; Houseman et al.
covariates in the comparisons of Models 1 and 2, with granulocyte proportions excluded as the reference category.
Testing for change inΔageover time
A mixed effects model, with the year of the participant’s clinic visit as a fixed effect and a random effect for participants, was used to test whether there was signif-icant change inΔageover time.
Results
Sample characteristics
The sample characteristics of our population are detailed in Table1. Participants were 43 post-menopausal wom-en, between 50 and 76 years of age at enrollment, with a mean age of 61.5 years (sd = 6.9). A plurality of our sample was non-Hispanic White (41.9%), about a third were African American (32.6%), and about a quarter were Hispanic or Latino (25.6%). Self-reported smoking behavior indicated that 23 participants (54.8%) were either current or previous smokers; 19 participants report having never smoked (45.2%), while one participant failed to respond. Longitudinal DNAm data were available for three timepoints with the second and third timepoints occurring on average 3.3 and 16.1 years after the first, respectively. At baseline, none of the participants were being treated for diabetes. The distributions of the seven diabetes-related phenotypes in our population are shown in Supplementary Fig.1.
DNA methylation changes with chronological age
Using DNAm array data, we performed a longitudinal epigenome-wide association study as proof of concept that many CpGs display differential methylation associ-ated with participants’estimated chronological ages, a pattern which has been well-established in many other datasets (e.g., Alisch et al. 2012; Bollati et al. 2009; Christensen et al. 2009; Teschendorff et al. 2010; Xu and Taylor2014). In our data, 232 sites showed signif-icant changes with age according to the Holm step-down Bonferroni procedure (p < 1.0E − 7), while 3064 sites were found significant by the Benjamini– Hochberg procedure (FDR < .05). Top CpGs are listed in Supplementary Table 1. Supplementary Fig. 2
features a Manhattan plot of p values reflecting the association between methylation and chronological age. Our results appear consistent with those reported by Xu and Taylor (2014), who identified 749 high confidence age-related CpGs in > 1000 individuals. Supplementary Fig.3 demonstrates a high correlation (r = 0.74) between t-statistics across the two studies. Additionally, 11 of our significant sites overlap with the 353 CpGs that make up the epigenetic clock (Horvath
2013).
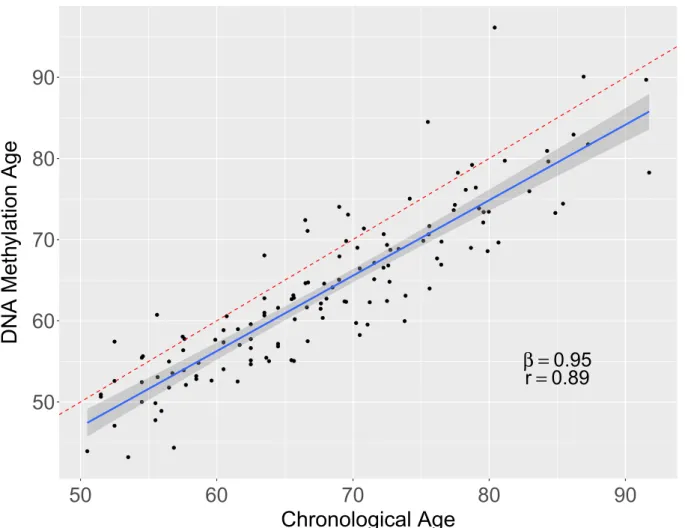
DNA methylation age estimates over time
Participants’chronological ages show high correlation with their predicted DNAm ages (r= 0.89) (Fig.1). The difference between this predicted age and the chrono-logical age of each participant at each of the three timepoints, termed Δage, is calculated at each point. DNAm age at enrollment ranges from 43.2 to 84.5, while Δage, at enrollment ranges from− 12.3 to 9.0. The medianΔagevalue across participants is−4.5.Δage is negative for 109 of the 129 measurements (84.5%), which is consistent with previous reports showing that women tend to have lower Δage than men (Hannum et al. 2013; Horvath et al.2016). The averageΔageat the first timepoint is−3.5 (sd = 4.4),−4.9 (sd = 4.5) at the second timepoint, and−4.6 (sd = 5.2) at the third timepoint (Table1, Supplementary Fig.4). According to a Shapiro-Wilk normality test,Δageis normally distrib-uted at timepoints 1 (p= 0.16) and 2 (p= 0.87), but not timepoint 3 (p= 0.0033). However, with the removal of a single individual with an extreme Δage, values for timepoint 3 are consistent with a normal distribution (p= 0.94).
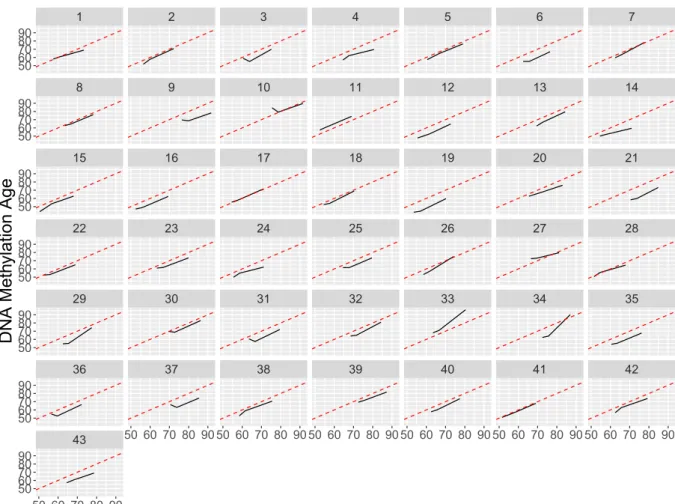
Stability ofΔage
Within individuals, very little change inΔageis ob-served over time, suggesting that the value of age acceleration remains roughly constant over time among our participants (Fig. 2). On average, Δage showed a 0.041 decrease each year, which does not differ significantly from a change of zero (p= 0.25) (Supplementary Fig. 6). To identify individuals whose Δage changed significantly during the study, each of the 43 participants’DNAm age was regressed on their chronological age. The mean slope of this
regression was close to 1 (mean = 0.96, SD = 0.29), suggesting that on average, DNAm age increases at a similar rate to chronological age. Five participants (10, 26, 27, 33, and 34) were at least 1.5 standard deviations from the mean, with slope values of 0.46, 1.41, 0.52, 1.71, and 2.02, respectively. To assess whether these changes in Δagecould be influenced by changes in blood cell proportions, we regressed each of six estimated cell type proportions onto the year of the participant’s visit, and found that cell proportions did not change significantly over the course of the study (Supplementary Fig.7).
β =
0.95
r
=
0.89
50
60
70
80
90
50
60
70
80
90
Chronological Age
DNA Meth
ylation Age
Fig. 1 Chronological Age (x-axis) vs. DNA methylation Age (y-axis). Each point shows chronological age and DNAm age for one participant at one of the three timepoints. The dotted red line represents the equivalence line, meaning there would be perfect agreement between the computed DNAm age and the
DNAm age acceleration associates with several diabetes-related phenotypes
Results from our models of diabetes-related pheno-types are listed in Table 2. Δage has a signifi-cant positive association with fasting glucose (p = 0.0073), BMI (p = 0.0012), and waist circum-ference (p = 0.033). Using a Bonferroni-correctedα of 0.0071 to adjust for the seven phenotypes tested, the association remains significant for BMI and nea r-signific ant for glucose . To asse ss the
robustness of our results to inclusion of covariates, we performed sensitivity analyses that added the following covariates to the model: alcohol intake, total caloric intake, family history of diabetes, inci-dent diabetes during follow-up, and inciinci-dent treat-ment with antidiabetic agents. Suppletreat-mentary Ta-ble 2 shows that the addition of each covariate produces similar results to our baseline model. Fur-thermore, inclusion of a covariate for participants taking medication for incident diabetes suggests that, in addition to Δage contributing significantly
43
36 37 38 39 40 41 42
29 30 31 32 33 34 35
22 23 24 25 26 27 28
15 16 17 18 19 20 21
8 9 10 11 12 13 14
1 2 3 4 5 6 7
50 60 70 80 90
50 60 70 80 90 50 60 70 80 90 50 60 70 80 90 50 60 70 80 90 50 60 70 80 90 50 60 70 80 90 50
60 70 80 90
50 60 70 80 90
50 60 70 80 90
50 60 70 80 90
50 60 70 80 90
50 60 70 80 90
50 60 70 80 90
Chronological Age
DNA Meth
ylation Age
Fig. 2 Chronological Age (x-axis) vs. DNA methylation Age (y-axis) for each participant. Each subplot represents one participant; a solid black line connects the participants’three measures ofΔage across the three timepoints. The dotted red line represents a line of slope = 1, reflecting perfect agreement between DNAm age and chronological age. A participant’s black line being nearly parallel
to modeling of BMI, it also contributes significant-ly (p < .0071) to modeling fasting glucose among our participants.
Supplementary Fig. 8 reflects measurements of BMI over the 16-year study period for our partici-pants. Of the five participants with extreme Δage slope values, three participants (10, 34, and, to a lesser extent, 27) also had extreme changes in BMI during the study. This BMI fluctuation could, per-haps, be linked to changes in DNAm and Δage. To test whether the relationship between Δage and BMI, fasting glucose, and waist circumference were driven by these five participants, we removed them in a sensitivity analysis. Supplementary Table 3
includes the results of this analysis in which it appears that our findings are driven by the partici-pants with dynamic Δage, since the effect sizes decrease substantially upon their removal compared to the original results in Table 2. This loss of an association with the removal of the most dynamic participants suggests that the association may be driven by within-person changes in Δag e and BMI, rather than static differences between individuals.
Replication study in a second WHI subsample
A subset of 200 women from a stratified, random sam-ple of 2200 WHI-CT participants had two DNAm mea-surements assessed as part of WHI-EMPC. Our 43 participants with three DNAm timepoints are part of
this subset of 200; we attempt to replicate our findings in the remaining 157 participants who had two DNAm timepoints on average 3.7 years apart. The replication cohort’s ethnic make-up is fairly similar to our partici-pants, with 55.4% non-Hispanic, White, 19.6% Black or African American, 15.92% Hispanic/Latino, 4.46% Asian or Pacific Islander, 3.18% American Indian or Alaska Native, and 1.27% Other. Smoking behavior had a high rate of missingness (85.7% of participants did not provide data on their smoking habits), and thus was not included in regression models. The sample characteris-tics of our replication population are detailed in Supple-mentary Table 4. The replication cohort mirrored our finding of female participants having lower DNAm age than their chronological age (meanΔageis−4.30 years in our data and−3.87 in the replication cohort). How-ever, while the correlation betweenΔageand chronolog-ical age was not significant in our analysis of 43 partic-ipants (r = − 0.14, p = 0.13), analysis of this larger sample yielded a significant negative correlation (r=−0.20,p= 3.9E−6, Supplementary Fig.9).
Results of the regression of diabetes-related pheno-types on age and Δage are shown in Supplementary Table5. We found thatΔagedid not contribute signifi-cantly to models of our seven diabetes-related pheno-types in our replication group. To test whether the sig-nificant findings in the original dataset were due to its longer timespan relative to the replication data, we cen-sored the original dataset so that only the first two timepoints were included in the regression. In Supple-mentary Table 6, we see that the originally reported Table 2 Multivariate regression analysis of diabetes-related phenotypes on age and biological age acceleration
Phenotype Model 1
Coefficients on chronological age
Model 2
Coefficients on chronological age
Model 2
Coefficients onΔage
Est. (SE) pvalue Est. (SE) pvalue Est. (SE) pvalue
BMI −0.046 (0.030) 0.13 −0.032 (0.029) 0.27 0.29 (0.087) 0.0012* Fasting glucose 0.24 (0.14) 0.081 0.30 (0.13) 0.027 0.97 (0.34) 0.0073 Fasting insulin 0.28 (0.10) 0.0078 0.30 (0.10) 0.0050* 0.26 (0.24) 0.28 HOMA-IR 0.084 (0.028) 0.0043* 0.091 (0.029) 0.0022* 0.089 (0.065) 0.18 TG/HDL-C ratio −0.051 (0.015) 0.0013* −0.048 (0.016) 0.0029* 0.048 (0.040) 0.24 TyG index −0.014 (0.0045) 0.0023* −0.013 (0.0046) 0.0055* 0.021 (0.012) 0.073 Waist circumference 0.10 (0.077) 0.18 0.13 (0.076) 0.082 0.48 (0.22) 0.033
associations with BMI and glucose disappear when only two timepoints are used, marked by a substantial drop in the estimated effect size. This suggests that these results may depend on the ability to observe individual changes over a sufficiently long time period.
Discussion
This study supports previous findings on the utility of DNAm-based biomarkers of age in modeling health outcomes. We analyzed longitudinal DNAm data in order to capture the relationship between participants’ changes in DNAm age over time and diabetes-related phenotypes. We found that age acceleration contributes significantly to models of diabetes-related phenotypes among our 43 participants. Epigenetic age acceleration is positively associated with longitudinal changes in participants’body mass index. Additionally, epigenetic age acceleration shows a suggestive association with longitudinal changes to participants’glucose, narrowly missing our Bonferroni cutoff for significance. Glucose does in fact reach significance in our sensitivity analysis in which a covariate for incident T2D treatment is included (p= 0.0054). This indicates that age accelera-tion may contribute to longitudinal models of fasting glucose and that more research should be done with a larger sample. Age acceleration does not appear to sig-nificantly contribute to longitudinal models of waist circumference, insulin, HOMA-IR measurements, TG/ HDL-C ratio, or TyG index. These findings give us leads into which aspects of diabetes-related phenotypes may feature an important epigenetic component. The utility of epigenetic-based biomarkers is that they can offer a more personalized model of an individual’s health status than age alone, though this may not be true for all phenotypes. This is evident in the result thatΔage contributes to models of BMI and fasting glucose but that chronological age appears to be a better predictor of fasting insulin, HOMA-IR, TG/HDL-C ratio, and TyG index.
An intriguing finding is that, for most of our partic-ipants, a DNAm-based measure of age acceleration remains stable over the course of the study. This indi-cates that participants who displayed accelerated biolog-ical age at the start of the study were likely to display the same degree of epigenetic age acceleration 16 years later. The dynamics of Δage over time have not been extensively characterized, but this observed stability of
Δageover time among adults is consistent with findings in previous longitudinal studies of age acceleration (Kananen et al.2016; Marioni et al.2015b). Addition-ally, we found thatΔageexhibits a negative correlation with chronological age, which is consistent with previ-ous reports (Chen et al.2016; Christiansen et al.2016; Marioni et al. 2015b). While this relationship was not significant in our initial sample, it reaches significance in our larger replication cohort. While this could suggest a non-linear relationship between DNAm age and chro-nological age over the life course,Δagedid not change significantly over time for the majority of individuals in our study. Thus, the negative correlation appears to result from between-individual differences, and may reflect a selection bias due to biologically Byounger^ individuals being more likely to survive to old age (Christiansen et al.2016).
A recent study reported that Hispanic/Latinos from the WHI feature a significantly lower epigenetic age acceleration compared to Caucasians (Horvath et al.
2016). In our study, Hispanic/Latinos also featured a lowerΔagecompared to Caucasians and African Amer-icans, but this was not significant due to our small sample size. Additionally, our findings, that Δage did not associate significantly with several diabetes-related phenotypes, have been corroborated by another study of
Δageamong WHI participants; however, in contrast to our findings, this study did not find a significant asso-ciation betweenΔageand BMI or glucose (Horvath et al.
2016). Reasons for this difference could lie in our use of longitudinal data over 16 years, while most previous studies of epigenetic age acceleration have relied on cross-sectional data.
associations between age acceleration and diabetes-related phenotypes noted in our 16-year study.
Longitudinal studies provide a powerful means to identify phenotypic changes associated with within-person changes in DNA methylation, while avoiding potential confounding due to between-person differences. Sensitivity analyses revealed that our observed associa-tion between BMI and Δage was driven by within-individual differences in the participants with the most dynamicΔageand BMI over the time period studied. We also noted thatΔagewas relatively stable over time for most individuals. Based on these observations, to maxi-mize within-person variation in predictors and pheno-types, future longitudinal studies of DNAm and age-related phenotypes should strive to focus on the age ranges that are most dynamic with respect to the pheno-types of interest, and incorporate the widest possible study duration within the relevant age range. In addition, a previous finding that events like menopause can accel-erate biological aging in blood (Levine et al.2016) imply that perhaps studies of DNAm and/or biological aging could benefit from focusing on post-menopausal women. Our study had several limitations. Our population of only post-menopausal women potentially limits the gen-eralizability of our findings. More research into the contribution of Δage to health outcomes in both men and women, and in participants across different age groups is necessary. Furthermore, a disproportionally high number of participants enrolled in the WHI are obese, potentially limiting generalizability to non-obese populations. Additionally, data on smoking be-havior, alcohol consumption, exercise habits, and eth-nicity were self-reported and thus could be biased, po-tentially affecting our results. Data on time spent exercising per week was unavailable for the third timepoint, and was thus not included in our models. Because physical activity is known to protect against the development of diabetes (Colberg et al.2010), this may inflate the importance in the contribution of DNAm to disease development. Lastly, T2D incidence was included as a covariate in the sensitivity analysis and not analyzed as an outcome because only 4 participants in our study developed T2D over the 16-year time period—which would limit our power to detect associ-ations with disease incidence. Because of this limitation, our focus was on phenotypes associated with the inci-dence of T2D rather than the inciinci-dence itself.
Finally, while our study benefits from a longitudinal design with DNAm spanning an average of 16 years
within subjects, the number of subjects is small. Larger studies will be needed to confirm the associations re-ported here and to investigate mechanisms underlying the associations. Our results are consistent with a sce-nario in which the relationship between age and these diabetes-related phenotypes may be mediated by DNAm or a related process. However, much larger studies are required to tease out causality in the relation-ship between epigenetic aging rates and phenotypes associated with diabetes such as high BMI. Recent cross-sectional publications have used Mendelian ran-domization approaches to assess causality between DNAm and obesity from whole blood (Mendelson et al. 2017; Wahl et al.2017). Their findings suggest that the majority of obesity-associated differences in DNAm patterns may be a result, rather than a cause, of the development of obesity. Regardless of the direction of causality, our results and others support the potential of DNAm and epigenetic factors as candidates to devel-op biomarkers for diabetes-related phenotypes.
Conclusions
Diabetes is associated with genetic, lifestyle, and envi-ronmental factors, suggesting that the epigenome may be important in determining both susceptibility and progression of the disease. While numerous past studies have noted small-scale DNAm changes that accompany diabetes risk and progression, our findings speak to the utility of genome-wide methylation changes in model-ing phenotypes associated with diabetes. This contribu-tion of Δage in modeling diabetes phenotypes also speaks to the ability of DNAm to serve as a potential mediator of the relationship between aging and the phenotypes associated with age-related disease, or alter-natively as a biomarker. We believe this pilot study can inform future studies of DNAm-based biomarkers and their potential to predict phenotypes associated with disease.
supported by the National Science Foundation Graduate Research Fellowship Program under Grant No. (DGE-1444932). Any opin-ions, findings, and conclusions or recommendations expressed in this material are those of the author(s) and do not necessarily reflect the views of the National Science Foundation. The WHI program is funded by the National Heart, Lung, and Blood Institute, National Institutes of Health, U.S. Department of Health and Human Services through contracts HHSN268201600018C, HHSN268201600001C, H H S N 2 6 8 2 0 1 6 0 0 0 0 2 C , H H S N 2 6 8 2 0 1 6 0 0 0 0 3 C , a n d HHSN268201600004C. All contributors to WHI science are listed athttps://www.whi.org/researchers/Documents%20%20Write%20 a%20Paper/WHI%20Investigator%20Long%20List.pdf.
References
Adalsteinsson BT et al (2012) Heterogeneity in white blood cells has potential to confound DNA methylation measurements. PLoS One 7:e46705. https://doi.org/10.1371/journal. pone.0046705
Alisch RS, Barwick BG, Chopra P, Myrick LK, Satten GA, Conneely KN, Warren ST (2012) Age-associated DNA methylation in pediatric populations. Genome Res 22:623– 632.https://doi.org/10.1101/gr.125187.111
Association AD (2016) Erratum. Classification and diagnosis of diabetes. Sec. 2. In Standards of Medical Care in Diabetes-2016. Diabetes Care 2016;39(Suppl. 1):S13-S22 Diabetes Care 39:1653 doi:https://doi.org/10.2337/dc16-er09 Baker GT, Sprott RL (1988) Biomarkers of aging Exp Gerontol 23:
223–239 doi:https://doi.org/10.1016/0531-5565(88)90025-3 Barfield RT, Kilaru V, Smith AK, Conneely KN (2012) CpGassoc:
an R function for analysis of DNA methylation microarray data. Bioinformatics 28:1280–1281.https://doi.org/10.1093 /bioinformatics/bts124
Bollati Vet al (2009) Decline in genomic DNA methylation through aging in a cohort of elderly subjects. Mech Ageing Dev 130: 234–239.https://doi.org/10.1016/j.mad.2008.12.003 Breitling PL, Saum K-U, Perna L, Schöttker B, Holleczek B (2016)
Frailty is associated with the epigenetic clock but not with telomere length in a German cohort. Clin Epigenetics:8.1: 21. https://doi.org/10.1186/s13148-016-0186-5
Burch JB et al (2014) Advances in geroscience: impact on healthspan and chronic disease. J Gerontol A Biol Sci Med Sci 6 9( Su pp l 1): S1–S 3. h t t ps : / / do i . org / 1 0. 1 0 93 /gerona/glu041
Chan JM, Rimm EB, Colditz GA, Stampfer MJ, Willett WC (1994) Obesity, fat distribution, and weight gain as risk factors for clinical diabetes in men. Diabetes Care 17:961– 969
Chen BH et al (2016) DNA methylation-based measures of bio-logical age: meta-analysis predicting time to death. Aging (Albany NY) 8:1844–1865. https://doi.org/10.18632 /aging.101020
Christensen BC et al (2009) Aging and environmental exposures alter tissue-specific DNA methylation dependent upon CpG island context. PLoS Genet 5:e1000602. https://doi. org/10.1371/journal.pgen.1000602
Christiansen L, Lenart A, Tan Q, Vaupel JW, Aviv A, McGue M, Christensen K (2016) DNA methylation age is associated
with mortality in a longitudinal Danish twin study. Aging Cell 15:149–154.https://doi.org/10.1111/acel.12421 Colberg SR et al (2010) Exercise and type 2 diabetes: American
College of Sports Medicine and the American Diabetes Association: joint position statement. Exercise and type 2 diabetes. Med Sci Sports Exerc 42:2282–2303.https://doi. org/10.1249/MSS.0b013e3181eeb61c
Fagnoni FF et al (2000) Shortage of circulating naive CD8(+) T cells provides new insights on immunodeficiency in aging. Blood 95:2860–2868
International Diabetes Federation (2015) IDF Diabetes Atlas, 7th edn. Brussels, Belgium: International Diabetes Federation Feinberg AP (2007) Phenotypic plasticity and the epigenetics of
human disease. Nature 447:433–440.https://doi.org/10.1038 /nature05919
Ford ES, Williamson DF, Liu S (1997) Weight change and diabe-tes incidence: findings from a national cohort of US adults. Am J Epidemiol 146:214–222
Goldberg AD, Allis CD, Bernstein E (2007) Epigenetics: a land-scape takes shape. Cell 128:635–638.https://doi.org/10.1016 /j.cell.2007.02.006
The Women’s Health Initiative Study Group (1998) Design of the Women’s Health Initiative clinical trial and observational study. Controlled Clin Trials 19.1 (1998): 61–109
Hannum G et al (2013) Genome-wide methylation profiles reveal quantitative views of human aging rates. Mol Cell 49:359– 367.https://doi.org/10.1016/j.molcel.2012.10.016
Hays J et al. (2003) The Women’s Health Initiative recruitment methods and results. Ann Epidemiol 13.9 (2003): S18–S77 He W, D. Goodkind, P. Kowal (2016) An aging world: 2015.
International Population Reports P95/09–1
Heinemann L (2010) Insulin assay standardization: leading to measures of insulin sensitivity and secretion for practical clinical care response to Staten et al. Diabetes Care 33: e83.https://doi.org/10.2337/dc10-0034
Hidalgo B et al (2014) Epigenome-wide association study of fasting measures of glucose, insulin, and HOMA-IR in the genetics of lipid lowering drugs and diet network study. Diabetes 63:801–807.https://doi.org/10.2337/db13-1100 Horvath S (2013) DNA methylation age of human tissues and cell
types. Genome Biol 14:R115. https://doi.org/10.1186/gb-2013-14-10-r115
Horvath S et al (2015) Decreased epigenetic age of PBMCs from Italian semi-supercentenarians and their offspring. Aging (Albany NY) 7:1159–1170.10.18632/aging.100861 Horvath S et al (2016) An epigenetic clock analysis of
race/ethnicity, sex, and coronary heart disease. Genome Biol 17:171.https://doi.org/10.1186/s13059-016-1030-0 Houseman EA et al (2012) DNA methylation arrays as surrogate
measures of cell mixture distribution. BMC Bioinformatics 13:86.https://doi.org/10.1186/1471-2105-13-86
Hu FB (2011) Globalization of diabetes: the role of diet, lifestyle, and genes. Diabetes Care 34:1249–1257. https://doi. org/10.2337/dc11-0442
Hu FB, Manson JE, Stampfer MJ, Colditz G, Liu S, Solomon CG, Willett WC (2001) Diet, lifestyle, and the risk of type 2 diabetes mellitus in women. N Engl J Med 345:790–797. https://doi.org/10.1056/NEJMoa010492
Kaeberlein M, Rabinovitch PS, Martin GM (2015) Healthy aging: the ultimate preventative medicine. Science 350:1191–1193. https://doi.org/10.1126/science.aad3267
Kananen L et al (2016) The trajectory of the blood DNA methylome ageing rate is largely set before adulthood: evi-dence from two longitudinal studies. Age (Dordr) 38:65. https://doi.org/10.1007/s11357-016-9927-9
Kennedy BK et al (2014) Geroscience: linking aging to chronic disease. Cell 159:709–713. https://doi.org/10.1016/j. cell.2014.10.039
Koh-Banerjee P, Wang Y, FB H, Spiegelman D, Willett WC, Rimm EB (2004) Changes in body weight and body fat distribution as risk factors for clinical diabetes in US men. Am J Epidemiol 159:1150–1159. https://doi.org/10.1093 /aje/kwh167
Leek JT, Johnson WE, Parker HS, Jaffe AE, Storey JD (2012) The sva package for removing batch effects and other unwanted variation in high-throughput experiments. Bioinformatics 28: 882–883.https://doi.org/10.1093/bioinformatics/bts034 Levine M et al. (2015) DNA methylation age of blood predicts
future onset of lung cancer in the Women’s Health Initiative. Aging (Albany NY) 7:690-700.https://doi.org/10.18632 /aging.100809
Levine ME et al (2016) Menopause accelerates biological aging. Proc Natl Acad Sci U S A 113:9327–9332.https://doi. org/10.1073/pnas.1604558113
Marioni RE et al (2015a) DNA methylation age of blood predicts all-cause mortality in later life. Genome Biol 16:25. https://doi.org/10.1186/s13059-015-0584-6
Marioni RE et al (2015b) The epigenetic clock is correlated with physical and cognitive fitness in the Lothian Birth Cohort 1936. Int J Epidemiol 44:1388–1396.https://doi.org/10.1093 /ije/dyu277
McLaughlin T, Abbasi F, Cheal K, Chu J, Lamendola C, Reaven G (2003) Use of metabolic markers to identify overweight individuals who are insulin resistant. Ann Intern Med 139: 802–809. https://doi.org/10.7326/0003-4819-139-10-200311180-00007
Mendelson MM et al (2017) Association of body mass index with DNA methylation and gene expression in blood cells and relations to cardiometabolic disease: a Mendelian randomi-zation approach. PLoS Med 14:e1002215. https://doi. org/10.1371/journal.pmed.1002215
Mokdad AH, Ford ES, Bowman BA, Dietz WH, Vinicor F, Bales VS, Marks JS (2003) Prevalence of obesity, diabetes, and obesity-related health risk factors, 2001. JAMA 289:76–79. https://doi.org/10.1001/jama.289.1.76
Nathan DM et al (2007) Impaired fasting glucose and impaired glucose tolerance: implications for care. Diabetes Care 30: 753–759.https://doi.org/10.2337/dc07-9920
Nevalainen T et al (2017) Obesity accelerates epigenetic aging in middle-aged but not in elderly individuals. Clin Epigenetics 9:20.https://doi.org/10.1186/s13148-016-0301-7
Niccoli T, Partridge L (2012) Ageing as a risk factor for disease. Curr Biol 22:R741–R752. https://doi.org/10.1016/j. cub.2012.07.024
Nilsson E et al (2014) Altered DNA methylation and differential expression of genes influencing metabolism and inflamma-tion in adipose tissue from subjects with type 2 diabetes. Diabetes 63:2962–2976.https://doi.org/10.2337/db13-1459
Pan XR et al (1997) Effects of diet and exercise in preventing NIDDM in people with impaired glucose tolerance. The Da Qing IGT and Diabetes Study. Diabetes Care 20:537–544 Patterson RE, Kristal AR, Tinker LF, Carter RA, Bolton MP,
Agurs-Collins T (1999) Measurement characteristics of the Women’s Health Initiative food frequency questionnaire. Ann Epidemiol 9:178–187
Perna L, Zhang Y, Mons U, Holleczek B, Saum KU, Brenner H (2016) Epigenetic age acceleration predicts cancer, cardiovas-cular, and all-cause mortality in a German case cohort. Clin Epigenetics 8:64.https://doi.org/10.1186/s13148-016-0228-z Pinheiro J, Bates D, DebRoy S, Sarkar D, Team RC (2016) nlme:
linear and nonlinear mixed effects models. vol 3.1–128. R package version
Quach A et al (2017) Epigenetic clock analysis of diet, exercise, education, and lifestyle factors. Aging (Albany NY) 9:419-446. https://doi.org/10.18632/aging.101168
Reinius LE et al (2012) Differential DNA methylation in purified human blood cells: implications for cell lineage and studies on disease susceptibility. PLoS One 7:e41361.https://doi. org/10.1371/journal.pone.0041361
Ronn T, Ling C (2015) DNA methylation as a diagnostic and therapeutic target in the battle against type 2 diabetes. Epigenomics 7:451–460.https://doi.org/10.2217/epi.15.7 Shai I, Jiang R, Manson JE, Stampfer MJ, Willett WC, Colditz
GA, FB H (2006) Ethnicity, obesity, and risk of type 2 diabetes in women: a 20-year follow-up study. Diabetes Care 29:1585–1590.https://doi.org/10.2337/dc06-0057 Shaw JE, Sicree RA, Zimmet PZ (2010) Global estimates of the
prevalence of diabetes for 2010 and 2030. Diabetes Res Clin Pract 87:4–14.https://doi.org/10.1016/j.diabres.2009.10.007 Simental-Mendía LE, Rodríguez-Morán M, Guerrero-Romero F (2008) The product of fasting glucose and triglycerides as surrogate for identifying insulin resistance in apparently healthy subjects. Metab Syndr Relat Disord 6:299–304. https://doi.org/10.1089/met.2008.0034
Stamler J, Vaccaro O, Neaton JD, Wentworth D (1993) Diabetes, other risk factors, and 12-yr cardiovascular mortality for men screened in the multiple risk factor intervention trial. Diabetes Care 16:434–444
Teschendorff AE et al (2010) Age-dependent DNA methylation of genes that are suppressed in stem cells is a hallmark of cancer. Genome Res 20:440–446. https://doi.org/10.1101 /gr.103606.109
Teschendorff AE, Marabita F, Lechner M, Bartlett T, Tegner J, Gomez-Cabrero D, Beck S (2013) A beta-mixture quantile normalization method for correcting probe design bias in Illumina Infinium 450 k DNA methylation data. Bioinformatics 29:189–196. https://doi.org/10.1093 /bioinformatics/bts680
Wahl S et al (2017) Epigenome-wide association study of body mass index, and the adverse outcomes of adiposity. Nature 541:81–86.https://doi.org/10.1038/nature20784
Weyer C, Hanson RL, Tataranni PA, Bogardus C, Pratley RE (2000) A high fasting plasma insulin concentration predicts type 2 diabetes independent of insulin resistance: evidence for a pathogenic role of relative hyperinsulinemia. Diabetes 49:2094–2101.https://doi.org/10.2337/diabetes.49.12.2094 Xu Z, Taylor JA (2014) Genome-wide age-related DNA
modification, expression and cancer. Carcinogenesis 35:356– 364.https://doi.org/10.1093/carcin/bgt391
Yokoyama H et al (2003) Quantitative insulin sensitivity check index and the reciprocal index of homeostasis model assess-ment in normal range weight and moderately obese type 2
diabetic patients. Diabetes Care 26:2426–2432.https://doi. org/10.2337/diacare.26.8.2426