BEHAVIORAL MEASUREMENT OF INTOLERANCE OF UNCERTAINTY IN ANXIETY DISORDERS
Ryan J. Jacoby
A thesis submitted to the faculty at the University of North Carolina at Chapel Hill in partial fulfillment of the requirements for the degree of Doctor of Philosophy in the Department of
Psychology (Clinical).
Chapel Hill 2013
Approved by:
Jonathan S. Abramowitz David L. Penn
ABSTRACT
Ryan J. Jacoby: Behavioral Measurement of Intolerance of Uncertainty in Anxiety Disorders (Under the direction of: Jonathan S. Abramowitz)
Intolerance of Uncertainty (IU) is an important cognitive bias associated with obsessive-compulsive disorder (OCD) and generalized anxiety disorder (GAD). Yet to date, IU is only measured using self-report instruments, and behavioral measures of in vivo uncertainty would help our understanding of this construct. Accordingly, the current study examined the validity of a probabilistic inference task, the Beads Task, as a behavioral measure of IU in a sample of anxiety disorders patients and non-anxious controls. While the Beads Task successfully induced task-related uncertainty as the decision became more difficult, contrary to hypotheses, self-reported IU did not predict performance on this task using observable performance related measures (i.e., draws to decision, time to decision). Self-report IU, however, did predict one’s subjective experience of in vivo distress after deciding. Decision-related distress was better accounted for by general symptom measures than disorder-specific symptoms. Avenues for future research based on these findings are discussed.
ACKNOWLEDGEMENTS
` First of all, I would like to thank Dr. Jon Abramowitz for his endless guidance,
TABLE OF CONTENTS
LIST OF TABLES……….vii
LIST OF FIGURES………..viii
LIST OF ABBREVIATIONS……….………....ix
INTRODUCTION………..….1
METHOD………..…………..7
Participants……….…..7
Measures………..8
Mini-International Neuropsychiatric Interview Version 5.0………...8
Intolerance of Uncertainty Scale, Short Form……….8
Dimensional Obsessive-Compulsive Scale……….….9
Obsessive Beliefs Questionnaire-44………..10
Penn State Worry Questionnaire………10
Depression Anxiety and Stress Scale……….10
Beads Task………..………...11
Procedure………...12
RESULTS………..…………13
Missing Data………..13
Group Comparisons on Beads Task Performance……….14
Preliminary Analyses……….14
Draws to Decision………..18
Time………...19
Distress………...20
Correlations between Beads Task Performance and Other Study Measures………….…22
Uncertainty Related Cognitions Predicting Beads Task Performance………..22
Predicting Draws to Decision………24
Predicting Time to Decision………..25
Predicting Distress after Decision………..25
Anxiety Symptoms Predicting Beads Task Performance………..26
Predicting Draws to Decision………26
Predicting Time to Decision………..27
Predicting Distress after Decision………..27
DISCUSSION………..……..28
APPENDIX A: SCRIPT FOR THE BEADS TASK……….35
APPENDIX B: DEBRIEFING FORM………..36
LIST OF TABLES
LIST OF FIGURES
LIST OF ABBREVIATIONS
ANOVA Analysis of Variance
DASS Depression Anxiety and Stress Scale
DF Degrees of Freedom
DOCS Dimensional Obsessive Compulsive Scale DTD Draws to decision
GAD Generalized anxiety disorder IU Intolerance of uncertainty IUS Intolerance of Uncertainty Scale
MINI Mini-International Neuropsychiatric Interview NAC Non-anxious control
OAD Other anxiety disorder
OBQ-PC Obsessive Beliefs Questionnaire – Perfectionism/Certainty subscale OCD Obsessive-compulsive disorder
BEHAVIORAL MEASUREMENT OF INTOLERANCE OF UNCERTAINTY IN ANXIETY DISORDERS
Intolerance of uncertainty (IU) has been defined as “a cognitive bias that affects how a person perceives, interprets, and responds to uncertain situations on a cognitive, emotional, and behavioral level” (Dugas, Schwartz, & Francis, 2004, p. 835). It specifically refers to “beliefs about the necessity of being certain, about the capacity to cope with unpredictable change, and about adequate functioning in situations which are inherently ambiguous” (Obsessive
Compulsive Cognitions Working Group, 1997, p. 678). Individuals who are high in IU have a lower perceptual threshold of ambiguity; find uncertainty to be stressful and upsetting; believe that uncertainty is negative, reflects poorly on a person, and should be avoided; and have
difficulty functioning in uncertain or ambiguous situations (Buhr & Dugas, 2002; Krohne, 1993). They also tend to apply ineffective problem solving strategies in uncertain situations,
overestimate the possibility of unpredictable negative events, and make threatening interpretations of ambiguous information (Ladouceur, Talbot, & Dugas, 1997). Given the ubiquity of ambiguity and uncertainty in everyday life, individuals high in IU tend to experience heightened daily distress.
compulsions (Obsessive Compulsive Cognitions Working Group, 1997). For example, a person high in IU with OCD might misinterpret a normally occurring senseless intrusive image (e.g., a loved one involved in an accident) in ways that lead to obsessional anxiety, preoccupation, and compulsive checking behavior (e.g., “I must be certain that this accident hasn’t happened”), which only further maintain the obsessional thinking and need for certainty (e.g., Rachman, 2002; Radomsky, Gilchrist, & Dussault, 2006).
Empirical studies with clinical and nonclinical samples consistently indicate a
relationship between self-reported IU and OC symptoms (Boelen & Carleton, 2012; Calleo, Hart, Björgvinsson, & Stanley, 2010; Dugas, Gosselin, & Ladouceur, 2001; Holaway, Heimberg, & Coles, 2006; Jacoby, Fabricant, Leonard, Riemann, & Abramowitz, 2013; Mahoney & McEvoy, 2012; McEvoy & Mahoney, 2011, 2012; Tolin, Abramowitz, Brigidi, & Foa, 2003). Moreover, this relationship is not accounted for by other variables such as depression, anxiety sensitivity, or worry (Steketee, Frost, & Cohen, 1998); and some studies suggest that individuals with OCD have higher levels of IU than do those with other anxiety disorders (Steketee et al., 1998; Tolin, Worhunsky, & Maltby, 2006). These findings indicate that IU is indeed a cognitive distortion with some specific relevance to OCD.
A highly heterogeneous condition, OCD consists of four empirically derived theme-based symptom dimensions: contamination, responsibility for harm, unacceptable thoughts, and
presentations of OCD (Abramowitz & Deacon, 2006; Calleo et al., 2010; Holaway et al., 2006; Jacoby et al., 2013; Tolin, Brady, & Hannan, 2008; Wheaton, Abramowitz, Berman, Riemann, & Hale, 2010).
Theoretical models of GAD posit that the extreme worry represents attempts to control the uncertainty associated with feared future situations (Dugas, Buhr, et al., 2004; Freeston, Rhéaume, Letarte, & Dugas, 1994). In support of this theory, a large body of research provides evidence supporting a strong association between self-reported IU and worry in both
undergraduate and clinical samples, even after controlling for various demographic and clinical factors (e.g., Boelen & Carleton, 2012; Buhr & Dugas, 2006; Dugas, Freeston, & Ladouceur, 1997; Dugas et al., 2001; Dugas, Schwartz, et al., 2004; Fergus & Wu, 2010; Mahoney & McEvoy, 2012; McEvoy & Mahoney, 2012; Norton, Sexton, Walker, & Norton, 2005; Sexton, Norton, Walker, & Norton, 2003). More severe GAD symptoms are also associated with greater self-reported IU (Dugas et al., 2007), and several studies have found that IU is specifically related to GAD and worry more so than to other psychological disorders (Dugas et al., 2001; Dugas, Marchand, & Ladouceur, 2005; Dugas, Schwartz, et al., 2004). Finally, experimental manipulation of IU has been found to increase worry, which suggests a possible causal
association between the two variables (de Bruin, Rassin, & Muris, 2006; Grenier & Ladouceur, 2004; Ladouceur, Gosselin, & Dugas, 2000; Rosen & Knäuper, 2009).
2005), health anxiety (Boelen & Carleton, 2012; Deacon & Abramowitz, 2008; Fergus & Valentiner, 2011; Norton et al., 2005), social anxiety (e.g., Boelen & Reijntjes, 2009; Carleton, Collimore, & Asmundson, 2010; Mahoney & McEvoy, 2012; McEvoy & Mahoney, 2012), neuroticism (McEvoy & Mahoney, 2012), trait anxiety (Khawaja & Yu, 2010), eating disorders (Sternheim, Konstantellou, Startup, & Schmidt, 2011; Sternheim, Startup, & Schmidt, 2011), hoarding (Oglesby et al., 2013), and depression (Dugas, Schwartz, et al., 2004; Norton et al., 2005; Yook, Kim, Suh, & Lee, 2010). Thus, IU might represent a transdiagnostic cognitive vulnerability (Carleton et al., 2012). Accordingly, there is a need for additional research to establish the extent to which IU is unique to GAD or OCD, or common to a broad range of psychopathology.
An important limitation of the existing research on IU, however, is that studies rely almost exclusively on two self-report measures of this construct, the Intolerance of Uncertainty Scale (IUS) and the Perfectionism/Certainty subscale of the Obsessive Beliefs Questionnaire (OBQ-PC; both described further below).1 Yet while these scales are psychometrically valid, the literature would benefit from methodologically varied measurement of IU. The Beads Task, a probabilistic inference task that involves deciding from which jar a series of beads has been drawn, has been conceptualized as a behavioral measure of IU (Ladouceur et al., 1997): individuals who are high in IU are expected to require more pieces of information (i.e., more beads) before they feel certain enough to make a decision.
1
In the original Yes-No version of the Beads Task (Huq, Garety, & Hemsley, 1988; Phillips & Edwards, 1966), participants were shown two jars holding 100 beads of two different colors in a particular ratio (e.g. 85:15 red to blue vs. 85:15 blue to red). Participants were then told that beads were going to be drawn one by one with replacement from one of these two jars, and that each jar was equally likely to be chosen. The participant’s task was to decide from which jar the beads were being drawn. They were told that they could request as many beads as necessary to decide, and were asked after each bead was drawn whether or not they required more draws before they came to a decision. The sequence of beads in reality was predetermined using a random number generator. The outcome measure was the number of beads participants requested before feeling “certain” about making a decision.
Ladouceur and colleagues (1997) were the first to use the Beads Task as a behavioral measure of IU. With an non-clinical sample, these authors found a positive correlation between self-reported IU (scores on the IUS) and the number of beads requested in a moderately difficult (i.e., moderately ambiguous) version of the task, but not in the high ambiguity version.
Accordingly, they concluded that especially low and high levels of ambiguity lead to low and high levels of uncertainty respectively regardless of IU, and that moderately ambiguous
1991). Most of these studies, however, suffered from methodological limitations such as very small sample sizes, the use of overly “easy” versions of the Beads Task (i.e., 85:15 ratios which might not have captured differences between those with high and low IU), and, most
importantly, self-reported IU was never measured or correlated with Beads Task performance. Given the gaps and limitations of the existing work on IU, the present study compared
performance on the Beads Task—with three levels of difficulty/uncertainty—in individuals with OCD, GAD, other anxiety disorders (OADs), and non-anxious controls (NACs). The inclusion of both OAD and NAC groups allowed us to address whether IU in specific to OCD and GAD, or whether it is best conceptualized as a transdiagnostic construct.
We generally expected that participants would request more beads (i.e., evidence) and take more time to decide on more difficult levels of the Beads Task (difficult > intermediate > easy), and that they would feel less certain, less confident, and more distressed about their
decisions. We expected that all versions of the task would be perceived as equally important. The first specific aim of the current study was to examine possible differences on Beads Task
symptoms. Specifically, we predicted that responsibility/checking concerns and worry would significantly predict the number of beads requested on the intermediate version of the Beads Task after controlling for depression, anxiety, and stress (and the other symptom dimensions of OCD).
METHOD Participants
Sixty-nine adults with anxiety disorders and 26 undergraduates without any psychiatric diagnoses participated in the study.2 Student participants were recruited from Introduction to Psychology classes at the University of North Carolina at Chapel Hill (UNC-CH) and received one hour of research credit in exchange for their participation. These students composed the non-anxious control (NAC) group. Clinical participants were recruited from the community via letters distributed to local treatment providers, flyers posted locally, and email advertisements. Of the clinical sample, 36% (n = 25) met diagnostic criteria for social anxiety disorder, 32% (n = 22) for OCD, 4% (n = 3) for PTSD, 41% (n = 28) for GAD, and 25% (n =17) for specific
phobia3. The sample as a whole was primarily female (72.6%, n = 69) and Caucasian (73.7%, n = 70); 11.6% African American, 9.5% Asian, 3.2% Latino/Hispanic, and 2.1% Other /
Multiethnic. The group’s mean age was 28.15 years (SD = 12.94; range = 17 – 69) and the mean number of years of education reported was 16.15 (SD = 2.39; range = 10 - 25), suggesting that
2
Of the 100 individuals who were screened for the study, 4 were ineligible based on the
diagnostic interview (specifically 2 undergraduates met criteria for one or more anxiety disorders and two community members did not meet full diagnostic criteria). Additionally, one individual was excluded from data analysis because he emailed the principal investigator after the study saying that he realized he had misunderstood the rules of the Beads Task.
3
the average participant had completed at least some college.
For the purposes of diagnostic group comparisons, participants were divided into the following groups: (a) Non-anxious controls (NAC; no DSM-IV anxiety disorder diagnoses: n = 26); (b) OCD group (DSM-IV diagnosis of OCD without comorbid GAD: n = 17); (c) GAD group (DSM-IV diagnosis of GAD without comorbid OCD: n = 23), and (d) Other anxiety disorders (OAD) group (DSM-IV diagnosis of another anxiety disorder without comorbid GAD or OCD: n = 24). Five participants were enrolled in the study with comorbid diagnoses of both GAD and OCD. These individuals were included in descriptive and correlational analyses, but were excluded from analyses examining diagnostic group differences since they could not be assigned to the OCD (without GAD) group or the GAD (without OCD) group and since the sample size of this group was too small to examine separately. The procedures for assessment and determination of group membership are described further below (see Procedure section). Measures
Mini-International Neuropsychiatric Interview Version 5.0 (MINI: Sheehan et al.,
1998). The MINI is a structured diagnostic interview to determine DSM-IV Axis I diagnoses with adequate psychometric properties and a strong correlation with the SCID-IV (Sheehan et al., 1997). All participants were given the anxiety disorder modules of the MINI to verify psychological diagnostic status.
Intolerance of Uncertainty Scale, Short Form (IUS-12; Carleton, Norton, &
specifically to GAD and might better account for symptoms of worry than those of other anxiety disorders (Carleton, Gosselin, & Asmundson, 2010; Gentes & Ruscio, 2011). Participants rate each item on the IUS-12 from 1 (Not at all characteristic of me) to 5 (Entirely characteristic of me). The measure consists of two subscales thought to represent approach and avoidance
responses to uncertainty respectively (Birrell, Meares, Wilkinson, & Freeston, 2011).
Prospective IU (i.e., the cognitively focused dimension of IU), measures desire for predictability, preferences for knowing what the future holds, anxiety about future uncertain events, and active engagement in seeking information to increase certainty. Inhibitory IU (i.e., the behaviorally focused dimension of IU) measures avoidance and paralysis in the face of uncertainty. The IUS-12 has good psychometric properties in both clinical and non-clinical samples (Carleton et al., 2012, 2007; Helsen, Van, Vlaeyen, & Goubert, 2013; Jacoby et al., 2013; Khawaja & Yu, 2010; McEvoy & Mahoney, 2011). Internal consistency of the IUS-12 subscales in the present sample was excellent ( = .91-.92).
Dimensional Obsessive-Compulsive Scale (DOCS; Abramowitz et al., 2010). The DOCS is a 20-item self-report measure that assesses the severity of the most consistently replicated OCD symptom dimensions in four subscales: (1) Concerns about germs and contamination, (2) Concerns about being responsible for harm, injury, or bad luck, (3)
good to excellent reliability in clinical OCD, other anxiety disorder, and undergraduate samples. The measure also has good convergent, discriminant, and known groups validity. Internal consistency of the DOCS subscales in the present sample was excellent ( = .94-.95).
Obsessive Beliefs Questionnaire-44 (OBQ-44; Obsessive Compulsive Cognitions
Working Group, 2001, 2005). This is a 44-item self-report instrument that measures dysfunctional (i.e., obsessive) beliefs hypothesized to underlie OCD symptoms. It contains three subscales: (a) threat overestimation and responsibility (OBQ-RT; 16 items), (b) perfectionism and need for certainty (OBQ-PC; 16 items), and (b) importance and control of thoughts (OBQ-ICT; 12 items). Individuals rate items on a Likert scale ranging from 1 (Disagree very much) to 7 (Agree very much). The instrument has good validity, internal consistency, and test-retest reliability (Obsessive
Compulsive Cognitions Working Group, 2001, 2005). Internal consistency of the OBQ-44 subscales in the present sample was excellent ( = .93-.95).
Penn State Worry Questionnaire (PSWQ; Meyer, Miller, Metzger, & Borkovec, 1990).
The PSWQ is a 16-item scale that measures the tendency to engage in excessive, uncontrollable, and generalized worry. The scale assesses the intensity and excessiveness of worry without regard to its specific content and represents a unidimensional construct. Participants rate items on a five-point Likert scale ranging from 1 (Not at all typical) to 5 (Very typical). Sample items include: “My worries overwhelm me” and “Once I start worrying I can’t stop.” The PSWQ has
good internal consistency, reliability, and criterion-related validity in undergraduate and clinical samples (Brown, Antony, & Barlow, 1992; Meyer et al., 1990; Molina & Borkovec, 1994). Internal consistency of the PSWQ in the present sample was excellent ( = .95).
general depression, hyperarousal, and tension over the past week. It contains three seven-item subscales: Depression (DASS-D), which measures dysphoric mood (e.g. sadness or
worthlessness); Anxiety (DASS-A), which measures symptoms of physical arousal, panic attacks, and fear (e.g. trembling or faintness); and Stress (DASS-S), which measures symptoms such as tension, irritability, agitation, and overreaction to stressful events. Participants rate items on a four-point Likert scale ranging from 0 (Did not apply to me at all) to 3 (Applied to me very much, or most of the time) and then total scores are multiplied by 2 in order to compare to full
scale DASS-42 scores. The DASS-21 has an excellent factor structure and the subscales have good to excellent internal consistency (Antony et al., 1998). It also has good convergent and known groups validity. Internal consistency of the DASS in the present sample was excellent (
= .94).
Beads Task (Huq et al., 1988; Phillips & Edwards, 1966). The version of the Beads Task used in the current study was computerized and consisted of three levels of
difficulty/uncertainty: (a) an easy or low uncertainty version (2 jars with a 85:15 blue to red vs. 85:15 red to blue ratio), (b) an intermediate uncertainty version (2 jars with a 60:40 purple to green vs. 60:40 green to purple ratio), and (c) a difficult or high uncertainty version (3 jars with a 44:28:28 orange to yellow to pink vs. 44:28:28 yellow to pink to orange vs. 44:28:28 pink to orange to yellow ratio). Following Sternheim et al. (2011)’s methodology, the maximum possible number of beads that could be requested before making a decision was 30 to prevent any ceiling effects.
Garety et al. (2005). The rest of the sequences were determined using a random number generator.
Low uncertainty condition (Easy) – 85 Red (R) : 15 Blue (B) Mostly Red - RRRBRRRBRRRBRRBRRRRRRBRRRBRRRR
Intermediate uncertainty condition (Intermediate) – 60 Purple (P) : 40 Green (G) Mostly Purple - PGGPPGPPPGPPPPGGPGGPPGGPGGPPPP
High uncertainty condition (Difficult) – 44 Orange (O) : 28 Yellow (Y) : 28 Pink (P) Mostly Orange - POOYYPOYOYYPOPOOPPOYPOYOOOPYYO
Because of the possibility of memory biases and deficits (e.g., Deckersbach, Otto, Savage, Baer, & Jenike, 2000), and decreased memory confidence (e.g., Tolin et al., 2001) in OCD, all
participants were able to see the beads from previous trials displayed at the bottom of their computer screen in order to eliminate any possible influence of memory on the Beads Task.
The experimenter recorded (a) the number of beads the participant selected before making a decision (i.e., draws to decision, DTD), (b) time taken to reach the decision, and (c) accuracy of the participant’s decision. Participants also completed a series of four questions (at the end of each version of the task) by dragging their curser along a visual analogue scale on the computer screen that ranges from 0 (Not at all) to 100 (Very much). The questions were: (a) How certain are you about your decision, (b) How distressed do you feel right now, (c) How confident do you feel about your decision, and (c) How important is it for you to get the answer right. Procedure
the study using the Participant Pool web-based software (SONA). Individuals in the patient groups, after hearing about the study, contacted research personnel to schedule an initial phone screening, and if deemed likely eligible, then scheduled an appointment to participate in the experiment at our laboratory.
All participants were tested individually in the Anxiety and Stress Disorders laboratory in Howell Hall. The experimenter first obtained informed consent, and then administered the anxiety disorder modules of the MINI. Using the computer program Qualtrics, participants then completed a demographic survey and the study measures described above. Finally, participants completed the Beads Task (See Appendix A: Script of the Beads Task)—initially a practice version, and then the three different experimental versions (in a counterbalanced order)—with the aid of the experimenter (since the presence of an experimenter has been found to increase reliability of the task; Fear & Healy, 1997). At the end of the visit, participants were debriefed (See Appendix D: Debriefing Form). Students received 1-hour credit toward the research requirement of Introduction to Psychology, and patients received $10 as compensation for their
time.
RESULTS
Missing Data
Group Comparisons on Demographic Variables and Self-Report Measures4
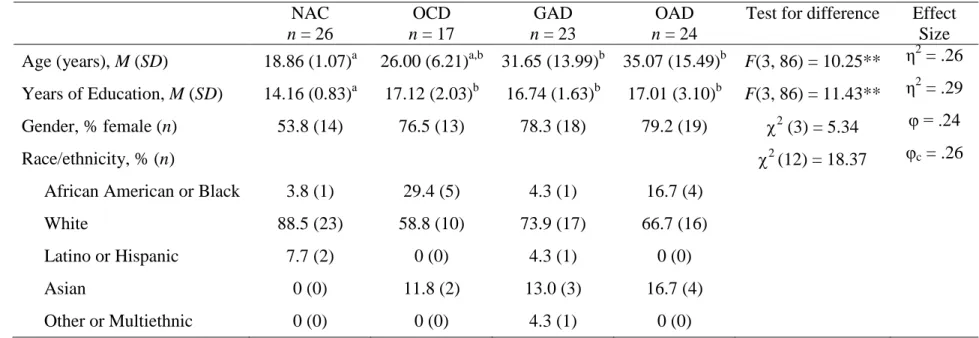
Demographic characteristics of the four groups, and the results of one way ANOVA and chi-square tests examining group differences, appear in Table 1. As can be seen, the NAC group was significantly younger than two of the three clinical groups and had significantly fewer years of education than all three clinical groups (ps < .001, η2 > .26). Despite these group differences, we had no a priori reason to believe that age or years of education would be related to
performance on the Beads Task, and thus elected to not include either of these variables as covariates in our ANOVA or regression analyses. There were no significant gender or race/ethnicity differences among the four groups.
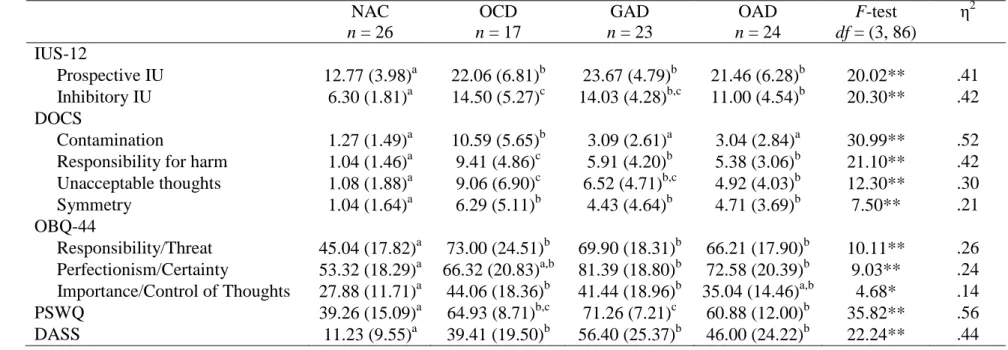
Group mean scores on the self-report measures of symptoms and cognitions, along with the results of one way ANOVAs examining group differences, appear in Table 2. In general the NAC group had the lowest scores on the cognitive and symptom self-report measures when compared to the clinical groups. Also, disorder specific measures for OCD (i.e., the DOCS) and GAD (i.e., the PSWQ) tended to be highest for individuals in those diagnostic groups
respectively.
Group Comparisons on Beads Task Performance
Preliminary Analyses. First, analyses were conducted to examine (a) participant
accuracy on the three versions of Beads Task, (b) whether individuals experienced less certainty
and confidence after completing more difficult versions of the Beads Task, and (c) whether there
were diagnostic group differences on importance, certainty, or confidence on the three task
versions.
4
TABLE 1: Demographic characteristics of the sample by diagnostic group NAC
n = 26
OCD n = 17
GAD n = 23
OAD n = 24
Test for difference Effect Size Age (years), M (SD) 18.86 (1.07)a 26.00 (6.21)a,b 31.65 (13.99)b 35.07 (15.49)b F(3, 86) = 10.25** η2 = .26 Years of Education, M (SD) 14.16 (0.83)a 17.12 (2.03)b 16.74 (1.63)b 17.01 (3.10)b F(3, 86) = 11.43** η2 = .29 Gender, % female (n) 53.8 (14) 76.5 (13) 78.3 (18) 79.2 (19) 2 (3) = 5.34 φ = .24
Race/ethnicity, % (n) 2 (12) = 18.37 φc = .26
African American or Black 3.8 (1) 29.4 (5) 4.3 (1) 16.7 (4)
White 88.5 (23) 58.8 (10) 73.9 (17) 66.7 (16)
Latino or Hispanic 7.7 (2) 0 (0) 4.3 (1) 0 (0)
Asian 0 (0) 11.8 (2) 13.0 (3) 16.7 (4)
Other or Multiethnic 0 (0) 0 (0) 4.3 (1) 0 (0)
Note. ** p < .001. Means with different superscripts are significantly different from one another (p < .05)
TABLE 2: Means and standard deviations on self-report study measures by diagnostic group NAC
n = 26
OCD n = 17
GAD n = 23
OAD n = 24
F-test df = (3, 86)
η2
IUS-12
Prospective IU 12.77 (3.98)a 22.06 (6.81)b 23.67 (4.79)b 21.46 (6.28)b 20.02** .41 Inhibitory IU 6.30 (1.81)a 14.50 (5.27)c 14.03 (4.28)b,c 11.00 (4.54)b 20.30** .42 DOCS
Contamination 1.27 (1.49)a 10.59 (5.65)b 3.09 (2.61)a 3.04 (2.84)a 30.99** .52 Responsibility for harm 1.04 (1.46)a 9.41 (4.86)c 5.91 (4.20)b 5.38 (3.06)b 21.10** .42 Unacceptable thoughts 1.08 (1.88)a 9.06 (6.90)c 6.52 (4.71)b,c 4.92 (4.03)b 12.30** .30
Symmetry 1.04 (1.64)a 6.29 (5.11)b 4.43 (4.64)b 4.71 (3.69)b 7.50** .21
OBQ-44
Responsibility/Threat 45.04 (17.82)a 73.00 (24.51)b 69.90 (18.31)b 66.21 (17.90)b 10.11** .26 Perfectionism/Certainty 53.32 (18.29)a 66.32 (20.83)a,b 81.39 (18.80)b 72.58 (20.39)b 9.03** .24 Importance/Control of Thoughts 27.88 (11.71)a 44.06 (18.36)b 41.44 (18.96)b 35.04 (14.46)a,b 4.68* .14
PSWQ 39.26 (15.09)a 64.93 (8.71)b,c 71.26 (7.21)c 60.88 (12.00)b 35.82** .56
DASS 11.23 (9.55)a 39.41 (19.50)b 56.40 (25.37)b 46.00 (24.22)b 22.24** .44
Note. *p < .01 ** p < .001. Means with different superscripts are significantly different from one another (p < .05)
There was a 100% accuracy rate on the easy version of the task, and 95% (n = 90) accuracy rates on both the intermediate and the difficult versions. On average, participants indicated that it was moderately important to answer correctly on the Beads Task (M = 43.58, SD = 29.98). A 3 (task version) x 4 (group) mixed ANOVA on task importance revealed a main effect of task difficulty, F(2, 172) = 4.41, p = .01, ηp2 = .05. Post-hoc paired samples t-tests
revealed thatparticipants rated the easy version of the task (M = 43.28, SD = 30.63) as slightly
more important than the intermediate version (M = 40.08, SD = 29.26), t(89) = 3.15, p = .002 (Cohen’s d = .11). Examination of the effect size of this difference, however, suggests that the magnitude of this effect is relatively modest, and does not appear to be practically meaningful.
There were no other significant differences (ps> .12). There was no main effect of diagnostic
group on task importance, F(3, 86) = 1.63, p = .19, ηp2 = .05, and no task version by diagnostic
group interaction, F(6, 172) = .88, p = .51, ηp2 =.03.
Next, a 3 (task version) x 4 (group) mixed ANOVA on level of certainty after completing
the task revealed a main effect of task difficulty, F(2, 172) = 109.12, p < .001, ηp2 = .56. Post-hoc
paired samples t-tests revealed thatparticipants reported being significantly less certain after
completing the difficult version (M = 48.33, SD = 22.49) compared to the intermediate version
(M = 62.03, SD = 20.90), t(89) = 7.10, p <.001, (Cohen’s d = .63). In addition, participants
reported being significantly less certain after completing the intermediate version compared to
the easy version (M = 75.81, SD = 20.22), t(89) = 7.93, p <.001, (Cohen’s d = .67). Thus, as
hoped, the more difficult the task version, the more uncertain participants felt after deciding.
There was no main effect of diagnostic group on certainty, F(3, 86) = .96, p = .42, ηp2 = .03.
There also was no task version by diagnostic group interaction, F(6, 172) = .98, p = .44, ηp2 =
The same pattern was observed for the 3 (task version) x 4 (group) ANOVA on level of
confidence after completing the task. First, there was a main effect of task difficulty, F(2, 172) =
96.57, p < .001, ηp2 = .53. Post-hoc paired samples t-tests revealed thatparticipants reported
being significantly less confident after completing the difficult (M = 45.79, SD = 23.53) as
compared to the intermediate version (M = 57.36, SD = 24.58), t(89) = 5.57, p <.001 (Cohen’s d
= .48). In addition, participants reported significantly less confidence after completing the
intermediate, as compared to the easy version (M = 73.68, SD = 21.15), t(89) = 8.50, p <.001
(Cohen’s d = .71). There was no main effect of diagnostic group on confidence, F(3, 86) = .98,
p = .41, ηp2 = .03. There also was no task version by diagnostic group interaction, F(6, 172) =
1.30, p = .26, ηp2 = .04.
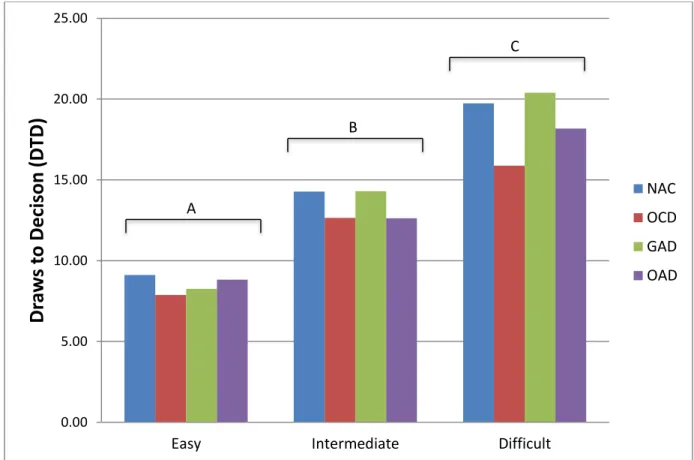
Draws to Decision. Figure 1 shows the mean number of beads requested (or “drawn”)
before making a decision on the Beads Task by group for the easy, intermediate, and difficult
task versions. To examine the hypothesized group differences (OCD and GAD > OAD > NAC) on DTD, we computed a 3 (task version) x 4 (group) ANOVA with DTD as the dependent variable. This analysis revealed a main effect of task difficulty, F(2, 172) = 98.91, p < .001, ηp2 =
.54. As is clear from Figure 1, post-hoc paired samples t-tests revealed thatparticipants requested more beads on the difficult version of the task than on the intermediate version, and on the
intermediate, than the easy version (ps < .001, Cohen’s ds > .70). There was no main effect of diagnostic group, F(3, 86) = .62, p = .60, ηp2 = .02. There also was no task version by group
interaction, F(6, 172) = .85, p = .53, ηp2 = .03. To test our hypothesis that group differences
would emerge for the intermediate version of the Beads Task in particular, we computed planned
comparisons on DTD for this version of the task. These simple contrasts, however, revealed no
Figure 1: Draws to decision by diagnostic group for each version of the Beads Task
Note. Different uppercase superscripts represent significant task version differences (p < .05).
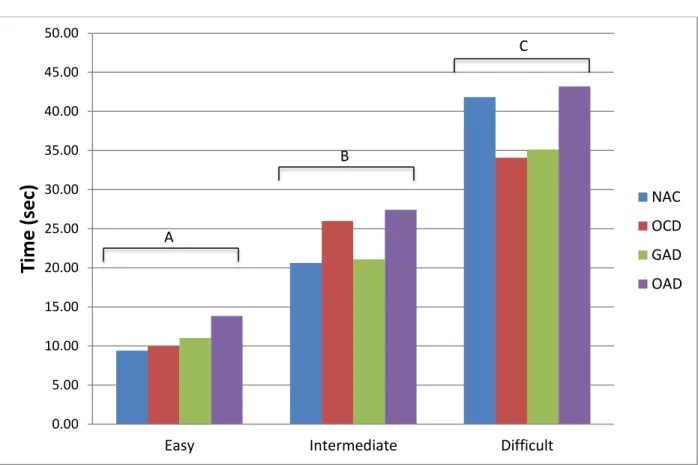
Time.5 Figure 2 shows the mean time (in seconds) that elapsed before making a decision
on the Beads Task by group for the easy, intermediate, and difficult task versions. A 3 (task
version) x 4 (group) exploratory ANOVA with time to decision as the dependent variable
revealed a main effect of task difficulty, F(2, 172) = 63.94, p < .001, ηp2 = .43. As can be seen in
Figure 2, post-hoc paired samples t-tests revealed thatparticipants took more time to decide in
the difficult, than in the intermediate version of the task; and on the intermediate, than on the
5
Two participants were identified who had time scores on the intermediate version of the Beads Task that were > 3 SDs above the mean. ANOVA analyses were computed both with and without these two outliers, and removing the outliers did not change the significance of the results; thus, to be conservative, the outliers were retained for analyses.
0.00 5.00 10.00 15.00 20.00 25.00
Easy Intermediate Difficult
easy version (ps < .001, Cohen’s ds > .65). There was no main effect of group, F(3, 86) = .56, p = .64, ηp2 = .02. There also was no task version by diagnostic group interaction, F(6, 172) =
.73, p = .63, ηp2 = .03.
Figure 2: Time to decision by diagnostic group for each version of the Beads Task
Note. Different uppercase superscripts represent significant task version differences (p < .05).
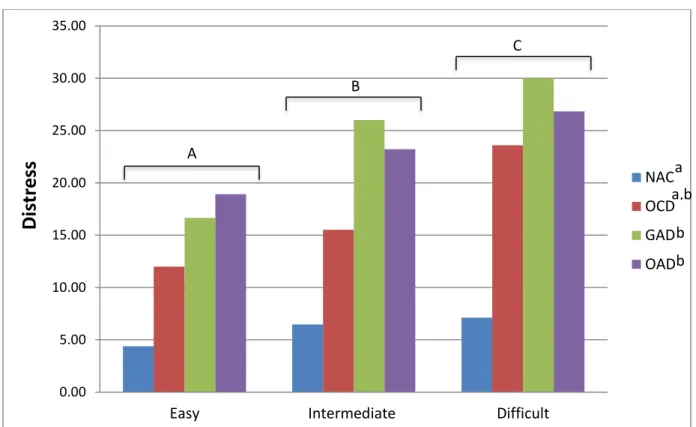
Distress. Figure 3 shows the mean distress level reported by participants after making a
decision by Beads Task level and by group. A 3 (task version) x 4 (group) exploratory ANOVA
revealed a main effect of task difficulty on distress, F(2, 172) = 17.72, p < .001, ηp2 = .17. As is
clear from Figure 3, post-hoc paired samples t-tests revealed thatparticipants were more
distressed by the difficult version than by the intermediate version (p = .01, Cohen’s d = .18), 0.00
5.00 10.00 15.00 20.00 25.00 30.00 35.00 40.00 45.00 50.00
Easy Intermediate Difficult
Time
(se
c)
NACOCD GAD
OAD A
B
and by the intermediate version than the easy version (p = .001, Cohen’s d = .27). There was also a main effect of diagnostic group on distress, F(3, 86) = 6.98, p < .001, ηp2 = .20. Post hoc tests
revealed that the NAC group was significantly less distressed after completing the Beads Task
than were the GAD and OAD groups (ps= .001; who were not significantly different from one
another, p = .99). The OCD group did not have significantly different levels of distress than any
of the other diagnostic groups (ps > .12). There also was no task version by diagnostic group
interaction on distress, F(6, 172) = 1.61, p = .15, ηp2 = .05.
Figure 3: Level of distress by diagnostic group for each version of the Beads Task
Note. Different uppercase superscripts represent significant task version differences (p < .05). Different lowercase superscripts represent significant diagnostic group differences (p < .05)
0.00 5.00 10.00 15.00 20.00 25.00 30.00 35.00
Easy Intermediate Difficult
Di
st
res
s
NAC
OCD
GAD
OAD A
B
C
a a,b
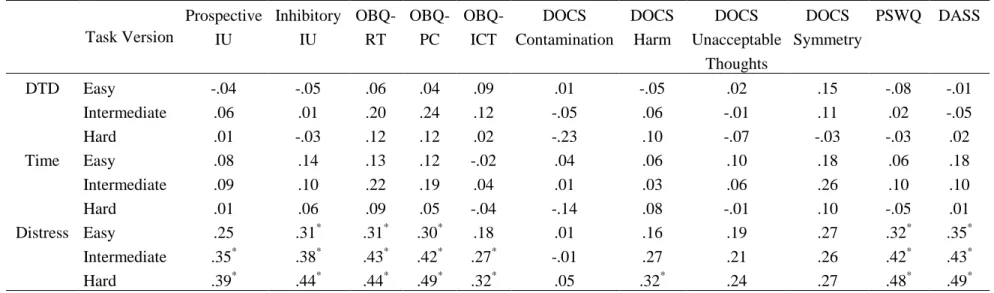
Correlations between Beads Task Performance and Other Study Measures
Correlations between the primary Beads Task variables (DTD, time to reach a decision, and distress after having decided) and the self-report symptom and cognition measures appear in Table 3. A Bonferroni corrected alpha of .005 was used to correct for multiple tests within each task version (.05 / 11). As can be seen, contrary to our hypothesis, neither the number of draws to decision nor the time to decision was associated with any self-report measures. However, for the most part, level of distress was significantly and moderately positively associated with self-report measures of uncertainty and OC related cognitions. Distress on the difficult version of the Beads Task was also significantly positively associated with the DOCS Harm subscale, and Beads Task-related distress (across all three versions) was significantly and moderately positively associated with the PSWQ and DASS.
Uncertainty Related Cognitions Predicting Beads Task Performance
Regression diagnostics identified no violations of normality or homoscedasticity. Any outliers with standardized residual ≥ 3 SDs above the mean were identified for further
TABLE 3: Correlations between Beads Task measures and self-report measures (n = 95).
Task Version
Prospective IU
Inhibitory IU
OBQ-RT
OBQ-PC
OBQ-ICT
DOCS Contamination
DOCS Harm
DOCS Unacceptable
Thoughts
DOCS Symmetry
PSWQ DASS
DTD Easy -.04 -.05 .06 .04 .09 .01 -.05 .02 .15 -.08 -.01 Intermediate .06 .01 .20 .24 .12 -.05 .06 -.01 .11 .02 -.05 Hard .01 -.03 .12 .12 .02 -.23 .10 -.07 -.03 -.03 .02 Time Easy .08 .14 .13 .12 -.02 .04 .06 .10 .18 .06 .18 Intermediate .09 .10 .22 .19 .04 .01 .03 .06 .26 .10 .10 Hard .01 .06 .09 .05 -.04 -.14 .08 -.01 .10 -.05 .01 Distress Easy .25 .31* .31* .30* .18 .01 .16 .19 .27 .32* .35* Intermediate .35* .38* .43* .42* .27* -.01 .27 .21 .26 .42* .43* Hard .39* .44* .44* .49* .32* .05 .32* .24 .27 .48* .49*
* p < .005
Tolerance statistics (≥ .33) and variation inflation factors (VIF; ≤ 3.05) were adequate to satisfy the condition of independent predictors (Tabachnick & Fidell, 2013) indicating that
multicollinearity was within acceptable ranges. Thus, the assumptions for our regression analyses were met. A Bonferroni corrected alpha of .017 was used to correct for multiple tests for each Beads Task version (.05 / 3).
To examine the IU self-report measures (IUS-12 and OBQ-PC) as predictors of each measure of performance on the Beads Task (i.e., DTD, time, distress) at the different levels of task difficulty (i.e., easy, intermediate, and difficult), we conducted a series of hierarchical multiple regression analyses. In each set of regressions, the DASS was entered in Step 1 and the two IUS-12 subscales (Prospective IU and Inhibitory IU) and the OBQ-PC were entered
simultaneously in Step 2.
Predicting Draws to Decision. In the first regression predicting DTD on the easy (i.e., low uncertainty) version of the Beads Task, the DASS (Step 1) did not account for significant variance (R2 < .001; p = .92). When the IU self-report measures were added in Step 2, the amount of variance did not increase significantly, ΔR2 = .01, p = .77. The final model accounted for only 1% of the variance, F(4, 90) = .28, p = .89.
In the second regression predicting DTD on the intermediate version of the Beads Task, the DASS (Step 1) did not account for significant variance (R2 = .002; p = .66). When the IU self-report measures were added in Step 2, the amount of variance did not increase significantly, ΔR2
significantly, ΔR2
= .03, p = .38. The final model only accounted for 3% of the variance, F(4, 90) = .79, p = .54.
Predicting Time to Decision. In the first regression predicting time to decision on the easy version of the Beads Task, the DASS (Step 1) did not account for significant variance (R2 = .03; p = .08). When the IU self-report measures were added in Step 2, the amount of variance did not increase significantly, ΔR2
= .01, p = .77. The final model accounted for only 4% of the variance, F(4, 90) = 1.03, p = .40.
In the second regression predicting time on the intermediate version of the Beads Task, the DASS (Step 1) did not account for significant variance (R2 = .01; p = .34). When the IU self-report measures were added in Step 2, the amount of variance did not increase significantly, ΔR2 = .03, p = .39. The final model accounted for only 4% of the variance, F(4, 90) = .99, p = . 42.
In the third regression predicting time on the difficult version of the Beads Task, the DASS (Step 1) did not account for significant variance (R2 < .001; p = .99). When the IU self-report measures were added in Step 2, the amount of variance did not increase significantly, ΔR2 = .01, p = .82. The final model only accounted for 1% of the variance, F(4, 90) = .23, p = .92.
Predicting Distress after Decision. In the first regression predicting distress after having
decided on the easy version of the Beads Task, the DASS (Step 1) accounted for significant variance (R2 = .12; p = .001). When the IU self-report measures were added in Step 2, the amount of variance did not increase significantly, ΔR2 = .03, p = .35. The final model accounted for 15% of the variance, F(4, 90) = 3.97, p = .005.
In the second regression predicting distress on the intermediate version of the Beads Task, the DASS (Step 1) accounted for significant variance (R2 = .19; p < .001). When the IU self-report measures were added in Step 2, the amount of variance did not increase significantly, ΔR2
In the third regression predicting distress on the difficult version of the Beads Task, the DASS (Step 1) accounted for significant variance (R2 = .24; p < .001). When the IU self-report measures were added in Step 2, the amount of variance increased significantly, ΔR2 = .09, p = .009. Only the OBQ-PC subscale was a significant individual predictor of distress (β = .35, sr = .25, t = 2.87, p = .005). The final model accounted for 33% of the variance, F(4, 90) = 11.05, p < .001.
Anxiety Symptoms Predicting Beads Task Performance
To examine the GAD and OCD symptom measures (DOCS subscales and PSWQ) as predictors of each measure of performance on the Beads Task at the different levels difficulty we conducted a series of hierarchical multiple regression analyses. In each set of regressions, the DASS was entered in Step 1 and the DOCS subscales and the PSWQ were entered
simultaneously in Step 2.
Predicting Draws to Decision. In the first regression predicting DTD on the easy version of the Beads Task, after accounting for the DASS (in Step 1),6 when the anxiety symptom
measures were added in Step 2, the amount of variance did not increase significantly, ΔR2 = .06, p = .38. The final model accounted for only 6% of the variance, F(6, 88) = .89, p = .50.
In the second regression predicting DTD on the intermediate version of the Beads Task, after accounting for the DASS (in Step 1), when the anxiety symptom measures were added in Step 2, the amount of variance did not increase significantly, ΔR2 = .04, p = .62. The final model accounted for only 4% of the variance, F(6, 88) = .62, p = .72.
In the third regression predicting DTD on the difficult version of the Beads Task, after accounting for the DASS (in Step 1), when the anxiety symptom measures were added in Step 2,
6
the amount of variance did not increase significantly, ΔR2 = .11, p = .07. The final model accounted for 11% of the variance, F(6, 88) = 1.77, p = .12.
Predicting Time to Decision. In the first regression predicting time to decision on the easy version of the Beads Task, after accounting for the DASS (in Step 1), when the anxiety symptom measures were added in Step 2, the amount of variance did not increase significantly, ΔR2
= .02, p = .81. The final model accounted for only 6% of the variance, F(6, 88) = .87, p = .52.
In the second regression predicting time on the intermediate version of the Beads Task, after accounting for the DASS (in Step 1), when the anxiety symptom measures were added in Step 2, the amount of variance did not increase significantly, ΔR2 = .08, p = .20. The final model accounted for 9% of the variance, F(6, 88) = 1.41, p = .22.
In the third regression predicting time on the difficult version of the Beads Task, after accounting for the DASS (in Step 1), when the anxiety symptom measures were added in Step 2, the amount of variance did not increase significantly, ΔR2 = .08, p = .23. The final model
accounted for 8% of the variance, F(6, 88) = 1.18, p = .32.
Predicting Distress after Decision. In the first regression predicting distress after having
decided on the easy version of the Beads Task, after the DASS accounted for significant variance (in Step 1), when the anxiety symptom measures were added in Step 2, the amount of variance did not increase significantly, ΔR2
= .04, p = .48. The final model accounted for 16% of the variance, F(6, 88) = 2.84, p = .01.
In the third regression predicting distress on the difficult version of the Beads Task, after the DASS accounted for significant variance (in Step 1), when the anxiety symptom measures were added in Step 2, the amount of variance did not increase significantly, ΔR2 = .06, p = .22. The final model accounted for 30% of the variance, F(6, 88) = 6.14, p < .001.
DISCUSSION
Researchers have repeatedly highlighted the importance of identifying cognitive
processes that span anxiety disorders for the purpose of developing transdiagnostic models and treatments for problems with anxiety (e.g., Barlow, Allen, & Choate, 2004). IU is one such process that appears to be associated with various anxiety disorders; yet to date, IU is only reliably measured using self-report instruments. In vivo tasks, such as the Beads Task, that induce uncertainty in the laboratory could therefore provide novel methods for examining the behavioral correlates of IU across anxiety disorders and contribute to theoretical formulations of these problems. In the current study, participants appeared to follow the task instructions, and they indicated that identifying the correct jar was moderately important to them. In addition, as expected, the more difficult versions of the task were associated with less certainty and
confidence in decisions, suggesting that the tasks induced uncertainty as they became progressively more difficult.
studies between diagnostic groups on DTD were quite small, e.g., ≤ 1 bead (Fear & Healy, 1997; Huq et al., 1988). Thus, the current study adds to the literature and calls into question whether behavioral responses are clinically useful in differentiating those with anxiety disorders from NACs.
In exploratory analyses examining time to decision and distress after having decided, participants took more time to decide and were more distressed following their decision the more difficult the Beads Task version. Although there were no group differences on time, individuals in the GAD and OAD groups were significantly more distressed after completing the task than those in the NAC group. Sternheim, Startup and colleagues (2011) were the first to look at self-reported distress on the Beads Task in a sample of individuals with eating disorders. The differences in the current study are in line with their previous findings that individuals with eating disorders are more distressed than healthy controls on the Beads Task (Sternheim, Startup, et al., 2011).
In exploratory analyses, we found that self-reported IU was similarly not associated with time to decision, but was positively associated with level of distress after having decided on all three versions of the task; and this relationship remained even after controlling for general depression, anxiety and stress for the difficult task version. In addition, the OBQ-PC emerged as a significant individual predictor of task-related distress. Why did the OBQ-PC but not the IUS-12 uniquely predict decision-related distress? While both measures assess uncertainty-related cognitions and are strongly correlated, they are not completely redundant (r = .67 in the current study). Indeed, these measures were developed by teams of GAD and OCD researchers
respectively who conceptualized and defined IU in slightly different ways. While the IUS-12 items measure the variety of ways that people “react to the uncertainties of life,” the OBQ-PC assesses perfectionism/certainty as “attitudes or beliefs that people sometimes hold.” As has been suggested by previous researchers (Gentes & Ruscio, 2011), when similar items are compared on these two measures, the OBQ tends to be worded more severely than the IUS. Finally, the IUS-12 simply measures uncertainty cognitions while the empirically derived OBQ-PC subscale measures both uncertainty and perfectionism (which were determined to be a single construct using factor analytic methods).
Contrary to our hypotheses, responsibility/checking concerns and worry were not
Our exploratory analyses also suggested that self-report symptom measures were not associated with time to decision. In contrast, participants’ self-reported levels of general depression, anxiety, and stress were positively associated with distress following all three versions of the Beads Task. OCD-related symptoms of responsibility for harm were associated with distress after deciding on the difficult version of the task, but this relationship disappeared after controlling for general depression, anxiety, and stress. Similarly, symptoms of worry were positively associated with distress following all three task versions, but this relationship again disappeared after controlling for depression, anxiety, and stress. This pattern of findings suggests that while symptoms of OCD and GAD are related to distress on the Beads Task, decision-related distress is better accounted for by general distress measures than by disorder-specific symptoms.
Overall, therefore, it appears that while the Beads Task successfully induced task-related uncertainty in the laboratory as the probabilistic decision became progressively more difficult, one’s general cognitive bias of IU did not predict performance on this task on either of the observable performance related measures (DTD and time to decision). IU did, however, predict one’s subjective experience of in vivo distress after having decided (even after controlling for
general depression, anxiety, and stress on the difficult task version). These two findings suggest that it is the emotional response to the Beads Task, as opposed to the observed behavioral responses (i.e., DTD, time to decision), that has diagnostic validity and is related to self-report IU.
The findings of this study raise several avenues for future research in the area of
upon debriefing that they were not distressed by the task). Thus, incentives for identifying the correct answer (e.g., money, Ladouceur et al., 2000; Luhmann, Ishida, & Hajcak, 2011), or more aptly for anxiety disorders, pairing a negative stimulus with incorrect answers (e.g., a mild electric shock, Nelson & Shankman, 2011), might amplify the distress participants feel when making their decision. Future work could also design IU related tasks that are more personally relevant to disorder specific concerns, such as whether one correctly turned off the stove. Despite existing research in this area (Fitch & Cougle, 2013; Foa et al., 2003), to date no studies have used an idiographic approach to stimuli selection, which would maximize external validity of these tasks.
Furthermore, future research might explore additional self-report constructs that may better explain Beads Task performance. Need for cognitive closure (Webster & Kruglanski, 1994), for example, is a cognitive construct related to IU (Berenbaum, Bredemeier, & Thompson, 2008) that is defined as the desire for “an answer on a given topic, any
answer…compared to confusion and ambiguity” (Kruglanski, 1990). It may be that certain individuals have a decision-making style that involves requesting more and more information in order to feel certain, whereas others use a more avoidant technique and make a quick decision in order to avoid the uncertainty itself (and these opposite styles in responding may have
The present study has a number of limitations that should be considered. First, only the anxiety disorder modules of the MINI were administered, thus it is unknown what co-occurring conditions participants were struggling with (e.g., depression). Second, the sample had relatively high comorbidity, with a substantial proportion of individuals meeting criteria for more than one anxiety disorder. This prevented assigning participants to mutually exclusive diagnostic groups. Third, due to the relatively modest sample size, individuals in the OAD group were combined rather than considered individually. Fourth, the NAC group was significantly younger and had significantly fewer years of education than the clinical groups. However, we had no a priori reason to believe that age or years of education would be related to performance on the Beads Task. Finally, the sample was primarily Caucasian, which may limit the generalizability of the results to other racial/ethnic groups. The literature to date suggests that there are not differences in IU based on race and ethnicity (Norton, 2005), although more research in this area is certainly needed.
APPENDIX A: SCRIPT FOR THE BEADS TASK Low Uncertainty Version (85:15)
“There are two jars that each contain 100 beads. The mainly blue jar has 85 blue beads and 15 red beads. The mainly red jar has 85 red beads and 15 blue beads. The beads have been mixed up in the jars.
One of the jars has been chosen at random. Both jars have an equal probability of being selected (50:50). Beads will be drawn from the selected jar and shown on the screen. The beads will always come from the same jar and will be put back in the jar afterwards so that the proportions of beads always stays the same. The jar will be shaken up between each draw.
It is your job to decide which jar the beads have come from. You may see as many beads as you like before making a decision. The beads you have seen from previous trials will be displayed at the bottom of the screen to help with your decision.
After each bead has been shown on the screen, you can either: (1) Ask for another bead by pressing the space bar once, OR (2) You can tell me that you know which jar the beads are coming from and whether it is the mainly red jar or the mainly blue jar.
Remember: The beads will always come from the same jar; the beads will be put back in the same jar afterwards; you can see as many beads as you like before you decide which jar the beads are coming from; only decide when you are as certain as possible. Do you have any questions?”
APPENDIX B: DEBRIEFING FORM Probability and Decision-Making
Thank you for participating in this research study. This handout is provided to tell you a little more about the purpose of the study.
In this experiment, we are studying how people complete a probability decision-making task known as the Beads Task. In particular, we are interested in what factors may influence how many beads people need to see before they are ready to decide from which jar the series of beads are being drawn. Some of the factors we are investigating that may influence performance on this task are depression and anxiety symptoms, stress, worry, and a variety of cognitive beliefs. One cognitive belief we are particularly interested in learning more about is intolerance of uncertainty (IU). Individuals who are high in intolerance of uncertainty find uncertainty to be stressful, upsetting, and negative. They also may have difficulty functioning in uncertain or ambiguous situations. Thus, we are interested in how people who are high in IU perform the three different levels of uncertainty of this task: (a) an easy or low uncertainty version, (b) a medium or intermediate uncertainty version, and (c) a hard or high uncertainty version. Requests to see additional beads can be conceptualized as a measure of IU, with individuals high in
intolerance of uncertainty needing to see more beads before feeling “certain” about making a decision.
Previous research has demonstrated that individuals with obsessive-compulsive disorder (OCD) and generalized anxiety disorder (GAD) have high self-report ratings of IU, perhaps even more so than patients with other anxiety disorders. Undergraduates enrolled in Psychology 101, and individuals with an anxiety disorder diagnosis (including OCD and GAD) will be completing this study in order to see whether there are any differences between these groups, and whether there are any specific symptom dimensions that are associated with performance on this task. If you would like more information about the study or if you have any questions or concerns, please write to Ryan Jane Jacoby ([email protected]) or Dr. Jon Abramowitz
([email protected]), the principal researchers for this study. If you are interested in being sent a copy of the report written from this study data, you may also email Ryan.
If you feel that you would like additional help or a counseling referral, you may contact the UNC Counseling and Wellness Center (919-966-3658) or the Evergreen Psychology Clinic (919-962-6906).
REFERENCES
Abramowitz, J. S., & Deacon, B. J. (2006). Psychometric properties and construct validity of the Obsessive-Compulsive Inventory-Revised: Replication and extension with a clinical sample. Journal of Anxiety Disorders, 20(8), 1016–1035.
Abramowitz, J. S., Deacon, B. J., Olatunji, B. O., Wheaton, M. G., Berman, N. C., Losardo, D., … Hale, L. R. (2010). Assessment of obsessive-compulsive symptom dimensions: Development and evaluation of the Dimensional Obsessive-Compulsive Scale. Psychological Assessment, 22(1), 180–198.
Abramowitz, J. S., Nelson, C. A., Purdon, C., Antony, M. M., & Summerfeldt, L. J. (2007). Treating doubting and checking concerns. In M. M. Antony, C. Purdon, & L. J. Summerfeldt (Eds.), Psychological treatment of obsessive-compulsive disorder:
Fundamentals and beyond. (pp. 169–186). Washington, DC US: American Psychological Association.
Antony, M. M., Bieling, P. J., Cox, B. J., Enns, M. W., & Swinson, R. P. (1998). Psychometric properties of the 42-item and 21-item versions of the Depression Anxiety Stress Scales in clinical groups and a community sample. Psychological Assessment, 10(2), 176–181. Barlow, D. H., Allen, L. B., & Choate, M. L. (2004). Toward a unified treatment for emotional
disorders. Behavior Therapy, 35(2), 205–230.
Baumeister, R. F., Vohs, K. D., & Funder, D. C. (2007). Psychology as the science of self-reports and finger movements: Whatever happened to actual behavior? Perspectives on Psychological Science, 2(4), 396–403. doi:10.1111/j.1745-6916.2007.00051.x
Bensi, L., & Giusberti, F. (2007). Trait anxiety and reasoning under uncertainty. Personality and Individual Differences, 43(4), 827–838.
Berenbaum, H., Bredemeier, K., & Thompson, R. J. (2008). Intolerance of uncertainty: Exploring its dimensionality and associations with need for cognitive closure, psychopathology, and personality. Journal of Anxiety Disorders, 22(1), 117–125.
Birrell, J., Meares, K., Wilkinson, A., & Freeston, M. (2011). Toward a definition of intolerance of uncertainty: A review of factor analytical studies of the Intolerance of Uncertainty Scale. Clinical Psychology Review, 31(7), 1198–1208. doi:10.1016/j.cpr.2011.07.009 Boelen, P. A., & Carleton, R. N. (2012). Intolerance of uncertainty, hypochondriacal concerns,
obsessive-compulsive symptoms, and worry. Journal of Nervous and Mental Disease, 200(3), 208–213. doi:10.1097/NMD.0b013e318247cb17
Brown, T. A., Antony, M. M., & Barlow, D. H. (1992). Psychometric properties of the Penn State Worry Questionnaire in a clinical anxiety disorders sample. Behaviour Research and Therapy, 30(1), 33–37.
Buhr, K., & Dugas, M. J. (2002). The Intolerance of Uncertainty Scale: Psychometric properties of the English version. Behaviour Research and Therapy, 40(8), 931–946.
Buhr, K., & Dugas, M. J. (2006). Investigating the construct validity of intolerance of
uncertainty and its unique relationship with worry. Journal of Anxiety Disorders, 20(2), 222–236.
Calleo, J. S., Hart, J., Björgvinsson, T., & Stanley, M. A. (2010). Obsessions and worry beliefs in an inpatient OCD population. Journal of Anxiety Disorders, 24(8), 903–908.
Carleton, R. N., Collimore, K. C., & Asmundson, G. J. G. (2010). “It’s not just the judgments - It’s that I don’t know”: Intolerance of uncertainty as a predictor of social anxiety. Journal of Anxiety Disorders, 24(2), 189–195. doi:10.1016/j.janxdis.2009.10.007
Carleton, R. N., Gosselin, P., & Asmundson, G. J. G. (2010). The intolerance of uncertainty index: Replication and extension with an English sample. Psychological Assessment, 22(2), 396–406. doi:10.1037/a0019230
Carleton, R. N., Mulvogue, M. K., Thibodeau, M. A., McCabe, R. E., Antony, M. M., & Asmundson, G. J. G. (2012). Increasingly certain about uncertainty: Intolerance of uncertainty across anxiety and depression. Journal of Anxiety Disorders, 26(3), 468–479. doi:10.1016/j.janxdis.2012.01.011
Carleton, R. N., Norton, M. A. P., & Asmundson, G. J. G. (2007). Fearing the unknown: A short version of the Intolerance of Uncertainty Scale. Journal of Anxiety Disorders, 21(1), 105–117. doi:10.1016/j.janxdis.2006.03.014
De Bruin, G. O., Rassin, E., & Muris, P. (2006). Worrying in the lab: Does intolerance of uncertainty have predictive value? Behaviour Change, 23(2), 138–147.
doi:10.1375/bech.23.2.138
Deacon, B., & Abramowitz, J. S. (2008). Is hypochondriasis related to obsessive compulsive-disorder, panic compulsive-disorder, or both? An empirical evaluation. Journal of Cognitive Psychotherapy, 22(2), 115–127.
Deckersbach, T., Otto, M. W., Savage, C. R., Baer, L., & Jenike, M. A. (2000). The relationship between semantic organization and memory in obsessive-compulsive disorder.
Psychotherapy and Psychosomatics, 69(2), 101–107.
Dugas, M. J., Freeston, M. H., & Ladouceur, R. (1997). Intolerance of uncertainty and problem orientation in worry. Cognitive Therapy and Research, 21(6), 593–606.
Dugas, M. J., Gosselin, P., & Ladouceur, R. (2001). Intolerance of uncertainty and worry:
Investigating specificity in a nonclinical sample. Cognitive Therapy and Research, 25(5), 551–558.
Dugas, M. J., Marchand, A., & Ladouceur, R. (2005). Further validation of a
cognitive-behavioral model of generalized anxiety disorder: Diagnostic and symptom specificity. Journal of Anxiety Disorders, 19(3), 329–343.
Dugas, M. J., Savard, P., Gaudet, A., Turcotte, J., Laugesen, N., Robichaud, M., … Koerner, N. (2007). Can the components of a cognitive model predict the severity of generalized anxiety disorder? Behavior Therapy, 38(2), 169–178.
Dugas, M. J., Schwartz, A., & Francis, K. (2004). Intolerance of uncertainty, worry, and depression. Cognitive Therapy and Research, 28(6), 835–842.
Fear, C. F., & Healy, D. (1997). Probabilistic reasoning in obsessive-compulsive and delusional disorders. Psychological Medicine, 27(1), 199–208.
Fergus, T. A., & Valentiner, D. P. (2011). Intolerance of uncertainty moderates the relationship between catastrophic health appraisals and health anxiety. Cognitive Therapy and Research, 35(6), 560–565. doi:10.1007/s10608-011-9392-9
Fergus, T. A., & Wu, K. D. (2010). Do symptoms of generalized anxiety and
obsessive-compulsive disorder share cognitive processes? Cognitive Therapy and Research, 34(2), 168–176.
Fitch, K. E., & Cougle, J. R. (2013). An evaluation of obsessive beliefs as predictors of performance on in vivo assessments of obsessive–compulsive symptoms. Cognitive Therapy and Research, 37(2), 207–220. doi:10.1007/s10608-012-9457-4
Foa, E. B., Huppert, J. D., Leiberg, S., Langner, R., Kichic, R., Hajcak, G., & Salkovskis, P. M. (2002). The Obsessive-Compulsive Inventory: Development and validation of a short version. Psychological Assessment, 14(4), 485–496.
Foa, E. B., Mathews, A., Abramowitz, J. S., Amir, N., Przeworski, A., Filip, J. C., & Alley, A. (2003). Do patients with obsessive-compulsive disorder have deficits in decision-making? Cognitive Therapy and Research, 27(4), 431–445.
Freeston, M. H., Rhéaume, J., Letarte, H., & Dugas, M. J. (1994). Why do people worry? Personality and Individual Differences, 17(6), 791–802.
Gentes, E. L., & Ruscio, A. M. (2011). A meta-analysis of the relation of intolerance of
Grenier, S., & Ladouceur, R. (2004). Manipulation of intolerance of uncertainty and worries. Canadian Journal of Behavioural Science/Revue canadienne des sciences du
comportement, 36(1), 56–65. doi:10.1037/h0087216
Helsen, K., Van, den B., Vlaeyen, J. W. S., & Goubert, L. (2013). Confirmatory factor analysis of the Dutch Intolerance of Uncertainty Scale: Comparison of the full and short version. Journal of Behavior Therapy and Experimental Psychiatry, 44(1), 21–29.
doi:10.1016/j.jbtep.2012.07.004
Holaway, R. M., Heimberg, R. G., & Coles, M. E. (2006). A comparison of intolerance of uncertainty in analogue obsessive-compulsive disorder and generalized anxiety disorder. Journal of Anxiety Disorders, 20(2), 158–174.
Huq, S. F., Garety, P. A., & Hemsley, D. R. (1988). Probabilistic judgments in deluded and non-deluded subjects. The Quarterly Journal of Experimental Psychology A: Human
Experimental Psychology, 40(4), 801–812.
Jacoby, R. J., Fabricant, L. E., Leonard, R. C., Riemann, B. C., & Abramowitz, J. S. (2013). Just to be certain: Confirming the factor structure of the Intolerance of Uncertainty Scale in patients with obsessive-compulsive disorder. Journal of Anxiety Disorders, 27(5), 535– 542. doi:10.1016/j.janxdis.2013.07.008
Khawaja, N. G., & Yu, L. N. H. (2010). A comparison of the 27-item and 12-item Intolerance of Uncertainty Scales. Clinical Psychologist, 14(3), 97–106.
doi:10.1080/13284207.2010.502542
Krohne, H. W. (1993). Vigilance and cognitive avoidance as concepts in coping research. In Attention and avoidance: Strategies in coping with aversiveness. (pp. 19–50). Ashland, OH US: Hogrefe & Huber Publishers.
Kruglanski, A. W. (1990). Motivations for judging and knowing: Implications for causal
attribution. In E. T. Higgins & R. M. Sorrentino (Eds.), The handbook of motivation and cognition: Foundation of social behavior (Vol. 2, pp. 333–368). New York: Guilford Press.
Ladouceur, R., Gosselin, P., & Dugas, M. J. (2000). Experimental manipulation of intolerance of uncertainty: A study of a theoretical model of worry. Behaviour Research and Therapy, 38(9), 933–941.
Ladouceur, R., Talbot, F., & Dugas, M. J. (1997). Behavioral expressions of intolerance of uncertainty in worry. Behavior Modification, 21(3), 355–371.
Lovibond, S. H., & Lovibond, P. F. (1995). Manual for the Depression Anxiety Stress Scales (2nd. Ed.). Sydney: Psychology Foundation.
Mahoney, A. E. J., & McEvoy, P. M. (2012). A transdiagnostic examination of intolerance of uncertainty across anxiety and depressive disorders. Cognitive Behaviour Therapy, 41(3), 212–222. doi:10.1080/16506073.2011.622130
McEvoy, P. M., & Mahoney, A. E. J. (2011). Achieving certainty about the structure of intolerance of uncertainty in a treatment-seeking sample with anxiety and depression. Journal of Anxiety Disorders, 25(1), 112–122. doi:10.1016/j.janxdis.2010.08.010 McEvoy, P. M., & Mahoney, A. E. J. (2012). To be sure, to be sure: Intolerance of uncertainty
mediates symptoms of various anxiety disorders and depression. Behavior Therapy, 43(3), 533–545. doi:10.1016/j.beth.2011.02.007
McKay, D., Abramowitz, J. S., Calamari, J. E., Kyrios, M., Radomsky, A., Sookman, D., … Wilhelm, S. (2004). A critical evaluation of obsessive-compulsive disorder subtypes: Symptoms versus mechanisms. Clinical Psychology Review, 24(3), 283–313.
doi:10.1016/j.cpr.2004.04.003
Meyer, T. J., Miller, M. L., Metzger, R. L., & Borkovec, T. D. (1990). Development and validation of the Penn State Worry Questionnaire. Behaviour Research and Therapy, 28(6), 487–495.
Milner, A. D., Beech, H. R., & Walker, V. J. (1971). Decision processes and obsessional behaviour. British Journal of Social & Clinical Psychology, 10(1), 88–89.
Molina, S., & Borkovec, T. D. (1994). The Penn State Worry Questionnaire: Psychometric properties and associated characteristics. In G. C. L. Davey & F. Tallis (Eds.), Worrying: Perspectives on theory, assessment and treatment. (pp. 265–283). Oxford England: John Wiley & Sons.
Nelson, B. D., & Shankman, S. A. (2011). Does intolerance of uncertainty predict anticipatory startle responses to uncertain threat? International Journal of Psychophysiology, 81(2), 107–115. doi:10.1016/j.ijpsycho.2011.05.003
Norton, P. J. (2005). A psychometric analysis of the Intolerance of Uncertainty Scale among four racial groups. Journal of Anxiety Disorders, 19(6), 699–707.
doi:10.1016/j.janxdis.2004.08.002
Norton, P. J., Sexton, K. A., Walker, J. R., & Norton, G. R. (2005). Hierarchical model of vulnerabilities for anxiety: Replication and extension with a clinical sample. Cognitive Behaviour Therapy, 34(1), 50–63.
Obsessive Compulsive Cognitions Working Group. (1997). Cognitive assessment of obsessive-compulsive disorder. Behaviour Research and Therapy, 35(7), 667–681.