PAPER-BASED AMBIENT IONIZATION MASS SPECTROMETRY TECHNIQUES FOR REGULATORY, ENVIRONMENTAL, AND AGRICULTURAL CHALLENGES
Steven L. Reeber
A dissertation submitted to the Faculty at the University of North Carolina at Chapel Hill in partial fulfillment of the requirements for the degree of Doctor of Philosophy in the
Department of Chemistry (Analytical) in the College of Arts and Sciences.
Chapel Hill 2016
Approved by:
Gary L. Glish
James W. Jorgenson
Jillian L. Dempsey
Leslie M. Hicks
ABSTRACT
Steven L. Reeber: Paper-Based Ambient Ionization Mass Spectrometry Techniques for Regulatory, Environmental, and Agricultural Challenges
(Under the direction of Gary L. Glish)
Sample collection techniques based on the use of a paper substrate have been used in
a variety of applications, perhaps most notably in neonatal screening using dried blood spots.
These techniques provide a simple and inexpensive way of collecting material for later
chemical analysis. The utility of paper-based sample collection is dramatically enhanced by
combining it with ambient ionization techniques for mass spectrometry, generating gas phase
ions directly from the paper substrate without the sample preparation and separations
typically employed. These ions may then be analyzed by a mass spectrometer to detect the
compounds of interest.
In this work, two ambient ionization methods are explored for the ionization of
samples collected on paper substrates. Paper spray ionization is an ambient ionization
technique in which a spray of charged droplets is generated from a piece of paper cut to a
sharp point. A custom paper spray ion source has been designed and built, and used to
explore the potential of paper spray ionization-mass spectrometry for pesticide residue
analysis applications. Additionally, the first commercial paper spray ion source has recently
been released. An evaluation unit was characterized and compared to the custom paper spray
ion source. Using this commercial system, automated methods were developed and used for
pesticide formulations. These formulations are highly challenging matrices that typically
require sample clean-up and the use of separation techniques; using paper spray ionization a
simple dilution in acetonitrile was sufficient to enable analysis.
In addition to paper spray ionization, a novel ionization technique was developed to
ionize compounds collected on paper matrices. This technique, nib-based electrospray
ionization (nibESI) avoids the need to cut the paper to a sharp point by generating the
electrospray from a sharpened fountain pen nib. This technique is characterized and applied
to the analysis of therapeutic drugs and nicotine in a variety of different matrices including
ACKNOWLEDGMENTS
Thanks first to my parents, Dave and Tracy, for encouraging me to be curious and not
to give up on finding out how and why, while at the same time challenging my assumptions
and lazy thinking. Your unceasing love and support has always been a source of strength and
peace.
I would like to thank my advisor, Prof. Gary Glish, for his encouragement and
support over the past five years. Gary, you’ve been an incredible mentor, and I can’t imagine
how you could have been more supportive. The opportunities I’ve had in your lab are
extraordinary, and your advocacy for all your students is exceptional.
Thanks to all the members of the Glish lab – you are why it’s an amazing place to
work. Thank you for keeping it a healthy, respectful, and positive community, and for all
your editing and support.
Thanks to Dr. Sung-Ben Huang and Bill Eberle of Syngenta Crop Protection and
Donna Hollinshead of Prosolia for their support, encouragement and advocacy throughout
our work with paper spray.
Matt, Greg, Lindsay, Billy, and Tim – true friends and companions. I miss you all
already.
Sandi – thank you very much for all your friendship, support, and encouragement.
Finally, Katherine – light of my eyes, joy of my heart. Thank you for all your love
TABLE OF CONTENTS
LIST OF FIGURES ………. xi
LIST OF TABLES ………. xiv
LIST OF SYMBOLS AND ABBREVIATIONS ……… xv
CHAPTER 1: PAPER-BASED SAMPLING METHODS FOR ANALYTICAL CHEMISTRY ………... 1
1.1 Introduction to Paper-Based Sampling Methods ……… 1
1.2 Conventional Analysis of Samples Collected on Paper ……….………. 3
1.3 Ionization Techniques for Mass Spectrometry ………... 6
1.3.1 Conventional Ion Sources ……….... 6
1.3.2 Ambient Ionization ……….. 8
1.3.3 Ambient Ionization from Paper Matrices ………. 9
1.4 Environmental and Agricultural Applications of Paper-Based Sampling ………. 11
1.5 Summary and Outline ………... 12
References ……….. 15
CHAPTER 2: DESIGN AND CHARACTERIZATION OF A PAPER SPRAY ION SOURCE ………... 21
2.1 Introduction ……….. 21
2.1.1 General Paper Spray Ion Source Design ……… 22
2.1.2 Paper Spray Ionization Mechanism ……… 23
2.2 Materials and Operating Parameters ………. 24
2.2.2 Instrument Parameters ………... 25
2.3 Paper Spray Ion Source Development ………... 26
2.3.1 Mark 1 Ion Source ……….. 26
2.3.2 Mark 2 Ion Source ……….. 29
2.3.3 Characterization of the Mark 2 Ion Source ………. 30
2.3.4 Mark 3 Ion Source ……….. 34
2.3.5 Characterization of the Mark 3 Ion Source ………. 36
2.3.6 Substrate Characterization ………. 39
2.4 Summary and Conclusions ……… 44
References ……….. 46
CHAPTER 3: MEASUREMENT OF HERBICIDES IN WATER AND CROP EXTRACTS BY PAPER SPRAY IONIZATION MASS SPECTROMETRY …….. 48
3.1 Introduction ……….. 48
3.2 Instrumentation, Materials, and Methods ………. 50
3.2.1 Materials ……… 50
3.2.2 Instrumentation ……….. 51
3.2.3 Sample Preparation ……… 52
3.3 Herbicides in Environmental and Agricultural Matrices ………... 52
3.4 Quantification of Herbicides ………. 57
3.5 Summary and Conclusions ……… 66
References ……….. 68
CHAPTER 4: CHARACTERIZATION OF A COMMERCIAL PAPER SPRAY ION SOURCE ……… 72
4.2 Chemicals and Equipment ………. 73
4.3 The Velox 360 Ion Source ………. 74
4.4 Testing Methodology ……… 78
4.5 Characterization of the Velox 360 ………. 79
4.5.1 Preliminary Testing ……… 79
4.5.2 Errors, Malfunctions, and Design Issues ……… 83
4.5.3 Direct Comparison to a Custom Paper Spray Source ………. 87
4.5.4 Analysis of Multiple Analytes ……… 90
4.5.5 Triple Quadrupole Experiments ………. 91
4.5.6 Automated Data Analysis ……….. 93
4.6 Summary and Conclusions ……… 96
References ……….. 98
CHAPTER 5: PAPER SPRAY IONIZATION-MASS SPECTROMETRY FOR ANALYSIS OF COMMERCIAL PESTICIDE FORMULATIONS……….. 99
5.1 Introduction ……….. 99
5.2 Materials and Methods ……… 101
5.3 Preliminary Experiments ……… 102
5.4 Formulation Blanks ………. 104
5.5 Formulations with Active Ingredients ………. 111
5.6 Summary and Conclusions ……….. 119
References ……… 121
CHAPTER 6: NIB-BASED ELECTROSPRAY IONIZATION FOR SIMULTANEOUS ELUTION AND IONIZATION FROM PAPER SAMPLING MEDIA ……… 124
6.2 Experimental Materials, Methods, and Equipment ………. 127
6.2.1 Materials ……….. 127
6.2.2 Ion Source Design ……… 127
6.2.3 Sample Preparation ……….. 129
6.3 Results and Discussion ……… 130
6.3.1 Solvents and Voltages ……….. 130
6.3.2 Preliminary Testing with Mass Spectrometry ……….. 133
6.3.3 Biological Matrices ……….. 135
6.3.4 Quantification of Nicotine in Saliva ………. 136
6.4 Conclusions ……… 139
References ……… 141
CHAPTER 7: FUTURE DIRECTIONS FOR PAPER-BASED SAMPLING WITH AMBIENT IONIZATION-MASS SPECTROMETRY ………... 145
7.1 Summary ………. 145
7.2 Ongoing Work with Pesticide Formulations ………... 147
7.3 Future Prospects for Paper Spray Ionization ………... 148
7.4 Future Directions in NibESI ……… 151
7.5 Conclusions ……… 153
References ……… 156
APPENDIX A: MOLECULAR STRUCTURES OF ANALYTES AND INTERNAL STANDARDS ………. 158
LIST OF FIGURES
Figure 1.1 - Dried blood spot collection card used for newborn screening ……….. 1
Figure 1.2 - Noviplex plasma collection card ………... 2
Figure 2.1 - Mark 1 paper spray ion source ………. 27
Figure 2.2 - Substrate cutting schematic for Mk. 1 and Mk. 2 ion sources ………. 27
Figure 2.3 - Total and extracted ion current for the Mk. 1 ion source ………. 28
Figure 2.4 - Mark 2 paper spray ion source ……… 29
Figure 2.5 - Total and extracted ion current for the Mk. 2 ion source ………. 30
Figure 2.6 - Paper spray ionization mass spectra of 1 ppm metolachlor using methanol vs. acetonitrile spray solvent ………. 32
Figure 2.7 - Effect of washing paper spray substrates on atrazine signal intensity and background ions ………. 33
Figure 2.8 - Mark 3 ion source ……… 35
Figure 2.9 - Substrate geometry used with the Mk. 3 ion source ……… 36
Figure 2.10 - Mass spectra of 100 ppm atrazine analyzed using the Mk. 3 ion source ……... 37
Figure 2.11 - Effects of sample application order ………... 39
Figure 2.12 - Effects of nitric acid treatment of substrates illustrated with atrazine and metolachlor ………. 42
Figure 2.13 - Effect of trimethylsilylation of substrates illustrated with atrazine, propazine, and metolachlor ………. 44
Figure 3.1 - Paper spray ionization MS/MS spectra of 100 ppb atrazine and propazine in surface water ……….. 54
Figure 3.2 - Paper spray ionization mass spectrum of triazines and metolachlor in wheat forage extract ……… 55
Figure 3.3 - Paper spray ionization MS/MS spectra of metolachlor at part-per-billion concentrations in lettuce extract ………. 56
Figure 3.5 - Calibration curves for atrazine in lettuce and soil extracts ……….. 60
Figure 3.6 - Calibration curve for atrazine in surface water ……… 61
Figure 3.7 - Calibration curve for propazine in ground water ………. 64
Figure 3.8 - Calibration curve for metolachlor in surface water ………. 64
Figure 4.1 - Prosolia Velox 360 commercial paper spray ion source ……….. 74
Figure 4.2 - Velox 360 mounting flange ………. 75
Figure 4.3 - Paper spray cartridge used with the Velox 360 ion source ……….. 76
Figure 4.4 - Interior of the Velox 360 ion source ……… 77
Figure 4.5 - Total ion current trace for atrazine analyzed using the Velox 360 paper spray ion source ……… 80
Figure 4.6 - Mass spectrum of atrazine analyzed using the Velox 360 ……….. 83
Figure 4.7 - Detail of high voltage contacts on the Velox 360 and Thermo ESI sources ….. 85
Figure 4.8 - The Velox 360 carousel drive system ………. 86
Figure 4.9 - Comparison of calibration curves for atrazine in water generated using the custom source and the Velox 360 source ………. 87
Figure 4.10 - Calibration curves for atrazine, simazine, desethyl-atrazine, and desisopropyl-atrazine in water generated using the Velox 360 ion source …………. 94
Figure 4.11 - Parameters to be adjusted in the Thermo Xcalibur data analysis software to enable automated peak integration ………... 95
Figure 4.12 - Advanced peak detection parameters in the Thermo Xcalibur software ……... 95
Figure 5.1 - Paper spray ionization mass spectrum of Karate EC formulation spiked with malathion ………... 103
Figure 5.2 - Paper spray ionization mass spectra of four formulation blanks ……….. 105
Figure 5.3 - Mass spectra of formulation blank #3 spiked with 10 ppm atrazine …………. 107
Figure 5.5 - MS/MS spectra (protonated atrazine and metolachlor) of samples
of spiked formulation blank #6, diluted 10- or 100-fold ……… 111
Figure 5.6 - Total ion current trace for paper spray ionization-mass spectrometry
of Quilt XCEL fungicide, ionized using the Velox 360 ……… 112
Figure 5.7 - Total ion current traces for Quilt XCEL samples spiked with atrazine,
diluted 10- and 100-fold ……… 113
Figure 5.8 - Mass spectra of Quilt XCEL samples spiked with atrazine, diluted
10- and 100-fold ……… 115
Figure 5.9 - Signal intensity ratios (atrazine:atrazine-d5 internal standard) for
atrazine spiked into Quilt XCEL samples diluted 100-fold and analyzed
using a TSQ Quantum Ultra triple quadrupole mass spectrometer ……… 116
Figure 5.10 - Calibration curves for atrazine spiked into Quilt XCEL, analyzed
using several spray solvents ……….. 117
Figure 6.1 - Diagram of nibESI ion source ……… 125
Figure 6.2 - Optical microscope image of the tip of the sharpened fountain pen
nib used in the nibESI ion source ……….. 127
Figure 6.3 - The nibESI source positioned at the inlet to the Bruker HCTultra
mass spectrometer ………. 128
Figure 6.4 - Spray plume from the nibESI ion source, illuminated with a laser ……… 131
Figure 6.5 - NibESI mass spectra of 10 µM lidocaine in water, on Noviplex cards ………. 133
Figure 6.6 - NibESI mass spectra of 100 µM atropine in water, on Noviplex cards ……… 134
Figure 6.7 - NibESI mass spectra of 100 µM lidocaine in human saliva, collected
on Noviplex cards ………. 136
Figure 6.8 – NibESI-MS of 100 µM lidocaine and atropine in adult bovine serum ………. 137
Figure 6.9 - NibESI mass spectra of nicotine and nicotine-d4 in human saliva ………. 138
LIST OF TABLES
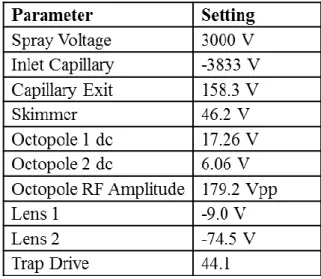
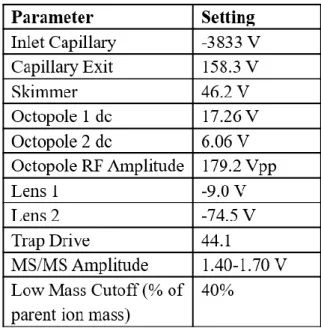
Table 2.1 - Typical instrument settings for analysis of atrazine and metolachlor
using the custom paper spray ion source ………. 25
Table 3.1 - Typical mass spectrometer operating parameters for paper spray
ionization-mass spectrometry analysis of atrazine and metolachlor ……….. 51
Table 3.2 - Linear fits for atrazine calibration curve data generated using
three weighting parameters ………. 62
Table 3.3 - Quality control measurements for atrazine in surface water,
calculated using three weighting parameters ………... 62
Table 3.4 - Quality control measurements for metolachlor in surface water,
calculated using three weighting parameters ………... 65
Table 3.5 - Linear fits for metolachlor calibration curve data, calculated using
three weighting values ……… 65
Table 4.1 - Typical LTQ-FT XL mass spectrometer tuning parameters for
analysis of atrazine using the Velox 360 ………. 73
Table 4.2 - Atrazine/atrazine-d5 signal ratios at low concentrations, measured
using both the custom paper spray ion source and the Velox 360 ………... 88
Table 4.3 - Measured concentrations of atrazine in 400 ppb samples prepared
with and without propazine ………. 91
Table 4.4 - TSQ Quantum Ultra tuning parameters ……… 92
Table 4.5 - Analyte-dependent settings used for analysis of atrazine, simazine,
and metabolites with the Velox 360 and TSQ Quantum Ultra ……… 92
Table 4.6 - Limits of detection for atrazine, simazine, and metabolites using
the Velox 360 and TSQ Quantum Ultra ……….. 93
Table 4.7 - Typical settings for automated signal integration for data collected
using the Velox 360 with a triple quadrupole mass spectrometer ………... 96
Table 6.1 - Typical Bruker HCTultra operating parameters for experiments
LIST OF ABBREVIATIONS AND SYMBOLS AA Acetic acid
ABS Acrylonitrile butadiene styrene (a type of plastic)
ACN Acetonitrile
API Atmospheric pressure inlet
BSTFA N,O-Bistrifluoroacetamide
C Concentration
CID Collision-induced dissociation
cm Centimeter(s)
Conc. Concentration
Da Dalton(s) – unit of mass equal to one atomic mass unit
DART Direct analysis in real time (an ionization technique)
DESI Desorption electrospray ionization
ESI Electrospray ionization
eV Electron-volt(s) (unit of energy)
FT-ICR Fourier transform-ion cyclotron resonance (a type of mass analyzer)
g gram(s)
GC Gas chromatography
GC-MS Gas chromatography coupled to mass spectrometry
He-Ne Helium-neon
HPLC High-performance liquid chromatography
IPA Isopropyl alcohol
kV Kilovolt(s)
L Liter(s)
LC Liquid chromatography
LC-MS Liquid chromatography coupled to mass spectrometry
LCD Liquid crystal display
LTPI Low temperature plasma ionization
m2 Square meter(s)
MeOH Methanol
min Minute(s)
Mk. Mark (indicating a design iteration)
mL Milliliter(s)
mM Millimoles-per-liter (millimolar)
mm Millimeter(s)
MRM Multiple reaction monitoring
MS Mass spectrometry
MS/MS Tandem mass spectrometry
MS3 Three stages of mass analysis, with two rounds of controlled dissociation
m/z Mass-to-charge ratio, in daltons per elementary charge unit
n Number of measurements or experiments
nESI Nanoelectrospray ionization
ng Nanogram(s)
nibESI Nib-based electrospray ionization
PEEK Polyether ether ketone (a type of plastic)
P/N Part number
ppb Parts-per-billion
ppm Parts-per-million
ppt Parts-per-trillion
QC Quality control
RSD Relative standard deviation
sec Second(s)
SRM Selected reaction monitoring
Std. Dev. Standard deviation
TIC Total ion current
TMCS Trimethylchlorosilane
USEPA United States Environmental Protection Agency
V Volts
Vpp Peak-to-peak voltage (amplitude of alternating current)
XIC Extracted ion current
10x Ten-fold
100x One hundred-fold
3D Three dimensional
< Less than
> Greater than
# Number
% Percent (parts-per-hundred)
°C Degrees Celsius
µL Microliter(s)
µm Micrometer(s)
CHAPTER 1: PAPER-BASED SAMPLING METHODS FOR ANALYTICAL CHEMISTRY
1.1 Introduction to Paper-Based Sampling Methods
Analytical sample collection techniques based on porous sampling media have a long
and varied history, from filtration-based methods to forensic swabs1,2 to dried blood spots.3,4
Paper in particular is a useful and inexpensive tool for sample collection, and significant
research efforts have been invested in the development of paper-based sampling techniques
for a wide range of applications. Perhaps the most familiar of these applications is dried
blood spot collection for neonatal screening.3,4 This technique uses a thick filter paper as a
sample collection medium, which is used to collect fresh whole blood from a heel prick. A
dried blood spot collection card is shown in
Figure 1.1. After drying at room temperature,
the samples can be stored for several weeks
without notable degradation, and can be
shipped much more easily than their
equivalent in liquid form.4,5 This simple,
low-cost sample collection method has been a
significant element in the development of
universal newborn screening for inborn
disorders, providing a significant
contribution to public health.6
Novel paper-based sampling tools
continue to be developed for applications in
this area, such as the Noviplex sample
collection card recently released by Novilytic,
LLC.7 These cards build on conventional dried
blood spot collection by incorporating a
filtering membrane on top of the paper disc on
which the sample is collected and dried.8 This
filter membrane is engineered to separate cells
from plasma without lysing the red blood
cells. Only the plasma is collected on the
paper disc; the rest of the material is
discarded. Because the number of red blood
cells in a sample of blood varies between
individuals, the presence of these cells can
lead to errors in analytical results when
investigating compounds present in plasma.
The Noviplex cards avoid this problem by
excluding the red blood cells from
collection.7,8
The vast majority of paper-based
sampling applications at present are limited to
the areas of clinical assays and
forensic/security testing. The extension of paper as a sampling tool to other areas thus far has
remained of primarily academic interest, and is directly connected to the development of new
techniques for the analysis of samples collected on paper. The work presented herein is
aimed at the application of paper-based sampling to agricultural and environmental
applications in particular, through the development of ambient ionization-mass spectrometry
techniques that enable analysis of samples on paper directly, with little to no sample
preparation. It is necessary first, however, to consider the established methods used for the
analysis of these samples and how they might be improved.
1.2 Conventional Analysis of Samples Collected on Paper
Conventional methods for analyzing samples collected on paper material rely on first
removing the sample from the paper substrate, typically by elution/extraction in solvent.
Biological samples, such as the dried blood spots used for newborn screening, are generally
processed by punching out a section of the spot and incubating it in solvent to extract the
compounds of interest.4,6 Additional sample preparation steps are frequently employed, such
as liquid/liquid extraction, solid phase extraction, or derivatization.4,6
After any sample preparation, the samples are typically analyzed by mass
spectrometry, generally with gas or liquid chromatography (GC or LC) used as a separation
technique prior to mass analysis.4 Chromatography serves to separate the analyte from
potentially interfering species in the sample at the cost of increased analysis time and
expense. This can be of great importance in complex matrices such as blood or urine, where
significant ionization suppression is frequently observed in the absence of a pre-ionization
clean-up or separation step.9–11 Selectivity in conventional assays is derived from the
Chromatography provides selectivity through reproducible retention times – the analyte
consistently requires the same time to elute from the column, and any signal that does not
correspond to this retention time may be excluded.
The selectivity of MS/MS derives from the dissociation chemistry of the analyte. An
ion is isolated based on its mass-to-charge ratio (m/z) and excited, typically through
collisions with noble gas atoms.12,13 The internal energy of the ion is increased in this manner
until the ion undergoes unimolecular dissociation to form one or more product ions. The
product ion distribution is highly consistent for a given parent ion and internal energy: under
the same excitation conditions, the same parent ion should produce the same product ions in
the same ratios each time. Selectivity is typically obtained in MS/MS experiments by
specifying particular parentproduct transitions and monitoring only those during an
experiment.14 This type of experiment is particularly suited to the triple quadrupole mass
spectrometer, where the first quadrupole is used to select the parent ion, the second as a
collision cell for excitation of the ion, and the third to select the product ion. This operating
mode is called “selected reaction monitoring” (SRM), or if the instrument is set to switch
between multiple parentproduct transitions, “multiple reaction monitoring” (MRM).14
Similar experiments may be performed using other mass analyzers such as quadrupole ion
traps, although in this case the three stages of parent isolation, excitation, and detection of
product ions (ion traps do not generally select a particular product ion, but detect all the
product ions in the trap) are performed sequentially in a single mass analyzer.
There have been ongoing efforts to reduce the time and expense entailed in the
analysis of these samples by various means, including combining experiments into
enhance duty cycle,17,18 and development of automated extraction systems.19 Multiplexed
assay development is the most straightforward approach, measuring multiple analytes
through one LC-MS or GC-MS experiment. This can be very effective, but requires that the
sample preparation techniques used be suitable for all analytes simultaneously.15 The use of
column switching is essentially a duty cycle improvement.17 Since the mass spectrometer is
generally the most expensive component of the analytical apparatus and the analytes
typically elute during only a fraction of the LC run time, an overall improvement in duty
cycle may be obtained by using multiple LC columns with staggered start times, switching
which column is connected to the mass spectrometer.17 This does not reduce the consumables
cost or sample preparation time per sample, but enables the analysis of more samples in a
given amount of mass spectrometer time.
Automated extraction systems are a relatively recent development, used to automate
the entire extraction, sample preparation, and analysis process. They have thus far been
applied only to dried blood spot analysis. These systems operate by clamping a dried blood
spot card between two nozzles and flowing solvent through the card to extract the analyte.19
The analyte may then be mixed with an internal standard, subjected to other automated
sample preparation procedures, and then analyzed by LC-MS.19 These systems are expensive,
but eliminate the hands-on sample preparation used in most other methods.
A more radical approach to reducing the time and expense entailed in the analysis of
samples collected on paper substrates is the development of new ionization techniques to
directly produce gas phase ions from the paper without separate extraction and sample
preparation. This approach has been remarkably fruitful over the past decade, and it is this
1.3 Ionization Techniques for Mass Spectrometry 1.3.1 Conventional Ion Sources
In a typical LC-MS experiment, the analyte is dissolved in a liquid solvent, separated
from other species in a liquid chromatography column, and ionized by electrospray
ionization (ESI) to yield gas phase ions which are then analyzed in a mass spectrometer.
Electrospray ionization was developed in the 1980s and has become the standard atmospheric
pressure ionization technique for many analyte classes.20 The operating principles of
electrospray ionization are based on a spray of charged droplets containing molecules of the
analyte dissolved in solvent.14,21 The solution of analyte in solvent is pumped through a
conductive capillary with a sharp tip, and a potential difference of several kilovolts is applied
between the capillary and the inlet to the mass spectrometer. The electric field is particularly
intense at the sharp tip of the capillary. The intense electric field produces a Taylor cone
from the liquid flowing out of the capillary. Charged droplets are ejected from the cone and
travel towards the inlet of the mass spectrometer, accelerated by the electric field. Most
modern ESI sources employ a nebulizing gas to assist in spray formation; this gas flow is
directed through a nozzle surrounding the ESI capillary emitter and improves the stability of
the electrospray.14
The spray of charged droplets is typically generated at ambient pressure. As the
charged droplets traverse the distance between the emitter and the mass spectrometer inlet,
the solvent in the droplet evaporates.14 This leaves behind a shrinking droplet with increasing
charge density. Eventually, the droplet reaches the Rayleigh limit, the point at which the
ruptures in a “Coulombic explosion.” This rupture forms a number of smaller droplets, which
repeat the process. Eventually, the solvent is evaporated entirely, with the remaining charge
carriers (in positive ion mode, typically protons, but in some cases metal ions or other
adducts) bound to the analyte.14,21 It is this charged species that is detected by the mass
spectrometer.
To enhance the evaporation of solvent, most mass spectrometers employ a flow of
heated gas (“desolvation gas” or “dry gas”), a heated inlet system, or both. The Bruker
HCTultra, the primary mass spectrometer used in chapters 2, 3, and 6 of this dissertation,
uses a flow of heated nitrogen, typically 5 L/min, to both directly aid in desolvation and heat
the inlet capillary. Thermo Scientific mass spectrometers, in contrast, typically do not
employ a desolvation gas flow and instead directly heat the inlet capillary.
An atmospheric pressure interface of some sort is needed to allow gas phase ions
formed by electrospray ionization to enter the vacuum system of the mass spectrometer for
mass analysis. For all the instruments used in this work, the inlet system consists of a
conductance limit to which a voltage is applied; this may be a cone-shaped metal skimmer, as
used in some Waters mass spectrometers, the metallic capillary used in Thermo Scientific
instruments, or a resistive or insulating glass capillary with metallized ends, as used in the
Bruker HCTultra.
While these inlet systems are generally designed for operation with the commercial
electrospray ion sources included with the mass spectrometers, they may be used with a wide
variety of ionization techniques that operate at ambient pressure. All that is required to
operate with these ion sources is that the safety interlocks preventing operation with the
easily adapted to use the various ambient ionization techniques developed for analysis of
compounds with minimal sample preparation, including those used to directly ionize
compounds from paper substrates.
1.3.2 Ambient Ionization
Ambient ionization is a blanket term for a range of methods used to generate gas
phase ions for mass spectrometry at ambient conditions (i.e., atmospheric pressure,
near-ambient temperature) with minimal or no sample preparation and no pre-ionization
separations.23 A wide range of methods have been developed over the past decade, based on
various operating principles such as electrical discharges and plasmas,24–27 electrospray
variants,28,29 thermal desorption,25 and acoustic nebulization,30,31 among others.23,32 These
techniques are used with samples in several forms, such as compounds deposited on a
surface,25,33 dissolved in a liquid, or aerosolized through various means.34 Relatively few,
however, are well suited to analysis of samples absorbed in paper.
Techniques such as desorption electrospray ionization (DESI) or low temperature
plasma ionization (LTPI) which are primarily used for surface analysis are most effective
when analytes are present on a relatively non-porous surface, rather than absorbed in a
porous substrate. Similarly, ambient ionization methods like “direct analysis in real time”
(DART) that rely on thermal desorption to volatilize analytes prior to ionization in the gas
phase are not as effective for analytes absorbed in porous matrices as for samples on
non-porous surfaces (e.g., glass capillary surface, wire mesh). Preliminary experiments
investigating the ionization of samples collected on paper substrates using DESI, LTPI, and
DART met with little success, as the available analyte at the surface of the paper is rapidly
through techniques dedicated to these matrices, particularly two methods: paper spray
ionization and extraction spray ionization.
1.3.3 Ambient Ionization from Paper Matrices
Paper spray and extraction spray ionization are both variants of electrospray
ionization in which the analyte is introduced on a paper substrate. Extraction spray ionization
employs a drawn glass capillary like those commonly used for nanoelectrospray ionization
(nESI), into which a small section of paper (to which the analyte has been applied) is
inserted.35,36 When the capillary is filled with solvent, the analyte is extracted from the paper
and is then ionized when an electrospray is generated from the tip of the drawn glass
capillary through application of a suitable voltage. This technique has several key advantages
– it may be used with any sort of paper that can be cut to fit into the capillary, the paper is
thoroughly wetted with solvent, and the drawn glass capillary is a well-defined and easy to
work with spray emitter – and it has been used with several analytes in matrices of varying
complexity, from water to blood.36 However, the fact that this technique requires the
insertion of the paper substrate into a narrow capillary is a significant drawback. Either the
paper used for sample collection must be quite small, which limits the amount of sample that
may be applied to it, or it must be cut to fit, which causes sample loss and may introduce
error due to variability in cutting. For applications where significant sample volume is
limited, such as blood and most biological samples, this may not present significant
limitations, but in non-sample-limited applications it may constrain the volume of sample
that can be used, limiting the ability of this technique to detect low concentration species.
A more straightforward alternative for the analysis of samples dried on paper is paper
ionization employs the substrate itself as a spray emitter – the paper is cut to a sharply
pointed tip and wetted, and an electrospray is generated from the pointed tip upon application
of a potential difference of several kilovolts (kV) between the paper and a
counterelectrode.29,37 The analyte is extracted from the paper into the solvent and ionized
through an electrospray process.38 This has the advantage of being able to use larger paper
substrates than can be used in extraction spray ionization, although the substrate material
selection is constrained to those papers that can be reproducibly cut to form sharp tips.29,38
The tip sharpness is essential in paper spray ionization as the intense electric fields required
to generate an electrospray are generally only practical at a sharp point. A more complete
description of the mechanism of paper spray ionization is included in Chapter 2.
Paper spray ionization was developed in the Ouyang and Cooks research groups at
Purdue University, and first described in the peer-reviewed literature in 2010.29,37 Since then
it has been applied to a wide range of applications, from protein analysis39,40 to forensics,41–43
and the ionization mechanism and effects of paper geometry have been characterized.38
Much of the work with paper spray ionization has focused on analysis of biological samples,
especially for potential clinical applications, building on conventional dried blood spot
sampling.44–46 Applications in this area include detection of drugs in blood and saliva,41,44,47
direct analysis of tissue sections,48 and measurement of acylcarnitines in urine, serum, and
whole blood.46,49 Work with other sample types includes forensic analysis of inks to detect
forged documents,43 detection of quaternary ammonium salts used as corrosion inhibitors in
1.4 Environmental and Agricultural Applications of Paper-Based Sampling One area that has seen relatively limited development of paper based sampling
techniques coupled to ambient ionization is agrochemical and environmental analysis. A
common herbicide used in the United States, atrazine, has been used in several cases as a test
analyte in water matrices,29,35 and several studies have investigated the use of paper spray for
measurement of various contaminants and endogenous species in foods,51–56 but there has
been no systematic effort to apply paper-based sampling to routine agrochemical
measurements, particularly with samples collected and dried on paper for transportation.
Atrazine was among the first test analytes used with paper spray ionization, with
reasonably good results (1 ng/mL limit of detection), but was only tested in solution (using
high purity solvents), not as a dried sample collected on paper or in environmental matrices.29
Similar experiments were performed with atrazine in river water and thiabendazole (a
fungicide) in orange homogenate using extraction spray ionization, but again, no quantitative
methods were developed for these analytes.35 The most comprehensive attempt to
demonstrate the potential of paper spray for measurement of pesticides was performed using
both a surface collection approach, in which the surface of a fruit or vegetable was wiped
with the paper, and direct analysis of food homogenates.53 This study investigated five
pesticides, and obtained workable limits of detection, but as with the above two studies there
was no attempt to develop a functional quantitative method.53
Quantitative experiments have been performed using paper spray ionization for
analysis of foodstuffs, but have been focused on detecting contamination or adulteration
rather than routine regulatory analysis. Experiments in this area include the measurement of
clenbuterol in meat,52 and melamine in milk.52 With the exception of the study of azo dyes in
pepper,51 these experiments were conducted using samples applied to paper and immediately
ionized, so that the paper served primarily as a support substrate rather than a sample
collection medium.52,54
1.5 Summary and Outline
Paper is an ideal sampling medium for many applications, and has been used
successfully in the clinical environment for many years. The development of ambient
ionization methods has enabled the mass spectrometric analysis of samples directly from
paper media, without separate extraction and separation steps. These techniques have been
applied to a wide range of samples, but there remains significant room for development,
especially in the area of agrochemical analysis for regulatory and quality control purposes.
There has been little investigation of the potential for use of paper as a collection tool
for environmental samples in a manner analogous to dried blood spot collection. This is one
of several applications of paper-based sampling coupled to ambient ionization explored in
this work. Other topics investigated include the direct analysis of agrochemical formulations
for detection of trace cross-contamination by paper spray ionization and measurement of
therapeutic drugs and nicotine in biofluids using a novel ion source based on a nib-shaped
structure coupled to paper sampling media.
One of the major impediments to the use of paper spray ionization for many
applications is the need to construct a custom ion source. While a basic paper spray source
can be as simple as a metal clip connected to a high voltage power supply, a somewhat
greater investment in terms of design time and manufacturing cost is necessary to achieve a
described in Chapter 2, and its use for the measurement of herbicides in environmental
matrices such as water, soil extracts, and crop extracts is detailed in Chapter 3.
The first general-purpose commercial paper spray ion source, the Prosolia Velox 360,
has recently been released. The ability to use paper spray ionization without the need to first
construct and validate a custom ion source may make paper spray ionization a much more
attractive tool for application-focused researchers. The operation of this ion source, its
performance with agrochemicals in environmental matrices, and the procedures for
performing automated paper spray experiments and data analysis are covered in Chapter 4,
along with a comparison to the custom paper spray ion source described in Chapter 2.
Chapter 5 describes the use of the commercial paper spray source for the analysis of
pesticide formulations. These formulations are a significant challenge for the analytical
chemist, as they typically contain high concentrations of surfactants and other ingredients
that can interfere with conventional LC-MS analysis, as well as very high concentrations
(>10% by mass) of the active ingredients. This renders detection of cross-contaminants at
part-per-million levels very difficult, and most analytical methods described in the
peer-reviewed literature have focused on ensuring the correct amount of active ingredient is
present, not on the detection of trace cross-contaminants. Paper spray is relatively insensitive
to particulates and other components of many formulations that would interfere with
conventional ESI, and can be used for the analysis of formulations samples with a minimum
of sample preparation (generally dilution in a suitable organic solvent, such as acetonitrile).
Paper spray is a powerful tool for the analysis of samples collected on paper
substrates, but it does impose some constraints, particularly in the geometry of the paper
damage and can entail some loss of material if the paper is cut after sample application. A
novel ion source, based on a fountain pen nib, is described in Chapter 6. This ionization
technique, nib-based electrospray ionization, or “nibESI,” generates an electrospray from a
sharpened fountain pen nib. Paper or other porous material to which the sample has been
applied is mounted atop the nib, and the sample is eluted from the paper when solvent is
applied. This ion source is tested using the recently developed Noviplex plasma sampling
cards described at the beginning of this chapter. These cards collect a sample on a small
paper disc, which would be challenging to analyze by paper spray ionization due to its small
size and circular shape, requiring cutting to a sharp point, with intrinsic loss of material.
Analysis by nibESI does not require cutting or reshaping the paper, avoiding the constraints
REFERENCES
(1) McGann, W. J.; Haigh, P.; Neves, J. L. Expanding The Capability of IMS Explosive Trace Detection. Int. J. Ion Mobil. Spectrom. 2002, 5 (3), 115–122.
(2) Najarro, M.; Dávila Morris, M. E.; Staymates, M. E.; Fletcher, R.; Gillen, G.
Optimized thermal desorption for improved sensitivity in trace explosives detection by ion mobility spectrometry. Analyst 2012, 137, 2614 DOI: 10.1039/c2an16145a.
(3) Guthrie, R.; Susi, A. A Simple Phenylalanine Method for Detecting Phenylketonuria in Large Populations of Newborn Infants. Pediatrics 1963, 32 (3), 338–343.
(4) Demirev, P. a. Dried blood spots: Analysis and applications. Anal. Chem. 2013, 85 (2), 779–789 DOI: 10.1021/ac303205m.
(5) Lakshmy, R. Analysis of the Use of Dried Blood Spot Measurements in Disease Screening. J. Diabetes Sci. Technol. 2008, 2 (2), 242–243 DOI:
10.1177/193229680800200211.
(6) Wagner, M.; Tonoli, D.; Varesio, E.; Hopfgartner, G. The Use of Mass Spectrometry to Analyze Dried Blood Spots. Mass Spectrom. Rev. 2014 DOI: 10.1002/mas.21441.
(7) Shimadzu Corporation. Noviplex Card Plasma Separator Technology; 2015, www.ssi.shimadzu.com/products/literature/Life_science/noviplex.pdf.
(8) Kim, J. H.; Woenker, T.; Adamec, J.; Regnier, F. E. Simple, miniaturized blood plasma extraction method. Anal. Chem. 2013, 85 (i), 11501–11508 DOI:
10.1021/ac402735y.
(9) Annesley, T. M. Ion Suppression in Mass Spectrometry. Clin. Chem. 2003, 49 (7), 1041–1044 DOI: 10.1373/49.7.1041.
(10) Antignac, J. P.; De Wasch, K.; Monteau, F.; De Brabander, H.; Andre, F.; Le Bizec, B. The ion suppression phenomenon in liquid chromatography-mass spectrometry and its consequences in the field of residue analysis. Anal. Chim. Acta 2005, 529, 129–136 DOI: 10.1016/j.aca.2004.08.055.
122 DOI: 10.1016/j.talanta.2013.03.048.
(12) McLuckey, S. A. Principles of collisional activation in analytical mass spectrometry. J. Am. Soc. Mass Spectrom. 1992, 3 (6), 599–614 DOI: 10.1016/1044-0305(92)85001-Z.
(13) Louris, J. N.; Cooks, R. G.; Syka, J. E. P.; Kelley, P. E.; Stafford Jr., G. C.; Todd, J. F. J. Instrumentation, Applications, and Energy Deposition in Quadrupole Ion-Trap Tandem Mass Spectrometry. Anal. Chem. 1987, 59, 1677–1685 DOI:
10.1021/ac00140a021.
(14) de Hoffmann, E.; Stroobant, V. Mass Spectrometry: Principles and Applications, 3rd ed.; John Wiley & Sons: Chichester, England, 2007.
(15) Chambers, A. G.; Percy, A. J.; Yang, J.; Borchers, C. H. LC/MRM-MS Enables Precise and Simultaneous Quantification of 97 Proteins in Dried Blood Spots. Mol. Cell. Proteomics 2015, 3094–3104 DOI: 10.1074/mcp.O115.049957.
(16) Ombrone, D.; Giocaliere, E.; Forni, G.; Malvagia, S.; la Marca, G. Expanded Newborn Screening By Mass Spectrometry: New Tests, Future Perspectives. Mass Spectrom. Rev. 2016, 35, 71–84 DOI: 10.1002/mas.21463.
(17) Spáčil, Z.; Elliott, S.; Reeber, S. L.; Gelb, M. H.; Scott, C. R.; Tureček, F.
Comparative triplex tandem mass spectrometry assays of lysosomal enzyme activities in dried blood spots using fast liquid chromatography: Application to newborn
screening of pompe, fabry, and hurler diseases. Anal. Chem. 2011, 83 (12), 4822–4828 DOI: 10.1021-ac200417u.
(18) Spacil, Z.; Tatipaka, H.; Barcenas, M.; Scott, C. R.; Turecek, F.; Gelb, M. H. High-throughput assay of 9 lysosomal enzymes for newborn screening. Clin. Chem. 2013, 59 (3), 502–511 DOI: 10.1373/clinchem.2012.189936.
(19) Oliveira, R. V.; Henion, J.; Wickremsinhe, E. Fully-automated approach for online dried blood spot extraction and bioanalysis by two-dimensional-liquid
chromatography coupled with high-resolution quadrupole time-of-flight mass spectrometry. Anal. Chem. 2014, 86 (2), 1246–1253 DOI: 10.1021/ac403672u.
(21) Fenn, J. B.; Mann, M.; Meng, C. K.; Wong, S. F.; Whitehouse, C. M. Electrospray ionization-principles and practice. Mass Spectrom. Rev. 1990, 9 (1), 37–70 DOI: 10.1002/mas.1280090103.
(22) Lord Rayleigh. On the equilibrium of liquid conducting masses charged with electricity. Philos. Mag. Ser. 5 1882, 14 (87), 184–186 DOI:
10.1080/14786448208628425.
(23) Huang, M.-Z.; Cheng, S.-C.; Cho, Y.-T.; Shiea, J. Ambient ionization mass spectrometry: A tutorial. Anal. Chim. Acta 2011, 702, 1–15 DOI:
10.1016/j.aca.2011.06.017.
(24) Harper, J.; Charipar, N.; Mulligan, C.; Zhang, X.; Cooks, R.G.; Ouyang, Z. Low-temperature plasma probe for ambient desorption ionization. Anal. Chem. 2008, 80 (23), 9097–9104 DOI: 10.1021/ac801641a.
(25) Gross, J. Direct analysis in real time—a critical review on DART-MS. Anal. Bioanal. Chem. 2014, 406 (1), 63–80 DOI: 10.1007/s00216-013-7316-0.
(26) Cody, R. B.; Laramée, J. A.; Nilles, J. M.; Durst, H. D. Direct Analysis in Real Time ( DART) Mass Spectrometry. JEOL News 2005, 40 (1), 8–12.
(27) Shelley, J. T.; Wiley, J. S.; Hieftje, G. M. Ultrasensitive ambient mass spectrometric analysis with a pin-to-capillary flowing atmospheric-pressure afterglow source. Anal. Chem. 2011, 83 (14), 5741–5748 DOI: 10.1021/ac201053q.
(28) Takats, Z.; Wiseman, J.; Gologan, B.; Cooks, R. Mass spectrometry sampling under ambient conditions with desorption electrospray ionization. Science. 2004, 306 (October), 471–474 DOI: 10.1126/science.1104404.
(29) Liu, J.; Wang, H.; Manicke, N. E.; Lin, J.-M.; Cooks, R. G.; Ouyang, Z. Development, characterization, and application of paper spray ionization. Anal. Chem. 2010, 82 (6), 2463–2471 DOI: 10.1021/ac902854g.
(30) Heron, S. R.; Wilson, R.; Shaffer, S. A.; Goodlett, D. R.; Cooper, J. M. Surface acoustic wave nebulization of peptides as a microfluidic interface for mass spectrometry. Anal. Chem. 2010, 82 (10), 3985–3989 DOI: 10.1021/ac100372c.
Goodlett, D. R. Surface acoustic wave nebulization produces ions with lower internal energy than electrospray ionization. J. Am. Soc. Mass Spectrom. 2012, 23 (6), 1062– 1070 DOI: 10.1007/s13361-012-0352-8.
(32) Chen, H.; Gamez, G.; Zenobi, R. What Can We Learn from Ambient Ionization Techniques? J. Am. Soc. Mass Spectrom. 2009, 20 (11), 1947–1963 DOI: 10.1016/j.jasms.2009.07.025.
(33) Takats, Z. Ambient mass spectrometry using desorption electrospray ionization (DESI): instrumentation, mechanisms and applications in forensics, chemistry, and biology. J. Mass Spectrom. 2005, 40 (10), 1261–1275 DOI: 10.1002/jms.922.
(34) Wu, C.; Siems, W. F.; Hill, H. H. Secondary electrospray ionization ion mobility spectrometry/mass spectrometry of illicit drugs. Anal. Chem. 2000, 72 (2), 396–403 DOI: 10.1021/ac9907235.
(35) Ren, Y.; Liu, J.; Li, L.; McLuckey, M. N.; Ouyang, Z. Direct Mass Spectrometry Analysis of Untreated Samples of Ultralow Amounts Using Extraction
Nano-Electrospray. Anal. Methods 2013, 5 (23), 6686–6692 DOI: 10.1039/C3AY41149D.
(36) Espy, R. D.; Teunissen, S. F.; Manicke, N. E.; Ren, Y.; Ouyang, Z.; van Asten, A.; Cooks, R. G. Paper Spray and Extraction Spray Mass Spectrometry for the Direct and Simultaneous Quantification of Eight Drugs of Abuse in Whole Blood. Anal. Chem. 2014, 86 (15), 7712–7718 DOI: 10.1021/ac5016408.
(37) Wang, H.; Liu, J.; Cooks, R.; Ouyang, Z. Paper spray for direct analysis of complex mixtures using mass spectrometry. Angew. Chemie 2010, 49 (5), 877–880 DOI: 10.1002/anie.200906314.
(38) Espy, R. D.; Muliadi, A. R.; Ouyang, Z.; Cooks, R. G. Spray mechanism in paper spray ionization. Int. J. Mass Spectrom. 2012, 325-327, 167–171 DOI:
10.1016/j.ijms.2012.06.017.
(39) Zhang, Y.; Ju, Y.; Huang, C.; Wysocki, V. H. Paper spray ionization of noncovalent protein complexes. Anal. Chem. 2014, 86 (3), 1342–1346 DOI: 10.1021/ac403383d.
(41) Lee, H.; Jhang, C.-S.; Liu, J.-T.; Lin, C.-H. Rapid screening and determination of designer drugs in saliva by a nib-assisted paper spray-mass spectrometry and separation technique. J. Sep. Sci. 2012, 35 (20), 2822–2825 DOI:
10.1002/jssc.201200480.
(42) Li, M.; Zhang, J.; Jiang, J.; Zhang, J.; Gao, J.; Qiao, X. Rapid, in situ detection of cocaine residues based on paper spray ionization coupled with ion mobility spectrometry. Analyst 2014, 139 (7), 1687–1691 DOI: 10.1039/c3an02198j.
(43) da Silva Ferreira, P.; Fernandes de Abreu E Silva, D.; Augusti, R.; Piccin, E. Forensic analysis of ballpoint pen inks using paper spray mass spectrometry. Analyst 2015, 140, 811–819 DOI: 10.1039/c4an01617c.
(44) Manicke, N. E.; Abu-Rabie, P.; Spooner, N.; Ouyang, Z.; Cooks, R. G. Quantitative analysis of therapeutic drugs in dried blood spot samples by paper spray mass spectrometry: an avenue to therapeutic drug monitoring. J. Am. Soc. Mass Spectrom. 2011, 22 (9), 1501–1507 DOI: 10.1007/s13361-011-0177-x.
(45) Ren, Y.; Wang, H.; Liu, J.; Zhang, Z.; McLuckey, M. N.; Ouyang, Z. Analysis of Biological Samples Using Paper Spray Mass Spectrometry: An Investigation of Impacts by the Substrates, Solvents and Elution Methods. Chromatographia 2013, 76 (19-20), 1339–1346 DOI: 10.1007/s10337-013-2458-y.
(46) Yang, Q.; Manicke, N. E.; Wang, H.; Petucci, C.; Cooks, R. G.; Ouyang, Z. Direct and quantitative analysis of underivatized acylcarnitines in serum and whole blood using paper spray mass spectrometry. Anal. Bioanal. Chem. 2012, 404 (5), 1389–1397 DOI: 10.1007/s00216-012-6211-4.
(47) Wang, H.; Ren, Y.; McLuckey, M. N.; Manicke, N. E.; Park, J.; Zheng, L.; Shi, R.; Cooks, R. G.; Ouyang, Z. Direct quantitative analysis of nicotine alkaloids from biofluid samples using paper spray mass spectrometry. Anal. Chem. 2013, 85 (23), 11540–11544 DOI: 10.1021/ac402798m.
(48) Wang, H.; Manicke, N. E.; Yang, Q.; Zheng, L.; Shi, R.; Cooks, R. G.; Ouyang, Z. Direct analysis of biological tissue by paper spray mass spectrometry. Anal. Chem. 2011, 83 (4), 1197–1201 DOI: 10.1021/ac103150a.
(50) Jjunju, F. P. M.; Li, A.; Badu-Tawiah, A.; Wei, P.; Li, L.; Ouyang, Z.; Roqan, I. S.; Cooks, R. G. In situ analysis of corrosion inhibitors using a portable mass
spectrometer with paper spray ionization. Analyst 2013, 138 (13), 3740–3748 DOI: 10.1039/c3an00249g.
(51) Taverna, D.; Di Donna, L.; Mazzotti, F.; Policicchio, B.; Sindona, G. High-throughput determination of Sudan Azo-dyes within powdered chili pepper by paper spray mass spectrometry. J. Mass Spectrom. 2013, 48 (5), 544–547 DOI: 10.1002/jms.3181.
(52) Zhang, Z.; Cooks, R. G.; Ouyang, Z. Paper spray: a simple and efficient means of analysis of different contaminants in foodstuffs. Analyst 2012, 137 (11), 2556–2558 DOI: 10.1039/c2an35196j.
(53) Evard, H.; Kruve, A.; Lõhmus, R.; Leito, I. Paper spray ionization mass spectrometry: Study of a method for fast-screening analysis of pesticides in fruits and vegetables. J. Food Compos. Anal. 2015, 41, 221–225 DOI: 10.1016/j.jfca.2015.01.010.
(54) Li, A.; Wei, P.; Hsu, H.-C.; Cooks, R. G. Direct analysis of 4-methylimidazole in foods using paper spray mass spectrometry. Analyst 2013, 138 (16), 4624–4630 DOI: 10.1039/c3an00888f.
(55) Mazzotti, F.; Di Donna, L.; Taverna, D.; Nardi, M.; Aiello, D.; Napoli, A.; Sindona, G. Evaluation of dialdehydic anti-inflammatory active principles in extra-virgin olive oil by reactive paper spray mass spectrometry. Int. J. Mass Spectrom. 2013, 352, 87– 91 DOI: 10.1016/j.ijms.2013.07.012.
CHAPTER 2: DESIGN AND CHARACTERIZATION OF A PAPER SPRAY ION SOURCE
2.1 Introduction
To investigate and develop ambient ionization techniques for environmental and
regulatory applications, it was necessary to first obtain a suitable ion source. At the time
these experiments were begun no commercialized paper spray ion source was available. It
was therefore necessary to design and build a custom paper spray ion source. The
development and characterization of the custom paper spray ion source (which differs
substantially from the commercial system recently released by Prosolia, Inc.)1,2 is described
herein, along with a summary of the operating principles of this ionization technique. This
custom paper spray ion source was developed to explore the use of paper spray
ionization-mass spectrometry for measurement of agrochemicals in environmental and agricultural
matrices; the specifics of this application are described in detail in Chapter 3. In keeping with
this proposed application, the test analytes used with the custom paper spray ion source were
primarily agrochemicals.
The custom ion source was developed in an iterative fashion, beginning with an
extremely simple device and adapting it to address shortcomings and add desired features.
The development and characterization of this system has progressed through three distinct
generations, which will be referred to as Mark 1 (Mk. 1), Mk. 2, and Mk. 3. Although there
reproducibility, each generation of the ion source was based on the same fundamental design
principles and ionization mechanism.
2.1.1 General Paper Spray Ion Source Design
Paper spray ionization functions by generating a spray of charged droplets from a
paper substrate which has been cut to a sharp point.3 The earliest paper spray ion sources
consisted of only a metal clip in which a small, typically triangular piece of paper with a
sharp point could be held.3,4 A high voltage was applied to the paper via the clip, and a small
volume of solvent (ranging from 5 to 100 µL, depending on paper size) was applied to the
paper.3,4 For applications such as dried blood spot analysis, a more complex ion source
design was developed, employing a disposable plastic cartridge to hold the paper substrate.5
Use of a disposable cartridge allows a greater degree of automation and easier manipulation
of the paper substrate prior to analysis.2
Although a variety of source designs have been developed for paper spray,3,5–7 the
core elements have remained fundamentally unchanged. There must be a structure to hold the
paper substrate in place in front of the mass spectrometer, which may be fixed or
adjustable.3,5 An electrode is required to apply a high voltage to the paper substrate.8 Finally,
a controlled volume of solvent must be applied to the substrate to generate a spray of
droplets.7 The paper substrate itself may also be considered a part of the ion source, as it
serves as the emitter from which charged droplets are generated and the physical parameters
of the paper (e.g., sharpness, tendency to fray, absorbency) can have significant effects on the
2.1.2 Paper Spray Ionization Mechanism
Paper spray ionization is fundamentally an electrospray process, in which a spray of
charged droplets containing the compound to be ionized are generated via application of an
intense electric field to a solution of the analyte.4,10,11 Electrospray ionization (ESI) has been
thoroughly characterized over the past thirty years, and the overall mechanism in paper spray
is essentially the same.9,11 In conventional ESI, solvent containing dissolved analyte is
pumped through a capillary or needle which is positioned near the inlet of a mass
spectrometer. A potential difference is applied between the capillary and the inlet. At the tip
of the capillary the electric field is very intense, producing forces sufficient to generate a
spray of charged droplets, which is sustained by continuous pumping. In many ESI sources
this is assisted by a coaxial flow of inert gas which provides additional pneumatic
nebulization.11 The primary difference between conventional electrospray techniques and
paper spray ionization lies in the use of a porous substrate fed by capillary action as a spray
tip for the ion source, rather than a tubular capillary.4,9
Paper spray is derived from an earlier variant of electrospray ionization which
employed a porous wick as a substrate through which solvent and analyte travel and from
which they are electrosprayed.12 Like its predecessor, paper spray relies solely on the electric
field to generate a spray of charged droplets.9,12 In these techniques, rather than being
pumped through a capillary, solvent travels through the porous substrate via capillary action.
A high voltage (typically several kilovolts) is applied to the wetted substrate, producing a
potential difference between the substrate and the inlet as for conventional ESI. To achieve a
sufficiently intense electric field at the tip of the porous substrate to induce electrospray, a
paper substrate to yield a pointed shape, such as a triangle or sharp-tipped teardrop. The
sharpest corner of the shape is directed towards the inlet to the mass spectrometer. It is
essential that the substrate be free of extraneous sharp points or fibers, as these may produce
additional, uncontrolled jets of droplets resulting in signal loss.5,9
In paper spray ionization the solvent carrying the dissolved analyte wicks forward to
the tip of the paper substrate and is sprayed as a jet of small charged droplets. The analyte
may be either applied in the spray solvent and analyzed immediately, or applied to the
substrate separately. In the second case the analyte is extracted from the substrate into the
spray solvent and then ionized, while in the first case the analyte is already in the spray
solvent. The abundance of solvent at the tip is a critical parameter for ensuring efficient paper
spray ionization.9 If the tip is too wet, then the droplets will tend to increase in size and
behave unpredictably. In some cases, droplets may be too large to be effectively evaporated
by the time they enter the mass spectrometer, interfering with detection of the ions of
interest. Excessive solvent can also produce dripping from the ion source resulting in sample
loss. Alternatively, insufficient solvent prevents the formation of a stable spray jet.9
Generally, when insufficient solvent is present for electrospray to occur, no signal is
observed. On occasion, however, a corona discharge may occur under these conditions,
producing a somewhat different mass spectrum. Field ionization has also been proposed as a
mechanism for the ionization observed to occur in some cases under low solvent conditions.9
2.2 Materials and Operating Parameters 2.2.1 Chemicals and Materials
All herbicide samples used as test analytes were provided by Syngenta Crop
from C/D/N Isotopes (Pointe-Claire, QC, Canada). Isotopically labeled metolachlor
(propyl-d6) was purchased from Crescent Chemical (Islandia, NY). Solvents, such as acetonitrile
(ACN) and methanol (MeOH), and additives such as acetic acid (AA) were purchased from
Fisher Scientific (Fair Lawn, NJ). Unless otherwise stated, LC-MS grade solvents were used
(Fisherbrand Optima). All papers used as substrates for paper spray ionization were
Whatman brand filter papers, purchased from GE Healthcare Life Sciences (Little Chalfont,
UK).
2.2.2 Instrument Parameters
All experiments described in this chapter were performed using a Bruker HCTultra
ion trap mass spectrometer with the default electrospray emitter and housing removed, unless
otherwise stated. The inlet system of this instrument consists of a resistive glass inlet
capillary with metallized ends, which serves as the conductance limit between atmosphere
and the vacuum system. The end of the inlet capillary is covered by a stainless steel spray
shield. The high voltage used for electrospray ionization is applied to the spray shield and the
end of the inlet capillary. Desolvation of ions from spray-based ionization techniques is aided
by a flow of heated nitrogen (100-300 °C)
between the inlet capillary and spray shield.
Instrument parameters were set using
the automated optimization tool included with
the instrument control software. All
parameters were optimized for each analyte.
The potential difference used for paper spray
ionization was set through application of two
voltages – a fixed high voltage, typically 3 kV, applied to the ion source using an external
power supply, and a voltage of the opposite polarity applied to the inlet capillary using the
internal instrument power supply, optimized using the automated tool. This was selected
primarily for convenience in operation, as higher overall potential differences could be
achieved in this manner than were possible through use of either power supply alone. Typical
operating parameters for atrazine and metolachlor are shown in Table 2.1. All experiments
described in this chapter were performed in positive ion mode.
2.3 Paper Spray Ion Source Development
Unsurprisingly, given how recently it was first described,3,4 paper spray has only
recently been commercialized in any functional form.1,2 To investigate the potential of this
technique for regulatory and environmental applications it was therefore necessary to design
and construct a custom ion source. The key design criteria for this source were as follows.
First, the source must be a flexible testbed for assessment of the effectiveness of a variety of
paper types, solvents, and analytes. This ruled out the use of pre-loaded cartridges (difficulty
of reconfiguring and cost of manufacture) and mandated the use of durable and
solvent-tolerant plastics and metals in the design. Secondly, the source should be a modular and
easily transported unit, compatible with a wide variety of mass spectrometers, particularly the
Bruker HCTultra used for the bulk of the experiments with this source. Finally, the source
should be easy to clean and robust, while still enabling fine adjustment in position as needed.
2.3.1 Mark 1 Ion Source
The custom paper spray ion source design was developed in an iterative process
through several generations of functioning systems. The initial design (Mk. 1, shown in
was mounted in a plastic holder attached to a
three axis translation stage. The paper
substrate was cut as desired using scissors or
a razor blade and inserted into the alligator
clip. Solvent was applied manually using an
autopipette. The spray voltage was applied
using a modular high voltage power supply
connected to the insulated cable. This design is extremely simple
and inexpensive to produce, and could be easily mated with most
mass spectrometers equipped with an atmospheric pressure inlet.
One of the first experiments performed with the Mk. 1 ion
source demonstrated the limitations of this initial design and the
need for modification. In this experiment, 50 µL aliquots of a 10
mM solution of atrazine (an herbicide commonly used in the United
States) in ethanol (LC-grade) were applied to a Whatman #903 dried
blood spot collection card and dried at room temperature. Triangular
sections approximately isosceles in shape (1 cm base, 1 cm height) were cut from each
sample spot (depicted in Figure 2.2) and inserted in the Mk. 1 paper spray ion source for
analysis (the dashed circle in Figure 2.2 represents the approximate extent of the sample spot
on the paper – a portion of the sample was not cut out). Spray solvent (99/1 MeOH/AA) was
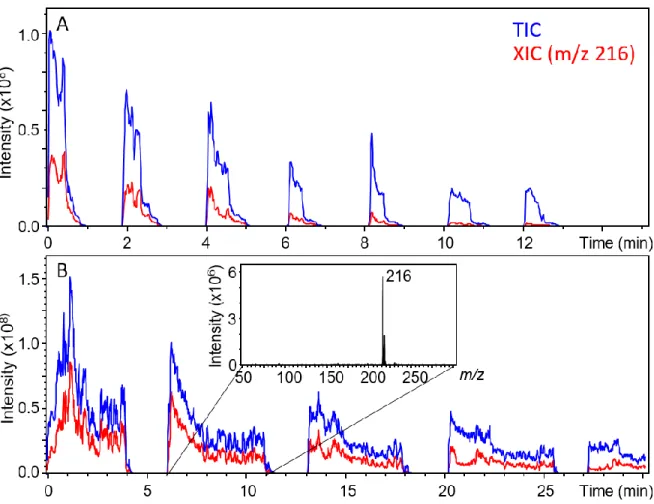
applied in 100 µL aliquots using an autopipette. The resulting total ion current (TIC) and
extracted ion current (XIC) (protonated atrazine, m/z 216) traces for a single spot analyzed
with two desolvation gas settings are shown in Figure 2.3. The data shown in panel A were Figure 2.1: The Mk. 1 paper spray ion source.
collected with a desolvation gas flow rate of 5 L/min, while the data in panel B were
collected with a desolvation gas flow rate of 1 L/min. The desolvation gas temperature in
both cases was set to 300°C. An aliquot of solvent was applied prior to each of the spikes in
signal intensity observed (7 aliquots applied at 2 minute intervals for panel A, 5 aliquots
applied at 6-7 minute intervals for panel B; one paper section used for each pane).
Clearly, in both cases significant atrazine remained on the substrate after the first
aliquot of solvent was exhausted. Additionally, the significant increase in signal duration at
the lower desolvation gas flow rate suggests that the primary reason for solvent exhaustion is
evaporation, not consumption through spray from the tip. While the signal duration observed
with this source configuration was adequate for measurement, it was insufficient for rigorous
instrument parameter optimization, which can take several minutes and requires consistent
generation of ions. The ion source was therefore modified to address this problem, yielding
the Mk. 2 paper spray ion source.
2.3.2 Mark 2 Ion Source
The second iteration of the ion source design, depicted in Figure 2.4, was based on
the same alligator clip and mounting assembly as the Mk. 1 source. The alligator clip was
modified to include a section of PEEK
capillary tubing connected to a syringe pump.
The tubing was attached to the upper
(movable) jaw of the alligator clip using
stainless steel ferrules and a wire wrapping
which was soldered in place. When the paper
substrate was inserted into the alligator clip,
the end of the PEEK tubing was positioned
directly above the back edge of the paper. A
constant flow of solvent could thus be
delivered using the syringe pump,
maintaining a stable quantity of solvent on
the substrate. This source design was
expected to provide a more consistent signal
without the need for manual solvent
replenishment.