ACCESS TO RUNNING WHEELS ATTENUATES SPONTANEOUS MORPHINE WITHDRAWAL IN MICE AS MEASURED BY THERMAL
SENSITIVITY.
Rebecca E. Balter
A dissertation submitted to the faculty of the University of North Carolina at Chapel Hill in partial fulfillment of the requirements for the degree of Doctor of
Philosophy from the Neurobiology Curriculum in the School of Medicine.
Chapel Hill 2013
ii ABSTRACT
REBECCA BALTER: Access to running wheels attenuates spontaneous morphine withdrawal in mice as measured by thermal sensitivity
(Under the direction of Linda A. Dykstra)
Opioid withdrawal is a critical component of opioid abuse and consists of a wide array of symptoms. For many people, the presence of, or desire to avoid, these withdrawal symptoms drives continued drug taking. There is growing evidence that aerobic exercise may be a positive intervention during the
withdrawal period. The following studies seek to develop a behavioral procedure to examine one component of spontaneous opioid withdrawal in mice,
hypersensitivity to a thermal stimulus, and to examine the effects of access to a running wheel during withdrawal. The experiments of Chapter 2 describe and validate the spontaneous withdrawal procedure. During the first 48 hours
iii
iv
v
TABLE OF CONTENTS
LIST OF TABLES... vii
LIST OF FIGURES... viii
LIST OF ABBREVIATIONS... x
Chapter I. GENERAL INTRODUCTION………..………..…… 1
The opioid receptors: expression and anatomy……….. 2
The opioid receptors: cellular activity………... 4
The opioid receptors: chronic activation and tolerance………. 4
Opioid withdrawal: cellular mechanisms………...…….. 6
Opioid withdrawal: experimental evaluation……… 8
Opioid withdrawal: existing treatments………...………... 12
Improving existing treatments………. 13
Goals of this dissertation……….………. 14
II. THERMAL SENSITIVITY AS A MEASURE OF SPONTANEOUS MORPHINE WITHDRAWAL IN MICE…………..… 18
Introduction... 18
Methods... 20
Results... 26
Discussion... 33
III. THE EFFECT OF WHEEL ACCESS ON MORPHINE WITHDRAWAL IN C57BL/6J MICE……….……….... 42
vi
Methods... 45
Results... 50
Discussion... 56
IV. AN EXPANDED CONSIDERATION OF THE WHEEL: LOCKED WHEEL, CORRELATION, AND GROUP HOUSING….….. 63
Introduction... 63
Methods... 66
Results... 71
Discussion... 76
V. CHRONIC WHEEL ACCESS CAN DECREASE MORPHINE SENSITIVITY AND ALTER GENE EXPRESSION……….……… 85
Introduction... 85
Methods... 87
Results... 93
Discussion... 95
VI. GENERAL DISCUSSION………..…….. 105
Experimental results………...… 105
General limitation and further experiments……….… 114
Contributions and significance... 117
vii
LIST OF TABLES
Table 5.1. Tail-flick ED50 values and potency ratio for each group……….. 100 Table 5.2. Significant increases and decreases in gene expression
viii
LIST OF FIGURES
Fig. 2.1 Effects of 30, 56 or 100 mg/kg morphine or saline treatment on latency (mean ±SEM) to respond on
the hot plate at 50, 52, 54, and 56oC………..… 38 Fig. 2.2 ET10 values (mean ±SEM) for mice following 5.5
days of 30, 56 or 100 mg/kg morphine or saline
treatment………. 39 Fig. 2.3 The effect of 0.01 mg/kg buprenorphine on
withdrawal from 5.5 days of 56 mg/kg morphine…………..……... 40 Fig. 2.4 Jumps (mean ±SEM) adjusted for baseline
following 30, 56 or 100 mg/kg morphine or saline………..………. 41 Fig. 3.1 Effect of 30 mg/kg morphine or saline treatment
on latency (mean ±SEM) to respond on the hot
plate at 50, 52, 54, and 56o C………..… 64 Fig. 3.2 Effect of 56 mg/kg morphine or saline treatment
on latency (mean ±SEM) to respond on the hot
plate at 50, 52, 54, and 56o C……….. 63 Fig. 3.3 Effect of 0.01mg/kg naltrexone on latency
(mean ±SEM) to respond on the hot plate in mice
with and without wheel access……… 62 Fig. 4.1 Effects of a locked, compared to unlocked, wheel
on latency (mean ±SEM) to respond on the hot plate at 50, 52, 54, and 56o C in saline- and
morphine- (56 mg/kg) treated mice……… 81
Fig. 4.2 Total revolutions (mean ±SEM) during 7hr
sample periods……….……. 82
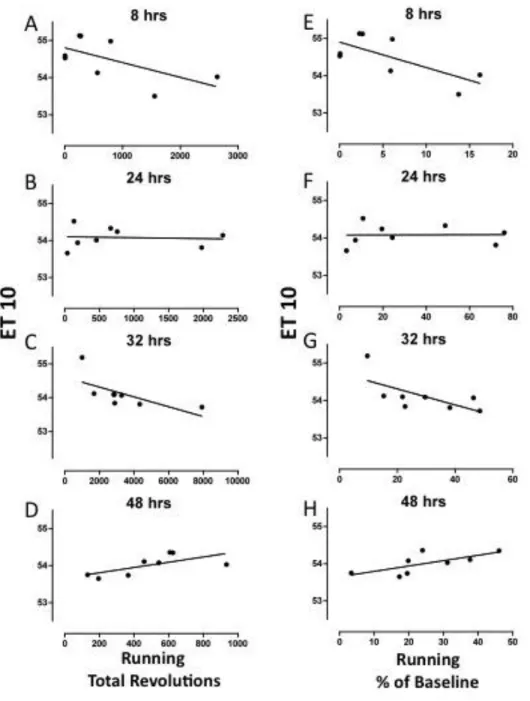
Fig. 4.3 Correlation between running and response latency as quantified by ET10 during spontaneous
withdrawal from 56 mg/k morphine……….…… 83 Fig. 4.4 Effects of group housing (4/cage) on latency
(mean ±SEM) to respond on the hot plate at 50, 52, 54, and 56o C in saline- and
ix
Fig. 5.1 Dissections………...…… 102 Fig. 5.2 Six weeks of wheel access and chronic
morphine both produced rightward sifts in the morphine dose-effect curve compared to pre
exposure and controls………...……. 103 Fig. 5.3 Fold change in gene expression as compared to
x
LIST OF ABBREVIATIONS ANOVA analysis of variance
ARRB beta-arresting 2
C Celsius
cAMP cyclic adenosine monophosphate CL confidence limits
cm centimeters
CREB cAMP response element-binding protein CRF corticotropin releasing factor
DAMGO [D-Ala2, N-MePhe4, Gly-ol]-enkephalin ED50 effective dose, 50%
ET10 effective time, 10 seconds
g gram
GIRK GPCR kinases
GPCR G-protein coupled receptors
hr hour
kg kilogram mg milligram
xi POMC proopiomelanocortin
Chapter 1
General Introduction
[Helen] quickly dropped into the wine they were enjoying a drug which eased men’s pains and irritations,
making them forget their troubles. Odyssey IV:220-221
It is widely assumed that the pain-easing drug referred to by Homer was an opium-based preparation. Centuries later, Edgar Allen Poe references the drug by its Greek descriptor in his poem “The Raven”, summoning its abilities to ease the mind: "Let me quaff this kind Nepenthe and forget this lost Lenore!" Despite all of the advances of modern medicine, morphine and its derivatives are still some of the most effective analgesics for many types of clinical pain.
Unfortunately, the opioid’s ability to ease the pain of the spirit ensures that it is often abused as well.
Conservatively, 2-6% of patients prescribed long-term opioids and up to 30% of illicit users develop drug dependence (Christie, 2008). This dependence is often driven by the ease and degree to which tolerance to opioids can form. Long-term illicit opioid users report consumption of doses up to a hundred fold higher than acutely effective doses (Stanford et al., 2004). Consistent
2
people, the presence of, or desire to avoid, these withdrawal symptoms drives continued drug taking (Le Moal and Koob, 2007). Consequently, understanding and treating opioid withdrawal is a critical component of treating opioid abuse. This dissertation presents the rationale and results from a series of studies that 1) developed a behavioral procedure to examine one component of opioid
withdrawal, i.e., hypersensitivity to a thermal stimulus, 2) examined the effects of access to a running wheel on withdrawal following the development of morphine tolerance and 3) examined changes in gene expression and morphine sensitivity following chronic access to a running wheel.
The opioid receptors: expression and anatomy
To date, three opioid receptors have been identified: mu, kappa, and delta. The mu-opioid receptor, named for its stereotypical ligand morphine,
shows the broadest distribution and is found throughout the brain and spinal cord. The highest concentrations can be found in the striatum, nucleus accumbens, amygdala, periaqueductal grey, and locus coeruleus (Daunais et al., 2001; McClung 2006; McDonald and Lambert 2005).
3
(Johnson and North, 1992). However, there is also evidence to support
dopamine-independent mechanisms of reinforcement in the nucleus accumbens (Koob and Volkow, 2010).
Stimulation of the periaqueductal grey (PAG) through mu as well as kappa and delta opioid receptor activity is predominantly responsible for the analgesic effects of the opioids. Specifically, enkephalin-releasing neurons of the PAG can trigger the release of serotonin from the raphe nuclei which in turn can activate inhibitory neurons in the dorsal root ganglia reducing afferent nociceptive signaling (see Ossipov et al., 2010 for a review). The PAG as well as the locus coeruleus also play critical roles in opioid withdrawal and will be discussed in more detail later.
4 The opioid receptors: cellular activity
All three of the opioid receptors belong to a superfamily of
7-transmembrane G-protein coupled receptors (GPCR’s) and are predominately found postsynaptically on dendrites and cell bodies of neurons (Ding et al., 1996).
Agonist binding of the receptors triggers the release of the alpha subunit of the coupled Gi/Go proteins (Pennock and Hentges, 2011). The “i” of Gi
references their inhibitory downstream effects. First, opioid-activated G-proteins can activate inward rectifying potassium channels, hyperpolarizing the cell and decreasing the probability of an action potential (Kelly et al., 1990; Law et al., 2000). Neuron excitation is also reduced through decreased conductance of voltage gated Ca2+ channels (Childers, 1991). Second, the G-proteins can inhibit adenylate cyclase activity, which leads to a decrease in cyclic AMP, PKA and phosphorylated CREB ultimately decreasing the expression of many genes including cFos, tyrosine hydroxylase, and corticotropin releasing factor (CRF) (McClung, 2006).
The opioid receptors: chronic activation and tolerance
In addition to immediate inhibitory effects on the neuron, agonist binding induces the intracellular phosphorylation of the opioid receptor by GPCR kinases (GIRK’s) (Koch and Holt, 2008). The first effect of phosphorylation is a transient desensitization to further activation (Narita et al. 1995, Ueda et al 1995).
5
further desensitizing the receptor, possibly through MEK/ERK pathways (Bohn et al., 2000; Connor et al., 2004; Williams et al., 2013). Finally, beta-arrestin
facilitates receptor internalization through its association with clathrin (Koch and Hollt, 2008). This arrestin-mediated internalization is a critical first step in the resensitization and recycling of receptors back to the cell surface (Koch and Hollt, 2008)
It is important to note that desensitization does not always lead to
internalization. In particular, morphine produces strong receptor desensitization but fails to promote efficient internalization and consequent resensitization (Bohn et al., 2004). By contrast, DAMGO (a synthetic endorphin), triggers strong
internalization (Connor et al., 2004). In general, it appears that the relative ability of opioids to induce endocytosis is inversely correlated with their ability to induce opioid tolerance (Williams et al., 2013). This relative ability is sometimes referred to as an agonist’s RAVE value (Relative Activation Versus Endocytosis) (Martini and Whistler, 2007). This somewhat heuristic model suggests that agonists with a high RAVE value (high activation, little endocytosis) like morphine have
increased potential to produce tolerance and dependence (Whistler et al. 1999). As tolerance develops following chronic opioid receptor activation,
adenylate cyclase becomes superactivated to compensate for extended inhibition, allowing depressed cAMP levels to return to normal (Koch and Holt, 2008; Watts and Neve, 2005). It is likely that tolerance is also mediated by circuit level
6
mechanisms that contribute to tolerance, however, it is clear that no single mechanism can account for the massive degree of opioid tolerance that is often observed.
Opioid withdrawal: cellular mechanisms
Newton’s third law of motion states that “to every action there is always an equal and opposite reaction”. Though far from the realm of 18th
century physics, this quite elegantly describes the theoretical framework for drug withdrawal. In the field of substance abuse, the opponent-process theory suggests that
withdrawal is the product of an equal but opposite response to its foil, tolerance (Radke et al., 2011). Chronic drug exposure requires the establishment of a set of physiological parameters far outside the normal homeostatic range in order to maintain systemic stability (Sterling and Ever, 1988). This state of chronic deviation, consisting of all of the changes that allow for drug tolerance, is the allostatic state (Koob and LeMoal, 2001).
Consistent with the allostasis theory, opioid withdrawal is likely the result of hyper-excitation of brain regions and cellular processes that were chronically inhibited during extended opioid exposure. On a cellular level, cessation of opioid exposure should produce an increase in the phosphorylation of CREB via
hyperactivity of sensitized adenylate cyclase (Nestler and Aghajanian, 1997; Sharma et al., 1975). Morphine withdrawal dependent increases in
7
Of the various genes whose expression is under the control of CREB, corticotropin-releasing factor or CRF may be the most important. Suppression of CRF signaling to both the amygdala and nucleus accumbens can attenuate morphine withdrawal symptoms (Almela et al., 2012; Heinrichs et al., 1995; McNally and Akil, 2002). Additionally, CRF signaling can trigger an increase in dynorphin expression in the nucleus accumbens, which contributes to the negative affective state of withdrawal (Contarino and Papaleo, 2005). Finally, aside from the pituitary gland, the locus coeruleus is probably the most important afferent structure for hypothalamic CRF signaling. Activation of the locus
coeruleus causes the release of norepinephrine which drives the “fight or flight” state produced by the sympathetic branch of the central nervous system
(McClung, 2006; Brodal, 2004). Not surprisingly, many of the bodily responses associated with sympathetic activation are also symptoms seen during opioid withdrawal (e.g. elevated pulse, sweating, pupil dilation).
In the drug –naïve brain, endogenous opioids play an inhibitory role and counterbalance the excitatory effects of CRF on the locus
coeruleus-norepinephrine system (Curtis et al., 2001); chronic opiate administration is thought to sensitize locus coeruleus neurons to the effects of CRF (Xu, 04). The cessation of exogenous opioid administration unveils the full effects of CRF activation of the sensitized noradrenergic system (Curtis et al., 1997).
8
locus coeruleus. They and others conclude that opioid withdrawal also requires action in the anatomically adjacent periaqueductal grey (see review by Christie et al., 1997).
In fact, chronic morphine infusions directly into the periaqueductal grey (PAG) are sufficient to produce physical dependence in rats (Bozarth and Wise 1984). Once dependent, infusions of an opioid antagonist into the animal’s PAG can precipitate withdrawal (Maldonado et al., 1992). Furthermore, morphine withdrawal triggers an increase in PAG expression of enkephalins, likely through activation of the cAMP/CREB pathway (Folkesson et al., 1989). Interestingly, infusions of enkephalin analogs into the PAG will suppress both precipitated and spontaneous withdrawal, suggesting that the PAG may also be a site of
modulation of withdrawal (Fukunaga and Kishioka, 2000). Finally, opioid withdrawal is associated with rebounds in GABA-ergic signaling in the PAG (Hack et al., 2003).
Opioid withdrawal: experimental evaluation Humans
9
Subjective Opiate Withdrawal Scale (SOWS) and Objective Opiate Withdrawal Scale (OOWS). In 1990, a new SOWS, the short opioid withdrawal scale, was developed by Gossop. It includes 10 measures of both objective and subjective
symptoms: feeling sick, stomach cramps, muscle spasms/twitching, feeling of
coldness, heart pounding, muscular tension, aches and pains, yawning, runny eyes, and insomnia. The format was slightly modified by Wesson and Ling
(2003) to produce the current clinical opiate withdrawal scale (COWS) which
includes eleven measures of objective and subjective symptoms. These scales
have been used by both researchers and health care professionals (e.g. Chu et
al., 2009; Tompkins et al., 2009; Umbricht et al., 2003). In addition to multi-symptom scale, many studies have used changes in body temperature, heart rate and pain sensitivity (hyperalgeisa) to assess withdrawal (Himmelsbach, 1942; Martin and Jasinski, 1969). Hyperalgeis in particular has been reported during spontaneous withdrawal in pain patients in experimental settings (Lipman and Blumenkopf, 1989) as well as in case studies (Devulder et al., 1996).
Additionally, healthy human subjects show hyperalgesia during both spontaneous (Angst et al., 2003) and antagonist precipitated withdrawal (Compton et al., 2003; Sun, 1998).
Non-human Primates
10
quite similar to those seen in humans indicative of mild (yawning, shivering, hiccups, etc), moderate (tremor, anorexia, cramps, etc) and severe withdrawal (vomiting, diarrhea, insomnia, crying, etc). Variations of this scale have been used to assess withdrawal in the decades since (e.g. Deneau and Seevers, 1963; Holtzman and Villarreal, 1969; Sell et al., 2005). In addition to somatic symptoms, a number of research groups have used changes in operant
responding to assess opioid withdrawal. One approach, measures disruption in food reinforced responding to quantify withdrawal (e.g. Thompson and
Schuster,1964; Holtzman and Villarreal, 1973). A second approach uses drug discrimination to identify interoceptive withdrawal states in which naltrexone is used as the discriminative stimulus (Brandt and France, 1998; Becker et al., 2008; France and Woods, 1989; McMahon et al., 2009).
Rodents
11
piloerection (goose bumps), one of the most striking behaviors, jumping, is unique to rodents. Jumping during opioid withdrawal was first described in 1969 in a paper by Way et al. Although the original procedure measured the number of rats that jumped off a platform, recent experiments measure the number of times a mouse or rat jumps when contained inside a beaker or activity chamber.
Beyond somatic signs of withdrawal, conditioned place aversion is often used to evaluate the aversive state produced during withdrawal (e.g. Gómez-Milanés et al., 2012; Wang et al., 2012). The elevated plus maze, open field test, and Morris water maze can also be used to assess the cognitive and anxiogenic effects of withdrawal (Miladi-Gorji et al., 2011, 2012). Although these
approaches are excellent for answering many questions, they are limited in their ability to measure subtle changes during withdrawal produced by behavioral interventions. Many of the somatic signs appear in a binary present/absent dichotomy. Conditioned place aversion and cognitive measures may provide more subtle data but are limited to precipitated withdrawal and are sensitive to repeated testing, respectively.
Hyperalgesia, another measure of withdrawal, was first presented by Tilson et al. in 1973. They reported that sensitivity to electric foot shock
12
Since Tilson’s 1973 study, a modest number of papers have described hyperalgesia in animal models of opioid withdrawal. In rats, hyperalgesia occurs during both precipitated and spontaneous morphine withdrawal (Devillers et al., 1995; Dunbar and Pulai, 1998; Grilly and Gowans, 1986; Jin et al., 2012; Li et al., 2001). Hyperalgesia in rats also occurs during withdrawal from other opioids such as fentanyl (Laulin et al., 2002) and heroin (Devillers et al., 1995; Laulin et al., 1998).
To the best of our knowledge only two prior studies employ a
hyperalgesia model for examining opioid withdrawal in mice. Rubovich et al. (2009) examine only a single time point during spontaneous withdrawal and Crain and Shen (2007) employ a precipitated withdrawal procedure.
Opioid withdrawal: existing treatments
13
ability to suppress spontaneous opioid withdrawal symptoms during the induction phase of treatment (Strain et al., 2011). Additionally the anxiolytic, clonidine, and the opiate antagonist naloxone are approved as detoxification treatments
(Nicholls et al., 2010).
Though these treatments are highly effective, they all have unwanted effects including constipation, nausea and respiratory depression (Fiellin et al., 2002). Additionally some methadone maintained patients still report cue-induced cravings that increase the risk of relapse (Fareed et al., 2011). Finally, there are always questions about potential abuse and/or diversion of these compounds.
Improving existing treatments
The American Psychological Association, as well as most treatment programs, emphasizes the fact that treatment effectiveness is optimized when pharmacological interventions are combined with psychosocial approaches. At the present time, there is growing interest and evidence for exercise as a positive behavioral intervention for optimizing the treatment of drug addiction.
Specifically, it has been reported that short periods of aerobic exercise can decrease the desire for alcohol (Ussher et al., 2004), tobacco (Taylor and Katomeri, 2007) and cannabis (Buchowski et al., 2011) in humans. Exercise has also been shown to reduce symptoms of nicotine withdrawal and aids in smoking cessation (Taylor and Ussher, 2005; Taylor and Katomeri, 2007).
14
(Hammer et al., 2010) and show a decrease in morphine conditioned place preference (Lett et al., 2002). Beyond altering acute drug effects, limited evidence from the animal literature suggests that voluntary wheel running is beneficial during drug withdrawal. For example, wheel running attenuates seizures induced by ethanol withdrawal (Devaud et al., 2012) and reduces cognitive deficits and anxiety associated with spontaneous morphine withdrawal in rats (Miladi-Gorji et al., 2011, 2012).
It is possible that these behavioral effects are due to increases in levels of endogenous opiates following aerobic exercise. In humans, beta- endorphin levels increase three-fold following treadmill exercise (Mahler et al., 2009) and pain sensitivity decreases following rowing exercise (Cohen et al., 2010).
In animals, many studies have shown that wheel running can produce rightward shifts in a morphine dose-effect curve (Kanarek et al., 1998; Mathes and Kanarek, 2001; Smith and Yancey 2003; Smith and Lyle, 2006). Opioid-like withdrawal has even been precipitated after chronic exercise in rats (Kanarek et al., 2009). Taken together, these studies provide evidence that wheel running can alter the functioning of the opiate system.
Goals of this dissertation
15
this hypothesis by developing and validating a sensitive measure of spontaneous morphine withdrawal in mice. Aim II (described in Chapters III and IV) directly tests the primary hypothesis that wheel access reduces withdrawal severity and examines potential mechanisms for the effect. Aim III (described in Chapter V) further addresses the mechanism by which wheel access alters brain and
behavior by comparing the effects of chronic wheel access with those of chronic morphine.
Aim I: Thermal sensitivity, measured by response latency on a hot plate, is a
sensitive measure of spontaneous morphine withdrawal in mice.
Aim I validated the use of thermal sensitivity as a measure of spontaneous morphine withdrawal. To test this hypothesis, physical dependence was induced by 5.5 days of twice daily injections of 56 mg/kg morphine. At multiple time points following the final injection, withdrawal was assessed in two ways. First, thermal sensitivity was evaluated by latency to respond on the hot plate at a range of temperatures (50, 52, 54 and 56oC). Second, within and between subject changes in thermal sensitivity were compared to changes in jumping behavior. The ability of a dose of buprenorphine to attenuate withdrawal-induced changes in thermal sensitivity was also tested.
Aim II: Access to a running wheel in the home cage attenuates increases in
16
To test this hypothesis, mice were given morphine injections for 5.5 days to establish physical dependence. Following termination of this chronic regimen, mice were given access to running wheels throughout the subsequent withdrawal period. Withdrawal was measured by determining thermal sensitivity on the hot plate at baseline and at 8, 24, 32, 48 hrs and 1 week following termination of the chronic regimen of morphine administration.
Aim II examined these effects further by determining the effects of wheel access on morphine withdrawal under conditions in which running wheels were present in the mice cages, but were in a “locked” position. Since mice were housed singly in the experiments involving access to a running wheel, an
additional set of experiments examined the effects of group housing on morphine withdrawal.
Aim III: Chronic wheel access reduces morphine’s antinociceptive potency and
produces changes in gene expression that are similar to changes seen following
chronic morphine administration.
17
morphine in the tail-flick procedure were compared to the effects of access to running wheels.
The second section of Aim III used quantitative polymerase chain reaction (qPCR) to compare gene expression following chronic wheel access and chronic morphine administration. The expression of five genes was assessed: POMC, PENK, PDYN, MOR1, and ARRB2. Proopiomelanocortin (POMC),
proenkephalin (PENK) and prodynorphin (PDYN) were selected because they code for the precursor proteins that are post-translationally modified into the three major endogenous opioids: beta-endorphin, enkephalin, and dynorphin, (Aghajanian and Sanders-Bush 2002). MOR1 gene codes for the mu-opioid receptor (Ammon-Treiber et al 2005). Beta-arrestin 2 (BARR2) encodes the protein beta-arrestin which regulates mu-opioid receptor desensitization and internalization (Bohn et al., 2004). Gene expression was assessed in four brain regions integral to the formation and expression of morphine tolerance: the striatum, nucleus accumbens, hypothalamus and periaqueductal grey.
Chapter 2
Thermal sensitivity as a measure of spontaneous morphine withdrawal in mice
INTRODUCTION
The opioid withdrawal syndrome consists of a constellation of symptoms that appear following the termination of a prolonged period of opioid
administration. The presence or desire to avoid these symptoms may even contribute to continued drug taking (Le Moal and Koob, 2007). As such,
withdrawal is a critical component of opioid abuse. One of the many symptoms that make up the Clinical Opiate Withdrawal Scale or COWS (Tompkins et al., 2009) is an increase in pain or sensitivity to pain. An increase in pain sensitivity or hyperalgesia during spontaneous withdrawal occurs in pain patients in
experimental settings (Lipman and Blumenkopf, 1989) and is reported in case studies, as well (Devulder et al., 1996). Healthy human subjects show
hyperalgesia during both spontaneous (Angst et al 2003) and antagonist precipitated withdrawal (Compton et al., 2003; Sun, 1998).
19
sensitivity to electric foot shock increases following the cessation of morphine in rats. Since then a modest number of papers have described hyperalgesia in animal models of opioid withdrawal. In rats, hyperalgesia occurs during both precipitated as well as spontaneous morphine withdrawal and is observed with multiple pain assays: hot plate, tail-flick, and shock discrimination (Devillers et al., 1995; Dunbar and Pulai 1998; Grilly and Gowans 1986; Jin et al., 2012; Li et al., 2001; Tilson et al., 1973). Hyperalgesia in rats also occurs during withdrawal from fentanyl (Laulin et al., 2002) and heroin (Devillers et al., 1995; Laulin et al., 1998). Beyond rodents, withdrawal hypersensitivity is seen in both dogs (Martin et al., 1987) and cats (Johnson and Duggan, 1981).
Traditionally, opioid withdrawal in mice is measured by the presence of behavioral signs such as jumping, wet dog shakes, piloerection, diarrhea, and ptosis (e.g. Kest et al., 2002; Papaleo and Contarino 2006). To the best of our knowledge only two studies from laboratories other than our own employ a hyperalgesia model for examining opioid withdrawal in mice. These studies examine only a single time point during spontaneous withdrawal (Rubovich et al., 2009) or employ a precipitated, rather than a spontaneous, withdrawal procedure (Crain and Shen 2007).
The current study describes a new method for assessing hyperalgesia in a mouse model of spontaneous morphine withdrawal. We hypothesize that
20
Buprenorphine, a low efficacy mu agonist, was selected because it is commonly used in agonist replacement therapy for opioid dependence (e.g. Connock et al. 2007 and Kraus et al., 2011), and used to suppress spontaneous opioid
withdrawal symptoms during the induction phase of treatment (Strain et al. 2011).
METHODS Animals
All experiments were conducted in male C57BL/6J mice (Jackson Labs, Raleigh, NC), 10 weeks of age upon delivery. Male C57BL/6J mice were
selected to allow comparison with other data collected in our laboratory regarding morphine’s pharmacological effects as well as the extensive literature on the behavioral effects of opioids in C57BL/6 mice. Additionally, in comparison to other inbred strains, C57BL/6J mice are known to be highly sensitive across many behavioral assays. Specifically, they exhibit high sensitivity in measures of acute nociception (Mogil et al., 2000), naloxone precipitated morphine withdrawal (Kest et al. 2002) and morphine self-administration (Elmer et al. 2009).
21
for 1 hr prior to all behavioral testing. Although a criterion was set such that mice <20 g or those that lost >20% of initial body weight would be removed from the study, it was not necessary to remove any mice from the study. Animal protocols were approved by the Institutional Animal Care and Use Committee, and the methods were in accord with the “Guide for the Care and Use of Laboratory
Animals” (Institute of Laboratory Animal Research, Commission on Life Sciences, National Research Council, 2011).
Experimental Procedures
Thermal Sensitivity: Thermal sensitivity was assessed using a hot plate
analgesia meter (25.3 × 25.3 cm), Columbus Instruments, Columbus, OH. During each 1-hr hot plate testing period, a temperature-effect curve was
22
Jumping: To measure jumping, mice were removed from their home cages
and placed in a 4L beaker in the center of a Med Associates Inc. activity chamber. Vertical beam breaks, monitored by a computer, were used to count the number of jumps that occurred in a 30-min period.
Pharmacological Procedure: During the saline/morphine administration
period, doses of saline, 30 mg/kg, 56 mg/kg or 100 mg/kg of morphine were administered daily for 5.5 days, with injections occurring at 10:00 am and 8:00 pm daily (11 injections total). Morphine sulfate and buprenorphine hydrochloride, provided by the National Institute on Drug Abuse (Bethesda, MD, USA), were both dissolved in 0.9% saline to yield all concentrations. Doses were injected subcutaneously at a volume of 0.1 ml /10 g.
Experimental Design
Experiment 1: Thermal sensitivity following saline, 30, 56, or 100 mg/kg of
morphine
23
final injection (10:00 am on day 7), at 8 hrs (6:00 pm on day 7), at 24 hrs (10:00 am on day 8), at 32 hrs (6:00 pm on day 8), at 48 hrs (10:00 am on day 9) and at 1 week (10:00 am on day 14). This period (days 7-14) was designated as the withdrawal period.
Experiment 2: Buprenorphine and thermal sensitivity
In order to select a dose of buprenorphine that did not produce
antinociception on its own, a cumulative dose-effect curve (0.01 to 0.32 mg/kg) was obtained for buprenorphine at each of the four temperatures tested during the thermal sensitivity assessment (50, 52, 54 and 56 ±0.1oC). Baseline
response latencies on the hot plate were determined twice prior to the beginning of the buprenorphine dose-effect curve and spaced 30 min apart. Data from these baselines were averaged to yield one baseline value. Following baseline determination, responding on the hot plate was examined over multiple cycles, and doses of buprenorphine were spaced 30 min apart. Drugs were administered at the start of each cycle and latency on the hot place was determined during the last minute of the cycle. Drug doses were increased cumulatively, with the dose increasing in one-half log unit increments prior to each cycle (0.01, 0.03, 0.1, 0.32 mg/kg). Buprenorphine effects were expressed as a percentage of the maximal possible effect (% MPE) using the following formula:
24
During the withdrawal experiment, on day one thermal sensitivity was assessed in two groups of mice (n=8) at 10:00 am (baseline 1) and 6:00 pm (baseline 2). A 2-way repeated measures ANOVA revealed no difference between baseline 1 and baseline 2; therefore, baselines were averaged for all analyses and figures. At 10:00 am on day two 56 mg/kg morphine administration began for all mice as described above and continued for 5.5 days. Following the last dose of morphine on day seven, thermal sensitivity was assessed five more times: immediately after the final injection (10:00 am on day 7), at 8 hrs (6:00 pm on day 7), at 24 hrs (10:00 am on day 8), at 32 hrs (6:00 pm on day 8), and at 48 hrs (10:00 am on day 9). A dose of 0.01 mg/kg buprenorphine or saline was administered subcutaneously 30 minutes prior to each testing session on days 7-9. This period (days 7-9) was designated as the withdrawal period.
Experiment 3: Jumping responses following saline, 30, 56, or 100 mg/kg of
morphine
25
hrs (6:00 pm on day 14), at 24 hrs (10:00 am on day 15), at 32 hrs (6:00 pm on day 15), at 48 hrs (10:00 am on day 16). This period (days 14-16) was
designated as the withdrawal period.
Data analysis
All data are presented as means (+SEM). In Experiments I and II, response latencies were used to derive a measure of thermal sensitivity,
designated as ET10. The ET10 represents the theoretical temperature required to produce a response latency of 10 sec (half the maximal response latency of 20
sec)and was derived using log-linear interpolation. In Experiment III, jumping
responses during the withdrawal period are presented and analyzed as jumps
during the withdrawal period minus the average number of jumps that occurred
during the corresponding baseline period (i.e., Since data for the 0, 24, and 48
hrs withdrawal period fell in the AM, baseline measures from the morning period
were used. Likewise since data for the 8 and 36 hrs withdrawal period fell in the
PM, baseline measures from the evening period were used.)
26
model of the data. The model was a straight model of the means and included random intercepts for each mouse. Following the 2-way ANOVAs, appropriate follow-up contrasts were performed using a model of jumps or ET10 as a function of time and group. The null hypothesis assumed no mean difference in the
number of jumps or the ET10 values. Standard error was adjusted for multiple observations within each mouse.
Statistical analyses were conducted with an alpha level of significance set
at p<0.001. The alpha level was determined using Bonferoni corrections to
account for the large number of comparisons. The ANOVAs were performed using SPSS for Windows software, version 9.0. All post hoc analysis was performed using SAS for Windows software, version 9.2. Figures were created with GraphPad Prism 5.
RESULTS
Thermal sensitivity following spontaneous withdrawal from 30, 56, or 100 mg/kg morphine.
27
maximal value of 20 sec when the hot plate was set at 50oC; at 52, 54 and 56oC, latencies averaged 12.8, 9.4 and 5.7 sec, respectively. Second, response
latencies at the 0 (data not shown), 8, 24, 32 and 48-hr and 1 wk time points for saline-treated mice were never significantly different from baseline, calculated as the average of baseline 1 and 2, indicating that repetition of testing did not
produce measurable effects on response latency. In addition, immediately
following the final morphine injection (0 hr), response latencies were at the cut off value of 20 sec at all temperatures for morphine-treated mice; consequently these data are not shown. The failure to respond within in the 20 sec maximal trial duration indicates a full antinociceptive response to acute morphine
exposure.
A 3-way repeated measures ANOVA revealed a time x temperature x group interaction F(45, 405) = 1.974, p<0.001. Follow up Student’s t-tests were then used to compare individual groups, time points, and temperatures.
In general, the curves obtained in the morphine-treated mice were displaced downward from those obtained at baseline and from those of saline-treated mice. Significant differences in response latencies were apparent between morphine-treated and saline- treated mice throughout the withdrawal period. Significant differences between the 30 mg/kg morphine- and saline-treated mice were apparent at 32 and 48 hrs (52oC) t621= 3.87, 4.43, p<0.001,
respectively. Significant differences between the 56 mg/kg morphine- and saline-treated mice were apparent at 8 hrs (52oC) t621= 3.41, p<0.001; 24 hrs (52 and
28
p<0.001; 48 hrs (50, 52, 54oC) t621=3.65, 6.787, 3.82, p<0.001; and at 1 wk (50
and 54oC) t621=3.45, 3.55, p<0.001. Significant differences between the 100
mg/kg morphine- and saline-treated mice were apparent at 48 hrs (50 and 52oC) t621= 4.30, 5.21, p<0.001 and at 1 wk (50, 52, 54oC) t621= 6.51, 5.85, 4.37,
p<0.001. In addition, the responses of morphine-treated mice were significantly different from baseline at all points where responses were different from those of saline-treated mice. These differences suggest that mice treated with 30, 56, or 100 mg/kg of morphine for 5.5 days and then withdrawn from morphine were more sensitive to the thermal stimulus than mice treated with saline.
It is also important to note significant differences in response latency between different morphine treated groups during the withdrawal period. Response latencies of mice treated with 56 mg/kg morphine were significantly different from those of mice treated with 30 mg/kg morphine at 8hrs and 24hrs (52oC) t621=3.31, 3.70, p<0.001, respectively and at 32 hrs (50oC) t621=5.32,
p<0.001. Response latencies in mice treated with 56 mg/kg morphine were also significantly different from response latencies obtained in mice treated with 100 mg/kg morphine at 8hrs and 24hrs (52oC) t621=4.08, 3.44, p<0.001, respectively
and at 32 hrs (50oC) t621=4.43, p<0.001. Finally, a significant difference in
response latencies was apparent between mice treated with 100 mg/kg and 30 mg/kg morphine at 1 wk (50 and 52oC) t621=5.66, 4.02, p<0.001.
29
morphine (30, 56, or 100 mg/kg) affected the extent and time course of this response, with the greatest changes in latency observed following 56 mg/kg morphine and at 32 hrs into the withdrawal period.
Fig. 2.2 shows the ET10 value at baseline, 8, 24, 32, 48 hrs and 1 wk following termination of the 5.5-day treatment period with either 30, 56, 100 mg/kg morphine or saline. The ET10 values were derived from the data shown in Fig. 2.1. They represent the theoretical temperature necessary to produce a 10 sec response on the hot plate. A 2-way repeated measures ANOVA revealed a main effect of time F(5, 135) = 2.299, p<0.05. Individual groups and time points were compared using appropriate follow up contrasts. For mice treated with 30 mg/kg morphine, a significant difference in ET10 value compared to baseline was apparent at 32 and 48 hrs, t133=3.42, 4.30, p<0.001, respectively. For mice
treated with 56 mg/kg morphine, a significant difference in ET10 value compared to baseline was apparent at 24, 32, 48 hrs and 1 wk, t133=5.45, 6.74, 4.97, 3.97,
p<0.001, respectively. At each of these time points (24, 32, 48 hrs and 1 wk), the ET10 values of mice treated with 56 mg/kg morphine were also significantly different from those of saline-treated mice, t133=4.46, 5.37, 3.91, 3.52, p<0.001,
respectively. For mice treated with 100 mg/kg morphine, a significant difference in ET10 value compared to baseline was apparent at 32, 48 hrs and 1 wk, t133=3.64, 6.89, 8.29, p<0.001, respectively. The ET10 values of mice treated
with 100 mg/kg morphine were also significantly different from those of saline-treated mice at 48 hrs and 1 wk, t133=5.16, 6.75, p<0.001, respectively. There
30
baseline or between the ET10 values of saline-treated mice across time. Taken together, these data further support the hypothesis that 5.5 days of morphine treatment significantly increase thermal sensitivity during spontaneous morphine withdrawal.
Effects of buprenorphine on thermal sensitivity during spontaneous morphine withdrawal.
Buprenorphine is a partial opioid receptor agonist and, like all mu-opioid agonists, it produces antinociception on the hot plate. Consequently, prior to determining whether buprenorphine would attenuate withdrawal induced increases in thermal sensitivity, a dose of buprenorphine that did not produce antinociception on its own was identified.
Fig. 2.3a presents the dose-effect curve of buprenorphine (0.01 mg/kg-0.32 mg/kg) at each of the temperatures used during the thermal sensitivity testing. Based on these data, a dose of 0.01 mg/kg buprenorphine was selected since this dose did not produce measurable antinociception on the hot plate at 50, 52, 54 or 56oC
31
Immediately following the final morphine injection (0 hr), response latencies were at the cut off value of 20 sec at all temperatures; consequently these data are not shown.
A 2-way repeated measures ANOVA revealed a time x group interaction F(4, 56) = 3.739, p<0.01, respectively. Individual groups and time points were compared using appropriate follow up contrasts. Significant differences were apparent between the buprenorphine-treated and saline-treated groups at 24 and 32 hours, t56=3.94, 3.56, p<0.001, respectively. Additionally, response latencies
of buprenorphine-treated mice showed no difference from baseline throughout the withdrawal period (p>0.01). However, significant differences were again apparent between the saline-treated group and baseline at all withdrawal time points (8, 24, 32, and 48 hrs), t56=3.66, 6.35, 6.65, 3.74, p<0.001. These data
suggest that buprenorphine can attenuate the decrease in response latency observed during morphine withdrawal.
Jumping behavior during spontaneous withdrawal from 30, 56, or 100 mg/kg morphine.
32
Fig. 2.4 shows the number of jumps obtained at the morning (10:00 am) and evening (6:00 pm) baselines. Jumping responses during the withdrawal period are presented and analyzed as jumps observed during the withdrawal
period minus the average number of jumps that occurred during the
corresponding baseline period (i.e., 0, 24, and 48 hrs minus AM baseline; 8 and
36 hrs minus PM baseline). This adjustment for AM and PM baseline measures was included since baseline differences were observed at the two time periods. A 2-way repeated measures ANOVA revealed a time x group interaction F(12, 108) = 2.87, p<0.01, respectively. Individual groups and time points were compared using appropriate follow up contrasts. Significant differences in
adjusted jumping between mice treated with 56 mg/kg morphine and saline were apparent at 24, 32 and 48 hrs, t108= 5.81, 3.61, 3.66, p<0.001, respectively. A
significant difference was seen in adjusted jumping between mice treated with 100 mg/kg morphine and saline at 24 hrs, t108= 4.43, p<0.001. In addition,
immediately following the final morphine injection (0 hr), no jumping was observed in any of the morphine treated mice.
33 DISCUSSION
The experiments yielded three main findings. First, the results from Experiment I supported the hypothesis that the measurement of changes in thermal sensitivity provides a reliable method for assessing spontaneous withdrawal from morphine in mice. Second, Experiment II demonstrated that buprenorphine could attenuate changes in thermal sensitivity as measured by latency to respond on the hot plate. Third, the results from Experiment III indicated that changes in thermal sensitivity during withdrawal were similar to changes in jumping behavior, a well-established measure of morphine withdrawal. Taken together, these data validate the thermal sensitivity procedure as a
method for assessing spontaneous morphine withdrawal.
34
standard error. The observation that mice were more sensitive to a thermal stimulus during morphine withdrawal is consistent with previous research in both humans and animals reporting heightened sensitivity to thermal stimuli following termination of a regimen of morphine administration (Angst et al. 2003; Compton et al. 2003; Dunbar and Pulaj 1998; Rubovitch et al. 2009; Sweitzer et al. 2004). The effect of dose and the time course of withdrawal are clearly apparent in the ET10 data, where a single latency score was generated for each time point. It is well established that dose of morphine is a factor in the severity of physical dependence (e.g., Papaleo and Contarino, 2006). In the experiment reported here, looking at the totality of the week-long withdrawal period, treatment with 56 mg/kg morphine produced a more pronounced increase in sensitivity than 30 mg/kg morphine; however, the time course during which the behavior was
expressed was similar following both 30 and 56 mg/kg. For both groups, thermal sensitivity peaked in the second day following the cessation of morphine
administration and showed a return toward baseline levels by one week. The magnitude of the change in ET10 value in mice treated with 100 mg/kg morphine was similar to that of mice treated with 56 mg/kg; however, the time course of this decrease was shifted temporally. We speculate that
treatment with 100 mg/kg morphine produced a more severe withdrawal
35
magnitude of withdrawal severity. Taken together, these data suggest that a change in latency to respond on the hot plate is a sensitive measure of morphine withdrawal; however, time, dose and hot plate temperature are all critical
variables to consider when using this measure.
The second experiment demonstrated that changes in thermal sensitivity during withdrawal could be attenuated by treatment with buprenorphine.
Buprenorphine was selected because it is commonly used in agonist
replacement therapy for opioid dependence (Kraus et al., 2011). Mice received either saline or a non-antinociceptive dose (0.01 mg/kg) of buprenorphine during the withdrawal period, following the cessation of 5.5 days of 56 mg/kg morphine. The response latency of buprenorphine-treated mice was attenuated compared to saline-treated mice at 24 and 32 hrs. Mice that received saline during the withdrawal period showed the same course of withdrawal as mice similarly treated with 56mg/kg morphine in Experiment I.
36
data indicate that time of testing (early or late in the dark-cycle) can affect responding. Second, within-group variability for the jumping response is relatively large. As a result, it is more difficult to determine whether differences between experimental groups are significant when jumping is used to measure withdrawal.
The most notable limitation of the thermal sensitivity procedure examined here is the difficulty in automating the measure since it is time intensive and
requires observers who are well trained in the observation of hot plate responses. Nevertheless, the thermal sensitivity procedure could be adjusted for higher
throughput screening by examining latencies at a single temperature (52oC) and a single time point (24 or 32 hrs). Additionally, the procedure could be adapted for within subject (baseline v withdrawal period) or between subject (treatment group v untreated withdrawal group) designs.
37
38 FIGURES
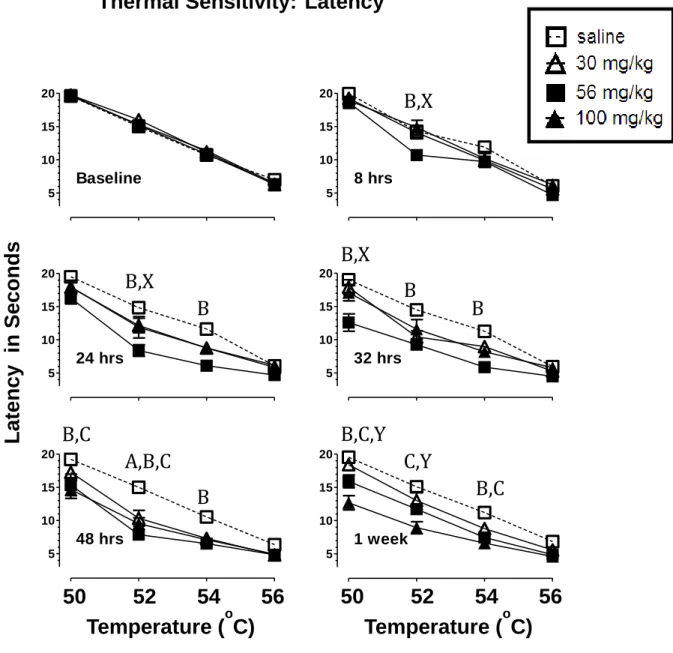
Fig. 2.1 Effects of 30, 56 or 100 mg/kg morphine or saline treatment on latency (mean ±SEM) to respond on the hot plate at 50, 52, 54, and 56o C. Morphine or saline treatment consisted of 5.5 days of twice daily injections (s.c.). Latency on the hot plate was determined at baseline and at 8, 24, 32, 48 hrs, and 1 wk after the final injection. Abscissa: hot plate temperature in o C. Ordinate: latency to respond in seconds. N=7-8. Statistically significant differences (p<0.001) are indicated as follows: A= 30 mg/kg v. sal, B= 56 mg/kg v sal, C= 100 mg/kg v sal, X= 56 mg/kg v 30 and 100 mg/kg, Y= 100 mg/kg v 30 mg/kg.
L
aten
cy
i
n
Se
co
n
d
s
50 52 54 56
Temperature (
oC)
5 10 15 20 Baseline 5 10 15 20 24 hrs 5 10 15 20 48 hrs
50 52 54 56
Temperature (
oC)
5 10 15 20 32 hrs 5 10 15 20 1 week 5 10 15 20 8 hrs
Thermal Sensitivity:
Latency
B,X
B
B
B
39
Fig. 2.2 ET10 values (mean ±SEM) for mice following 5.5 days of 30, 56 or 100 mg/kg morphine or saline treatment. ET10 values represent the
temperature that would produce a 10 sec response on the hot plate. Response latency on the hot plate was determined at baseline and at 8, 24, 32, 48 hrs and 1 wk after the final injection. N=8. Statistically significant differences are
indicated as follows: *= a difference from the group’s baseline, # = a difference between morphine and saline treated mice at a particular time point. p<0.001
Thermal Sensitivity: ET10
BL 8 24 32 481wk BL 8 24 32 481wk BL 8 24 32 481wk BL 8 24 32 481wk
50 52 54 56
saline 30mg/kg 56mg/kg 100mg/kg
*
*
*
#*
#*
#*
#*
#*
#*
T
em
p
er
at
u
re
40
Fig. 2.3 The effect of 0.01 mg/kg buprenorphine on withdrawal from 5.5 days of 56 mg/kg morphine. A. Dose-effect curves for buprenorphine (0.01- 0.32 mg/kg) at 50, 52, 54, and 56oC. Mean latencies (±SEM ) are presented as % maximum possible effect (%MPE). B. ET10 values (mean ±SEM) for mice
treated with 0.01 mg/kg buprenorphine or saline following 5.5 days of 56 mg/kg morphine. ET10 values represent the temperature that would produce a 10 sec response on the hot plate. Response latency on the hot plate was determined at baseline and at 8, 24, 32, and 48 hrs after the final morphine injection. Mice received 0.01 mg/kg buprenorphine (s.c.) 30 min prior to each hot plate test session. N=8. Statistically significant differences are indicated as follows: *= a difference from the group’s baseline, # = a difference between buprenorphine and saline treated mice. p<0.001
Buprenorphine Dose Effect Curve
0 50 100
50oC
52oC 54oC 56oC
0.01 0.032 0.1 0.32
Buprenorphine (mg/kg) % M P E Buprenorphine During Withdrawal BL 8hrs
24hrs 32hrs 48hrs
41
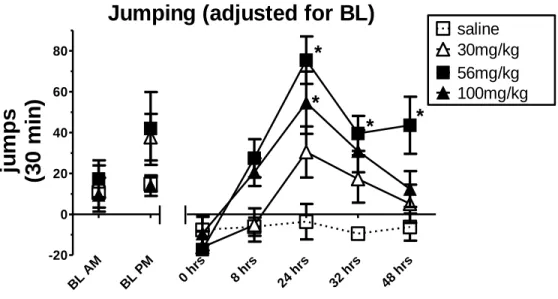
Fig. 2.4 Jumps (mean ±SEM) adjusted for baseline following 30, 56 or 100 mg/kg morphine or saline. Morphine or saline treatment consisted of 5.5 days of twice daily injections (s.c.). Jumping was determined at baseline and at 0, 8, 24, 32, and 48 hrs after the final injection. Baseline jumps indicate total jumping in 30 min at 10am and 6pm. Jumps at 0, 8, 24, 32, and 48 hrs indicate jumps observed during the 30-min withdrawal period minus the average number of jumps that occurred during the corresponding baseline period. Data obtained for the 0, 24, and 48 hrs withdrawal period fell in the AM; therefore, total jumps were adjusted using baseline measures from the AM period. Data obtained for the 8 and 36 hrs withdrawal period fell in the PM; therefore, total jumps were adjusting using baseline measures from the PM period. N=8. * = a statistically significant difference compared to saline treated mice. p<0.001
Jumping (adjusted for BL)
BL AM
BL P M
0 hr s
8 hr s
24 hrs 32 hrs 48 hrs
Chapter 3
The effect of wheel access on morphine withdrawal in C57BL/6J mice
INTRODUCTION
There is a growing body of literature examining the effects of voluntary exercise on responses to drugs of abuse. In humans, short periods of aerobic exercise have been shown to reduce the desire for alcohol and tobacco (Ussher et al. 2004; Taylor and Katomeri 2007). Exercise also reduces symptoms of nicotine withdrawal and aids in smoking cessation (Taylor and Ussher 2005; Taylor and Katomeri 2007). It is possible that such behavioral effects are due to increases in levels of endogenous opiates following aerobic exercise in the blood (Mahler et al. 2009; Cohen et al. 2010) as well as in the brain (Becker et al. 2008).
43
potency, suggesting that running may alter the functioning of the opiate system (Kanarek et al. 1998; Mathes and Kanarek 2001; Smith and Yancey 2003; Smith and Lyle 2006). Beyond altering acute drug effects, wheel access also reduces cognitive deficits and anxiety associated with spontaneous morphine withdrawal in rats (Miladi-Gorji et al., 2011, 2012).
Given the evidence suggesting that exercise can alter the effects of
opioids, the present study examines the effect of access to running wheels in the home cage on spontaneous morphine withdrawal in mice. Withdrawal is
assessed following the termination of a regimen in which mice receive injections of either 30 or 56 mg/kg morphine (s.c.) twice-daily over a period of six days.
Withdrawal severity is examined at multiple time points (8, 24, 32 and 48 hrs) following the termination of morphine administration. Unlike withdrawal that is precipitated by an opioid antagonist such as naloxone, spontaneous
withdrawal takes place over an extended time period that allows mice to have access to running wheels throughout the withdrawal period. Additionally,
spontaneous withdrawal, as opposed to antagonist precipitated withdrawal, more closely parallels the human experience.
44
both humans (Angst et al. 2003; Compton et al. 2003) and rodents (Tilson et al. 1973; Dunbar and Pulai 1998; Crain and Shen 2007; Rubovitch et al. 2009).
In addition, this study examined the relationship between access to a running wheel, attenuation of opioid withdrawal and endogenous opioid activity. Specifically, the effect of wheel access on opioid withdrawal was examined in the presence of the opioid antagonist, naltrexone. Studies have also shown that naloxone, a similar opioid antagonist, can precipitate opiate-like withdrawal following aerobic activity and beta-endorphin administration (Kanarek et al., 2009; Park et al., 2012). In the present experiment naltrexone, as opposed to naloxone, was used because it has a higher potency (Verebey and Mulé, 1975) as well as a lower Kifor both mu opioid receptor binding and antagonist activity
(Wang et al., 2007). Furthermore, naltrexone is selective for the mu and kappa opioid receptors as compared to the delta receptor (Wang et al., 2007).
45 METHODS
Animals
All experiments were conducted in male C57BL/6J mice (Jackson Labs, Raleigh, NC), 10 weeks of age upon delivery. Male C57BL/6J mice were selected to allow comparison with other data collected in our laboratory as well as the extensive behavioral literature in these mice. Additionally, in comparison to other inbred strains, C57BL/6J mice are known to be highly sensitive across many behavioral assays. Specifically, they exhibit high sensitivity in measures of acute
nociception (Mogil et al 1999), naloxone precipitated morphine withdrawal (Kest et al. 2002) and morphine self-administration (Elmer et al. 2009). Finally,
C57BL/6J mice are known to exhibit high rates of voluntary wheel running (Clark et al. 2011).
46
were approved by the Institutional Animal Care and Use Committee, and the methods were in accord with the “Guide for the Care and Use of Laboratory
Animals” (Institute of Laboratory Animal Research, Commission on Life Sciences, National Research Council, 2011).
Experimental Procedures
Experimental Groups: Mice were assigned to one of four groups during
each of three, three-week experimental sessions (described below). New mice were used for each experiment.
Experiment I: 1) morphine treatment (30 mg/kg), no wheel access; 2) morphine treatment (30 mg/kg), wheel access; 3) saline, no wheel access and 4) saline, wheel access. N=8 for morphine treated mice, n=7 for saline treated mice.
Experiment II: 1) morphine treatment (56 mg/kg), no wheel access; 2) morphine treatment (56 mg/kg), wheel access; 3) saline, no wheel access and 4) saline, wheel access. N=8 for all groups.
Experiment III: All mice were treated with 56 mg/kg morphine. Naltrexone or saline was administered 32 hrs after the final morphine injection. 1) naltrexone (0.01 mg/kg), no wheel access; 2) saline, no wheel access; 3) naltrexone (0.01 mg/kg), wheel access and 4) saline, wheel access. N=8 for all groups.
Wheel Access: Mice in wheel access groups had Med Associates Mouse
47
was monitored continuously (24 hr/day) via a computer equipped to record radio signals from the wheels.
Thermal Sensitivity: Thermal sensitivity was assessed using a hot plate
analgesia meter (25.3 × 25.3 cm), Columbus Instruments, Columbus, OH. During each 1-hr hot plate testing period, a temperature-effect curve was
determined for each mouse. Sensitivity was evaluated by recording the latency to lick or flutter the hind paw(s), or to jump from the hot plate surface at each of four temperatures presented in the following order: 50, 54, 52, 56oC with 15-min intervals between temperatures. Response latency was measured to the nearest 0.1 sec. To prevent tissue damage, a predetermined cutoff time of 20 sec was defined as the maximal trial duration. Immediately following the termination of a trial, whether due to a mouse’s response or elapsed cutoff time, mice were removed from the hot plate surface. Parameters were selected based on prior work in our laboratory regarding responses on the hot plate (e.g. Fischer et al. 2008).
Experimental Protocol: On day one, thermal sensitivity was assessed in all
48
later on day 15, morphine or saline administration began as described below and continued for 5.5 days. Immediately following the final injection of morphine or saline (day 20), thermal sensitivity was assessed again, and wheels were returned to the cages of mice in the wheel access groups. Following the last dose of morphine, thermal sensitivity was assessed four more times in
Experiment I and II: at 8 hrs after the final injection (6:00 pm on day 20), at 24 hrs (10:00 am on day 21), at 32 hrs (6:00 pm on day 21) and at 48 hrs (10:00 am on day 22). In Experiment III, thermal sensitivity was assessed three more times: at 24 hrs after the final injection (10:00 am on day 21), at 32 hrs (6:00 pm on day 21) and at 56 hrs (6:00 pm on day 22). This period (days 20-22) was designated the withdrawal period.
* = 1 week of wheel exposure for mice in wheel access groups
BL= Baseline assessment of thermal sensitivity on the hot plate. WD= 8, 24, 32 and 48hr hot plate test sessions after the final morphine injection.
Pharmacological Procedure: During the saline/morphine administration
period, doses of saline, 30 mg/kg or 56 mg/kg of morphine were administered daily for 5.5 days, with injections occurring at 10:00 am and 8:00 pm daily (11 injections total). In Experiment III, 0.01mg/kg naltrexone was administered
49
(Bethesda, MD, USA), were dissolved in 0.9% saline to yield all concentrations. Doses were injected subcutaneously at a volume of 0.1 ml/10 g.
Data analysis
Data are presented as response latencies on the hot plate, expressed as means (+SEM) at each of the four temperatures. For each experimental group, a 2-way repeated measures ANOVA revealed no difference between baseline 1 and baseline 2; therefore, baselines were averaged for all analyses. Each experiment was first analyzed using a 3-way repeated measures ANOVA, with time and temperature as repeated measures factors and group as an
independent factor. For the 3-way ANOVA, an alpha level of significance was set at p<0.01. Following the 3-way ANOVA, appropriate follow-up contrasts and Student’s t-tests were performed using a fully saturated mixed model of the data. The model was a straight model of the means and included random intercepts for each animal. Statistical analyses were conducted with an alpha level of
significance set at p<0.001. The alpha level was determined using Bonferoni
corrections to account for the large number of comparisons. The ANOVA’s were
50 RESULTS
In general, three findings were consistent for experiments I and II. First, latency to respond on the hot plate decreased as a function of temperature. Response latencies in both saline and morphine-treated mice were at or close to the maximal value of 20 sec when the hot plate was set at 50oC; at 52, 54 and 56oC. Latency to respond on the hot plate decreased as a function of
temperature. Second, response latencies at the 0 (data not shown), 8, 24, 32 and 48-hr time points for saline-treated mice were never significantly different from baseline, calculated as the average of baseline 1 and 2, indicating that repetition of testing did not produce measurable effects on response latency. Third,
response latencies for all groups of saline-treated mice were nearly identical at all time points.
In addition, immediately following the final morphine injection (0 hr), response latencies were at the cut off value of 20 sec at all temperatures for morphine-treated mice; consequently these data are not shown. The failure to respond within in the 20 sec maximal trial duration indicates a full antinociceptive response to acute morphine exposure.
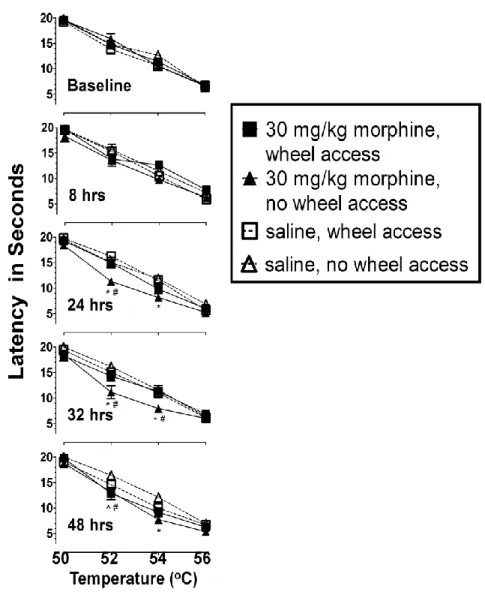
Experiment I: The effect of wheel access following 30 mg/kg morphine Fig. 3.1 shows latency to respond on the hot plate as a function of
51
measures ANOVA revealed a time x temperature x group interaction F(36, 312)= 1.93, p=0.002. Follow up contrasts and Student’s t-tests were then used to compare individual groups, time points, and temperatures. Although the
temperature-effect curves revealed the same orderly relationship in all mice and at all time points, the curves of the mice in the morphine-treated/no wheel group were displaced downward from those obtained at baseline. This displacement was significant at 24, 32 and 48 hrs following the final morphine injection. F(4,494)= 11.23, 11.51, 6.53, respectively, p<0.001.
Significant differences between the morphine-treated/no wheel mice and saline-treated mice were apparent at a 24 hrs (52 and 54 oC), 32 hrs (52 and 54oC) and at 48hrs (54 oC): F(2,494)= 16.14, 10.30, 17.15, 9.36, 11.59, respectively, p<0.001. These differences suggest that mice treated with 30 mg/kg of morphine for 5.5 days and then withdrawn from morphine were more sensitive to the thermal stimulus than mice treated with saline at 24, 32 and 48 hrs. Furthermore, response latencies of mice that were treated with morphine and given access to running wheels during the withdrawal period were
significantly different from those of mice that did not have access to wheels during the withdrawal period at 24 hrs (52 oC), 32 hrs (52 and 54 oC) and at 48hrs (52 oC): t494= 4.13, 3.59, 3.80, 4.13, respectively, p<0.001.
52
mg/kg of morphine and produced response latencies similar to those seen in saline controls.
Experiment II: The effect of wheel access following 56 mg/kg morphine Fig. 3.2 shows latency to respond on the hot plate as a function of
temperature at baseline, 8, 24, 32 and 48 hrs following termination of the 5.5 day treatment period of either 56 mg/kg morphine or saline. A 3-way repeated
measures ANOVA revealed a time x group interaction F(12, 112) = 4.50, p<0.001 and a temperature x group interaction F(9, 84)=4.75, p<0.001. Follow-up
contrasts and Student’s t-tests were then used to compare individual groups, time points, and temperatures. The temperature-effect curves again revealed an orderly relationship in all mice and at all time points. Additionally, the curves of morphine-treated/no wheel mice were again displaced downward from those obtained at baseline and this displacement was significant at 8, 24, 32 and 48hrs following the final morphine injection F(4, 532)= 6.70, 10.75, 12.60, 14.35,
respectively, p<0.001.
53
morphine were more sensitive to the thermal stimulus at 8, 24, 32 and 48 hrs than mice treated with saline.
Furthermore, response latencies of mice that were treated with morphine and given access to running wheels during the withdrawal period were
significantly different from those of mice that did not have access to wheels during the withdrawal period at 8 hrs (52 and 54 oC) t532= 3.44, 3.53, p<0.001; at
24hrs (52 and 54 oC) t532= 4.09, 4.97, p<0.001; at 32hrs (50, 52, 54 oC) t532= 3.75,
4.78, 5.95, p<0.001; and at 48hrs (52 and 54 oC) t532= 4.09, 4.97, p<0.001.
There were no significant differences in the response latencies of morphine-treated mice with wheel access and those of saline-treated mice. Taken together, these data further support the hypothesis that wheel access attenuated the increase in thermal sensitivity observed during withdrawal from 56 mg/kg of morphine and produced latencies similar to those seen in saline
controls.
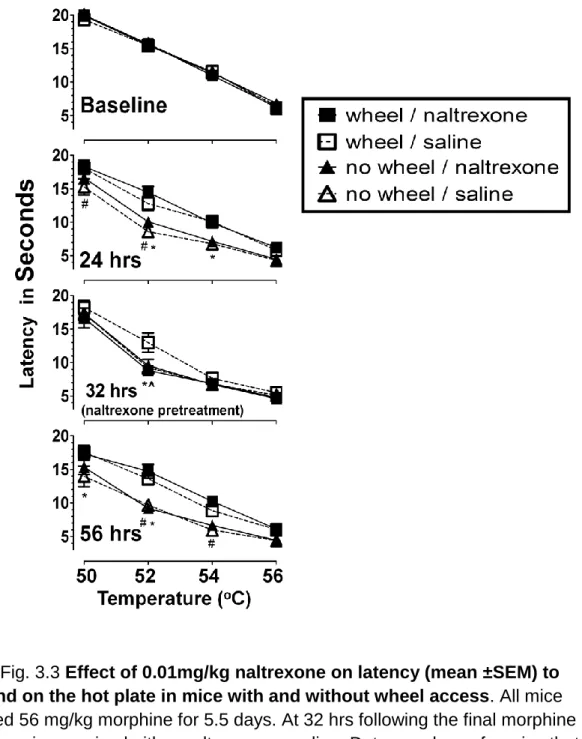
Experiment III: 0.01 mg/kg Naltrexone blocks the effect of wheel access Fig. 3.3 shows latency to respond on the hot plate as a function of temperature at baseline, 24, 32 and 56 hrs following termination of the 5.5 day treatment period of 56 mg/kg morphine. A dose of 0.01mg/kg naltrexone or saline was administered immediately prior to the 32 hr time point. A 3-way repeated measures ANOVA revealed a time x group interaction F(9, 84)= 10.63, p<0.001, respectively. Follow-up contrasts and Student’s t-tests were then used to
temperature-54
effect curves again revealed an orderly relationship in all mice and at all time points. Prior to naltrexone treatment, at 24hrs, response latencies of mice in the naltrexone/wheel access group were significantly different from those of the naltrexone/no wheel access: at 50 and 52oC, t420= 1.75, 4.59, p<0.001.
Significant differences were also apparent between the response latencies of mice in the saline/wheel access and the saline/no wheel access groups: at 52 and 54oC, t420= 4.36, 3.42, p<0.001. There were no differences between the
responses of the two groups that had wheel access and the two groups that did not have wheel access.
At 32 hrs, a significant difference was apparent between the response latencies of the saline and naltrexone treated wheel access groups, F(4, 420)=4.94, p<0.001. Latencies of the wheel access/saline group were also significantly different from those of the no wheel access groups at 52oC F(2, 420)= 9.26, p<0.001. Additionally, there was no significant difference between responses of the wheel access group treated with naltrexone and those of the no wheel access groups: latencies at 50, 52, 54, 56oC F(2, 420)= 0.32, 0.31, 0.01, and 0.14, respectively, p>0.7.
At 56 hours, response latencies of mice in the naltrexone/wheel access group were again significantly different from those of the naltrexone/no wheel access: at 52 and 54oC, t420= 5.73, 3.74, p<0.001. Significant differences were
also apparent between the response latencies of mice in the saline/wheel access and the saline/no wheel access groups: at 50 and 52oC, t420= 3.76, 4.08, p<0.001.