THE INFLUENCE OF LOWER EXTREMITY MOVEMENT QUALITY AND BODY COMPOSITION ON LOWER EXTREMITY BONE STRESS INJURY OCCURRENCE IN
DIVISION I CROSS COUNTRY ATHLETES
Yana I. Ginzburg
A thesis defense submitted to the faculty at the University of North Carolina at Chapel Hill in partial fulfillment of the requirements for the degree of Bachelor of the Arts in the Exercise and
Sport Science in the College of Arts and Sciences.
Chapel Hill 2016
ABSTRACT
Yana I. Ginzburg: The Influence of Lower Extremity Movement Quality and Body Composition on Lower Extremity Bone Stress Injury Occurrence in Division I Cross Country Runners
(Under the direction of Darin A. Padua)
ACKNOWLEDGEMENTS
I am amazingly fortunate in the professors who have comprised my thesis committee. I would firstly like to acknowledge my advisor, Dr. Darin Padua, without whose knowledge and expertise this project would not have been possible. It is additionally due to the work of Dr. Kristin Kucera and Dr. Abbie Smith-Ryan that my thesis has taken shape. All of this would not have been possible without their hard work in helping me understand ideas, partaking in various discussions, posing thought provoking questions, as well as providing insightful comments and constructive criticisms. For all that they have put forth, I am incredibly thankful.
I would also like to express my endless gratitude to another committee member, Timothy Mauntel – Dr. Mauntel in just a few short weeks – whom I have truly come to see not just as a teacher but also as a mentor. I am appreciative not only of his vast contributions to this project, but also his patience and guidance over the last three years. This includes the large amount of exposure he has allowed me to acquire in the research and sports medicine worlds, as well as the associated skills that he has taught me. It is through his guidance, and the many experiences that he has allowed me to partake in, that I have gradually began to learn how to do research. It is due to him that my interest in research has been piqued, and that my experiences in the Sports
I am additionally indebted to my friends and significant other. Their involvement has included everything from acting as study participants to practice my laboratory skills, modeling for the images in this project, as well as repeatedly listening to my rehearsals and attending my presentations. Their willingness to help, as well as encouragement and care in various form, has been essential in my work. Additionally, I am thankful for my parents, who have supported and encouraged me unconditionally as always. I am deeply appreciative of their belief in me.
TABLE OF CONTENTS
LIST OF TABLES ... ix
LIST OF FIGURES ... x
LIST OF ABBREVIATIONS ... xi
CHAPTER I: INTRODUCTION ... 1
1.1 – Background ... 1
1.2 – Statement of Problems and Hypotheses ... 3
1.3 – Variables ... 5
1.3a – Independent variables ... 5
1.3b – Dependent variables ... 6
1.4 – Definition of Terms ... 6
CHAPTER II: REVIEW OF LITERATURE ... 7
2.1 – Introduction ... 7
2.2 – Predisposing Factors ... 13
2.3 – Movement Assessments ... 21
3.1 – Experimental Design ... 25
3.2 – Participants ... 25
3.2a – Participant Inclusion Criteria ... 26
3.2b – Participant Exclusion Criteria ... 26
3.3 – Instrumentation ... 26
3.3a – Dual Energy X-ray Absorptiometry (DEXA) ... 26
3.3b – Electronic Medical Record (Blue Ocean) ... 27
3.4 – Procedures ... 27
3.4a – Protocol ... 27
3.4b – Movement Assessments ... 28
3.4c – Body Composition ... 31
3.4d – Injury Tracking ... 32
3.5 – Data Reduction ... 33
3.6 – Data Analysis ... 34
CHAPTER IV: RESULTS ... 35
4.1 – Demographics (Gender, Height, and Age) ... 35
4.2 – Body Composition Measures ... 37
CHAPTER V: DISCUSSION ... 41
LIST OF TABLES
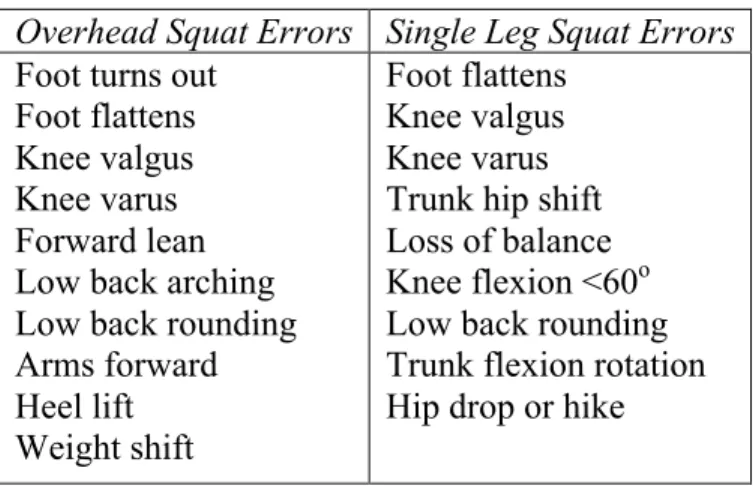
Table 1 – Overhead and Single Leg Squat Errors ...31
Table 2 – Bone Stress Injury Overview ...36
Table 3 – Demographics ...36
Table 4 – General Body Composition Measures ...38
Table 5 – Lower Extremity Specific Body Composition Measures ...39
Table 6 – Total Errors During Overhead and Single Leg Squats ...40
Table 7 – Overhead Squat Specific Errors ...40
LIST OF FIGURES
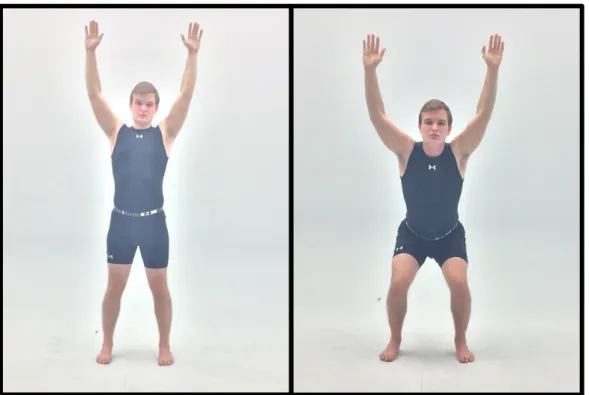
Figure 1 – Overhead Squat (Frontal View) ...28
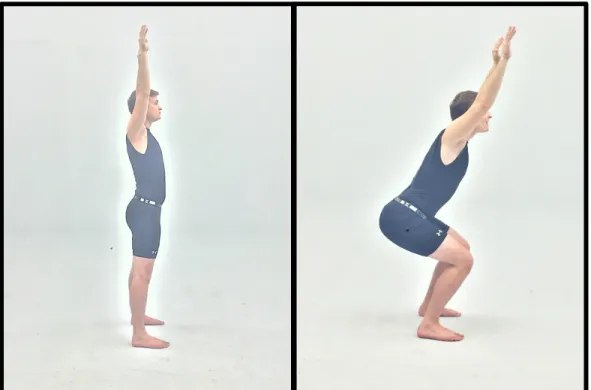
Figure 2 – Overhead Squat (Sagittal View) ...29
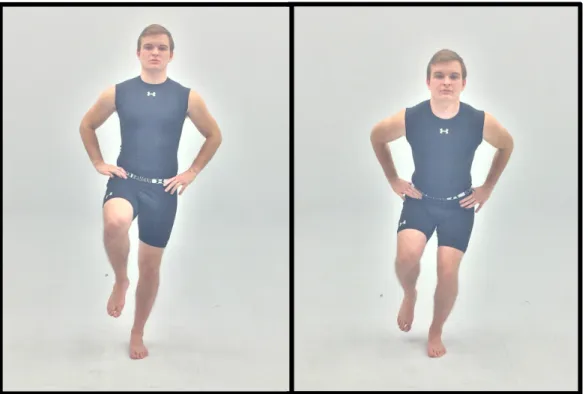
Figure 3 – Single Leg Squat (Frontal View) ...30
Figure 4 – Single Leg Squat (Sagittal View) ...30
LIST OF ABBREVIATIONS
BSI Bone Stress Injury (Stress Reactions and Stress Fractures) DEXA Dual Energy X-Ray Absorptiometry
EMR Electronic Medical Record OHS Overhead Squat
CHAPTER I
INTRODUCTION
1.1 – Background
Lower extremity injuries are detrimental to a runner’s well-being, and have implications that are physical, psychological, and financial. Physical costs include decreased performance and quality of life.1 Psychological effects may include mood disturbances, depression, and loss of self-esteem.2 Little data is present on the financial costs of lower extremity injuries in runners, but for only one particular injury they may be potentially as high as $376 million per year or greater.3
one that progresses from a stress reaction if the symptoms are not identified early enough or if the stress reaction is left untreated.10 A stress reaction is defined as the exposal of bone to unusual stress that results in pain and tenderness.11 Among Division I collegiate athletes, track and cross country athletes are one of groups of athletes most frequently affected by stress fractures.12 Bone stress injuries include both stress reactions and stress fractures.
Common stress bone stress injury sites include the metatarsals and the medial portion of the tibia.13 In seasoned runners, these injuries commonly occur following alterations in running habits – which may include alterations in running volume, changes in the route the individual is running, or different shoes.14 With proper preventative measures, bone stress injuries are
preventable lower extremity injuries.15 Once diagnosed however, rest is essential to allow adequate time for the bone reformation process to occur. If the athlete does not take adequate rest, there is potential for the stress reaction to progress to a stress fracture10 to then to turn into a complete fracture of the bone.14
Due to the high volume of lower extremity injuries in runners, it is imperative that steps be taken to identify individuals likely to incur bone stress injuries in order to mitigate their potential for injury. To date, no study has investigated the influence of preseason movement assessments utilizing clinical evaluations such as the single leg squat and overhead squat, and DEXA body composition information on bone stress injury development in Division I cross country athletes. Thus, the first aim of this study was to determine how lower extremity movement patterns differ between runners who go on to sustain a lower extremity bone stress injury and those who do not. The second aim of this study was to examine the differences in means between injured and uninjured groups in relation to various body composition variables as determined by DEXA.
1.2 – Statement of Problems and Hypotheses
1) Research Question 1: What are the effects of lower extremity movement patterns, as measured by visually observed clinical movement assessments, on bone stress injury frequency among collegiate cross-country athletes?
i. Research Question 1a: What are the effects of lower extremity movement patterns, as measured by the overhead squat, on bone stress injury frequency among collegiate cross-country athletes?
ii. Research Question 1b: What are the effects of lower extremity movement patterns, as measured by the single leg squat, on bone stress injury frequency among collegiate cross-country athletes?
• Hypothesis: Athletes who go on to sustain a bone stress injury will have more abnormal movement patterns in their single leg squat preseason assessments.
2) Research question 2: What are the effects of body composition, as measured by Dual Energy X-ray Absorptiometry (DEXA), on bone stress injury frequency among collegiate cross-country runners?
i. Research question 2a: What are the effects of a low bone mineral density on bone stress injury frequency among collegiate cross-country runners?
• Hypothesis: Athletes who go on to sustain a bone stress injury will have lower than average bone mineral density in their preseason assessments. ii. Research question 2b: What are the effects of lean mass on bone stress injury
frequency among collegiate cross-country runners?
• Hypothesis: Athletes who go on to sustain a bone stress injury will have lower than average amounts of lean mass in their preseason assessments. iii. Research question 2c: What are the effects of percent body fat on bone stress injury
• Hypothesis: Athletes who go on to sustain a bone stress injury will have lower than average amounts of body fat in their preseason assessments. 1.3 – Variables
1.3a – Independent variables
1) Movement patterns during the overhead squat a. Foot turns out
b. Foot flattens c. Knee valgus d. Knee varus e. Forward lean f. Low back arching g. Low back rounding h. Arms forward i. Heel lift j. Weight shift
2) Movement patterns during the single leg squat a. Foot flattens
e. Loss of balance f. Knee flexion <60o g. Low back rounding h. Trunk flexion rotation i. Hip drop or hike 3) Body composition
a. Bone mineral density b. Lean mass
c. Percent body fat
1.3b – Dependent variable
1) Bone Stress injury (stress fracture or reaction) 2) No bone stress injury (stress fracture or reaction) 1.4 – Definition of Terms
1) Stress reaction: exposure of a bone to unusual stress that results in pain and tenderness but is reversible.11
2) Stress fracture: a gradual but incomplete break of the bone, resulting from its inability to withstand repeated excessive forces. For diagnosis, requires that an originally normal bone experience no direct trauma but rather progressive causal activity, pain and
CHAPTER II
REVIEW OF LITERATURE 2.1 – Introduction
Lower extremity overuse injuries are rampant in elite athletes, and elite cross-country runners are no exception. In particular, an analysis published in 2015 reviewing quality scholarly journal articles found that over the course of a 13 week season, about 19.7% of cross country runners had a time loss injury. The lower leg was the most affected area at 30.3% of all injuries, followed by the knee at 22.5% and the ankle at 16.2%.5 The total incidence of running overuse injuries was found to be 0.0675 per 1000 km of running exposure;24 to contextualize this
exposure, a study of young female cross-country runners found that the average weekly distance ran was 55.5±18.0 kilometers per week.25
to be affected by patellofemoral pain. Thus, with differing information present, there is no clear indication of whether one sex is more likely to get injured than the other.
The cost of lower extremity overuse injuries is extremely varied. However, each different type of injury bears a burden on the individuals it affects. These burdens are both financial and physical. Financial costs of lower extremity overuse injuries can be broken down into two categories – direct medical costs and reduced productivity costs. The first category of direct medical costs includes services delivered by a physician, physical therapist, or other specialist. This also includes expenses for diagnostic imaging, medications, and disposables used by these healthcare providers. The second category of reduced productivity costs refers to the amount of money lost at work due to the individual’s inability to perform at his/her full capacity. This may be as severe as the total absence from work.1 Data for these costs are lacking. However, as of 2007, the fiscal liability of patellofemoral pain in the US due to treatment costs alone was $192 to $376 million.3
Physical costs of lower extremity overuse injuries result in a decreased quality of life. This is due to the injury’s impacts on the individual’s mobility, ability to care of oneself, activity levels, pain, and anxiety.1 Lower extremity overuse injuries frequently occur in young
Previous lower extremity injury history has been a clear indicator of the high likelihood for future lower extremity injury.28,29 An estimated 31% of runners incur the same injury as previously, although they may have completed a rehabilitation program.24 This may be due to the fact that the runner continues to incur faulty movement patterns, which lead to tissue overload, cause functional adaptations, and ultimately lead to tissue damage and injury.30 Eventually, these structural and biomechanical changes become permanent and continue to increase the future possibility for lower extremity injury.31
A lower extremity overuse injury presents as tenderness and pain in a particular area when no evident trauma has occurred.32 It is a problem caused by running that limits the individual in speed, distance, length, or frequency for 7 days or more.33 The causes of lower extremity overuse injuries are multifactorial and vary with each type of injury,30 but are
generally attributable to the accumulation of repeated overloading of ground reaction forces upon the musculoskeletal system.34 The most frequent types of lower extremity overuse injuries seen in runners are stress fractures, patellofemoral pain, plantar fasciitis, and Achilles tendonitis.6-8
Stress fractures are the product of repetitive mechanical loading,35 with the bone
recovery time for the bone and resulting in a strain that is not attenuated over time.35 Ultimately, the question of whether a runner develops a stress fracture is also dependent upon his or her collection of overall factors, as not all runners of the same level exposed to the same training regime will go on to develop a stress fracture.35
Most stress fractures have been found to be associated with an abnormal foot arch – such as pes planus (low static arch index) and pes cavus (high dynamic arch index).38 Other factors include limited ankle dorsiflexion and knee varus alignment.39 The two main types of stress fractures are metatarsal stress fractures and medial tibial stress fractures.13
Metatarsal stress fractures are the most common affliction of the foot,40 with the second, third, and fourth metatarsals most frequently affected.41 This particular type of stress fracture has been found to be associated with increased hind foot inversion38 as well as a loading of the plantar flexors and Achilles tendon.34 In addition, Hughes et al.36 found that individuals with a notable decrease in ankle dorsiflexion were 4.6 times more likely to develop a metatarsal stress fracture when compared to their full range of motion counterparts.
the amounts of compression, tension, and torsional forces of longer tibias.13,42 Rearfoot eversion has also been found as an association.42 Running competitively may also predispose an
individual to a tibial stress fractures, as their incidence is found at a higher rate in elite runners when compared to recreational runners.13
Patellofemoral pain (PFP) is commonly observed in long-distance runners, with an incidence rate of 0.0135 injuries per 1000km run.24 Abnormal joint ranges of motion causing biomechanical compensations have been implicated47 – such as excessive active hip adduction range of motion,48 limited active ranges of motion in the hip internal and excessive hip external rotations39 as well as limited ankle dorsiflexion.47 In addition, there is an association between large quadriceps angles (Q-angles) and patellofemoral pain. A larger than normal Q-angle may laterally displace the patella as the quadriceps muscles contract, pressing it against the lateral femoral condyle and leading to discomfort.49 Additionally, running with a rear foot (heel) strike pattern may increase joint stress.50,51 This is due to the fact that at impact, the body of a heel striker receives a high impact strike that is approximately 1.5-3 times the individual’s body mass – leaving little time and therefore ability for the body to reduce the immense forces traveling up the kinetic chain51 – and specifically, to the patellofemoral joint.50
excess loading of the plantar-flexor muscles as well as the Achilles tendon.34 Excessive pronation increases tensile stresses to the plantar fascia insertion,54 also adding unnecessary stresses. Peak torque deficits of the plantar flexor muscles have also been implicated; thus, strength deficiencies play a role in plantar fasciitis, although it is not clear whether they are the cause or the result.54
2.2 – Predisposing Factors
Predisposing factors that influence runners to the aforementioned lower extremity
overuse injuries can be broken down into intrinsic and extrinsic. Intrinsic factors are internal and originate within the body,58 and include the individual’s biomechanics – both kinematics and kinetics – as well as anatomy.32 Extrinsic factors are external,58 and include factors such as the individual’s training regime.32 The amount that each factor contributes to a runner’s lower extremity overuse injury varies depending on the individual.35 Overall, these factors cause alterations in the runner’s body that necessitate compensatory changes, and reduce the body’s overall mechanical efficiency.41
Biomechanical kinematics is the analysis of body movements, disregarding the forces acting on the body that cause those movements.55 Kinematics can be considered an individual’s geometry of movement. The biomechanical kinematic factors that predispose runners to lower extremity injury include the magnitude of foot pronation as well as inadequate hip stabilization.39
Foot pronation is a normal part of movement. However, when it is excessive or occurs at the wrong time – such as in place of foot supination – issues arise.59 Excessive pronation tends to occur as a compensation for limited ankle dorsiflexion range of motion.39 As the deviations in pronation occur, they lead to deviations in internal tibial torsion, and ultimately create a strain on the lower extremity soft tissues59 – in particular, on the medial knee.60 Thus, excessive pronation is associated with stress fracture development due to its generation of undue torques and
anteversion.39 Femoral anteversion is an inward rotation of the femoral neck in the acetabulum, and is associated with an excess in active hip internal rotation and a limitation in active hip external rotation.39
Inadequate hip stabilization is another kinematic factor for lower extremity injuries in runners. It may primarily be attributed to reduced hip muscle strength.39 However, abnormal ranges of motion are also implicated. These include excessive active hip internal and restricted active hip external rotations, restricted active hip flexion,39 as well as excessive passive hip adduction48,61 and excessive active hip adduction39 range of motions. Excessive hip adduction is theorized to act as a compensatory mechanism for weak gluteus medius and gluteus maximus muscles,61 as well as potentially weak hip abductor muscles.48 Mauntel et al.61 proposed that the excessive hip adduction is due to a neuromuscular compensation for an inadequate ankle range of motion during functional tasks. Consequently, inadequate hip stabilization may occur due to the body’s inability to fire muscles as necessary during functional tasks.
Kinetics deals with the forces that produce motion.41 In relation to the biomechanics of runners, kinetic factors leading to lower extremity overuse injuries include the magnitude of impact forces as well as the rate of impact loading.
The magnitude of impact forces is a factor largely associated with potential for stress fractures. Heel striking, as opposed to forefoot striking, creates a significantly larger force for the body to attenuate – anywhere from 1.5 to 3 times the individual’s body weight.51 Over the course of a run, the repetitive motion of the foot hitting the ground places a great strain on the bone. The bone can withstand certain amounts of strain, and utilize the ground reaction forces to build the bone over an extended time period.35 However, past a particular amount of stress, the bone begins to accumulate microscopic damage. Although the bone can typically heal itself after incurring such damage, under certain conditions – such as a large impact force combined with inadequate recovery time – it exceeds the tissue’s capability to withstand damage and reaches an ultimate failure point where the bone tissue damage is irreversible.35 Thus, repeated stresses below a tensile load with adequate time for recovery do not cause lower extremity injury; however, inadequate time,33,64 as well as excessive peak impact force even if incurred in one particular instance,65 result in an overuse lower extremity injury. This is frequently seen in long distance runners that undergo high numbers of impact forces due to the extended length of the runs, creating a cyclic overload of impact forces35 that frequently affects performance.63 The size of impact forces varies with velocity of movement and surface of the movement, but is generally a multiple of the body weight.66 Ultimately, the effects of the large magnitudes of these forces also depend on the body’s ability to react to applied loads.35
force acting on the body is altered.66 Lower extremity injuries due to a high rate of impact
loading are frequently seen in sprinters; these individuals are exposed to high magnitude loads in short periods of time, predisposing them to lower extremity overuse injuries that result from high rate impact loading.35 The muscles act as shock absorbers during running and help offset forces that are transmitted proximally over the course of the runner’s gait. When those muscles are weak, tight, or simply fatigued, their ability to offset impact forces is lessened and there are large stresses unnecessarily placed on the body.35 High rates of impact loading are particularly
detrimental when combined with improper body form.35 When those stresses exceed the tissue’s fatigue limit, injury may occur.64
found to have a greater lower extremity injury predisposition at shorter heights, theoretically due to greater mechanical loading.69 In men, a high percentage of body fat was correlated with lower extremity injury.67
Body composition can be determined using anthropometric measures such as DEXA scans.21,23 Knowing information about a runner’s body composition may help identify
individuals with increased chances for developing an injury.21 DEXA scans are used widely due to their precision, and provide information regarding bone mass, lean soft tissue, and fat
contents.23 However, its sources of error may include fluctuations in weight, body hydration, as well as content of the gastrointestinal juices and bladder.70 In addition, changes in the amount of fat present local to a bone may can cause alterations in the reading of bone mass that are not actually present, with more fat increasing bone mineral density measurements and less fat decreasing the measurements.23
found to be greater in runners when compared to non-training individuals.72 In particular, one study found that elite runners had a greater regional bone mineral density in the calcaneus when compared to soccer players as well as non-athletic sedentary controls.73 Contrastingly, elite runners have also been found to have a lumbar bone mineral density so low that it is equivalent to osteopenia, although it is unclear whether this may be due to chance variation or due to issues inherent in the runner.73
The body of a runner can be described using the somatotypic theory, which opts to describe an individual’s physique in terms of body shape and composition.74 Elite runners are typically sometimes mesomorphs, although more typically ectomorphs.75 Mesomorphs are typically muscular, whether visibly or with an obscure robustness; ectomorphs are those with a slender body type, frequently thin and lacking excess fat.74 When compared to the average runner, an elite runner has more of his/her body weight as lean tissue.75 This is beneficial, as too much fat tissue necessitates greater effort in accelerating the legs and thus utilizes too much increased energy expenditure.76 However, insufficient lean tissue may have inadequate lean body mass to attenuate for the stresses of the forces involved in running.77
loading on bone.35 Thus, attributes such as lower muscle cross sectional area – as well as weight - have been found to be associated with stress fractures.21 In females, lean mass has been
correlated with bone mineral density and bone mineral content.21 Females with stress fractures have been found to have lower lean mass and higher percentage of body fat as well as lower muscle cross sectional area.21
An individual’s Q-angle is measured by drawing an imaginary line from the intersection between the anterior superior iliac spine to the midpoint of the patella, as well as from the latter to the tibial tuberosity.59 This measure is an accurate depiction of the quadriceps muscle force vector – although with a slight underestimation of the lateral force.59 Large Q-angles are
correlated with higher rates of lower extremity injury.4,39 Although 20 degrees is commonly the upper boundary for normal values4, some studies suggest a more conservative value and have found a correlation between patellofemoral pain and a Q-angle of 15-20 degrees.49
Lack of muscular flexibility is a predisposing factor for lower extremity injuries.6
Inadequate flexibility may make a muscle more stiff than it otherwise would be, placing stress on its joints as compensation. This issue could also be indicative of a muscular imbalance, which would lead to early fatigue and altered biomechanics over the course of the run.30
Limited ranges of motion are causes for overcompensations that may cause lower extremity injuries.39 In particular, limited active ankle dorsiflexion has been frequently
gastrocnemius assists in supination in the subtalar and midtarsal joints, so a tight gastrocnemius prevents the ankle from reaching the normal range of motion for dorsiflexion.36 This leads to altered knee and joint movements – and can be visually observed as less knee flexion
displacement and ankle dorsiflexion displacement during functional tasks such as the overhead squat and single leg squat.78 In addition, this leads to increased knee valgus angle and medial knee displacement.78,79 Ultimately, this range of motion constraint leads to internal tibial torsion61 as well as foot pronation, both aspects of poor biomechanical patterns that predispose runners to lower extremity overuse injury.36,61
A runner’s training may be a major predisposing factor for lower extremity overuse injuries. In particular, high running frequency and excessive distance have a large impact, as do sudden changes in training routines and high volumes of intense runs. The number of days per week80 as well as the distance56,80 an individual runs are predisposing factors for lower extremity overuse injuries. This includes high frequency and mileage as well as running very little.29,31 Individuals running long distances frequently have higher rates of injury due to their exposure rate; however, those factors may also act as a protective mechanism – on the tissue as well as biomechanical levels – due to a musculoskeletal adaptive process that results in a decreased chance of injury.28,81 However, frequent runs of long distances do not allow for adequate
athlete’s chance of injury, as the latter has been found to not be associated with lower extremity injury.80 Contrastingly, running very little may be a predisposing factor as amateur runners frequently partake in training that exceeds their adaptive structural response;6 this may also hold true due to a novice runner’s poor technique.83 Ultimately, it has also been theorized that while there is a correlation between running frequency and distance and lower extremity injury, those increased injury variables interact with other factors – such as the runner’s biomechanics and anatomy.4 While a runner may meet the intrinsic criteria for a lower extremity injury, the individual may be asymptomatic until his/her mileage hits an extrinsic threshold level that leads the musculoskeletal system to mark the excessive stresses as injury.4
Sudden changes in training routines are also predisposing factors,56 due to the fact that these changes alter the rate of strain at particular sites35 as well as the actions that muscles use to attenuate those strains.14 In addition, an increased number of competitive runs80 has been
associaed, potentially due to overtraining. 2.3 – Movement Assessments
The single leg squat (SLS) is clinically used in conjunction with other movement
and is a good indicator of movement differences between males and females.86 Furthermore, there are components of everyday movement that are evidenced in aspects of the single leg squat.87 Lastly, it is overall a good representation of runner’s movement patterns during the flight phase of running, as approximately 40% of time is spent in the swing portion.88
The overhead squat (OHS) is useful for analyzing body alignment79 and has been found to be a valid tool for overall qualitatively assessing poor movement patterns.89 It is particularly useful when utilized in conjunction with range of motion and strength measurements.89 When the participant is performing an overhead squat, he is observed from three areas: anterior, lateral, and posterior.89 In the anterior view, the clinician should assess the first MTP and the knee.89 In the lateral view, the clinician should assess the extent to which the participant leans forward and lets his arms fall anteriorly.89 In the posterior view, the clinician can observe excessive pronation as well as the extent of medial longitudinal arch collapse.89
In the lateral view, the overhead squat task is used to ascertain medial knee
overhead squat task is used to ascertain excessive pronation, which is predisposing factor for several lower extremity injuries.89
The validity of the usage of range of motion of measurements has been extensively investigated, and appears to be a valid way of analyzing some of the causes in individuals’ limited movement patterns.91,92 Range of motion measurements allow for identification of overactive and weak muscles, with areas of particular tightness associated with limitations in certain muscular groups.89 Identifying tight or overactive musculature indicates what muscles to stretch and lengthen, whereas identifying weak or shortened musculature indicates what muscles to lengthen and strengthen.89
measurement may indicate limited stability in the foot, leading to early supination and a lateral shift of the foot.88
CHAPTER III METHODOLOGY 3.1 – Experimental Design
The purpose of this study was to investigate differences in lower extremity movement patterns and body composition measures between NCAA Division I cross-country athletes who go on to sustain a lower extremity bone stress injury and those who do not. This study employed a prospective cohort methodology. Athletes signed an approved consent form prior to
participation. Movement and body composition data were collected at the beginning of the season, and an electronic medical record (EMR) tracked lower extremity stress reactions and stress fractures over the following year.
3.2 – Participants
3.2a – Participant Inclusion Criteria
The study included the 2014-2015 population of male and female cross-country athletes at the University of North Carolina at Chapel Hill. All participants were aged 18 or older.
3.2b – Participant Exclusion Criteria
Individuals were excluded from this study if they were unable to complete functional movement testing due to lack of approval from the team physician or certified athletic trainer. Additionally, individuals who joined the team belatedly and were unavailable for baseline testing were also excluded. One male and one female athlete were excluded for this reason.
3.3 – Instrumentation
3.3a – Dual Energy X-ray Absorptiometry (DEXA)
3.3b – Electronic Medical Record (Blue Ocean)
The electronic medical record Blue Ocean (MedStatix, Lancaster, PA, USA) tracked all athlete illnesses and injuries for one year following initial testing. Athletic trainers and
physicians entered all injury information based on clinical evaluations and imaging studies. 3.4 – Procedures
3.4a – Protocol
Movement baseline data collection took place one day prior to the start of the cross-country season start. Participants arrived at the Sports Medicine Research Laboratory at the University of North Carolina at Chapel Hill. This research study was a portion of a larger study titled PRIME (Physical Readiness and Integrated Movement Efficiency), which aimed to investigate the effects of lower extremity injury and surgery on hip, knee, ankle, and trunk movement characteristics when matching injured participants to uninjured controls. Participants signed a University Biomedical Institutional Review Board informed consent form that described the procedures and risks identified with partaking in the research project. In addition, they
3.4b – Movement Assessments
• Overhead squat: participants completed 3 sets of 5 repetitions. Participants were instructed to stand with their feet shoulder width apart, toes pointed forward, and arms extended directly overhead. The descent phase of the squat involved the participant going into a flexed knee position as far as he/she was comfortably able, and ascent returned him/her back to the original position. Participants were given a minimum of one practice trial to become comfortable with the task.
Figure 2 – Overhead Squat (Sagittal View)
Figure 3 – Single Leg Squat (Frontal View)
Movement assessments were visually evaluated for movement compensations (errors) by a certified athletic trainer with experience grading clinical movement assessments. The certified athletic trainer’s intra-rater reliability for specific movement errors was determined to be between moderate and almost perfect when compared to Fusionetics. Overall, good intra-rater agreement exists for the OHS (kappa = 0.221 - 1; adjusted kappa [PABAK] = 0.12 – 1). This also holds true for the SLS (kappa = 0.257 – 0.779; adjusted kappa [PABAK] = 0.44 – 0.92). Grading for the squats was dichotomous, as either “observed error” or “did not observe error.” The athlete was considered to display the particular movement error if the athletic trainer observed the error on at least 3 of the 5 trials.
Table 1 – Overhead and Single Leg Squat Errors
Overhead Squat Errors Single Leg Squat Errors
Foot turns out Foot flattens Knee valgus Knee varus Forward lean Low back arching Low back rounding Arms forward Heel lift Weight shift Foot flattens Knee valgus Knee varus Trunk hip shift Loss of balance Knee flexion <60o Low back rounding Trunk flexion rotation Hip drop or hike
3.4c – Body Composition
computer. Participants laid in a supine position in the center of the scanning table with their hands faced palms-down at their sides and were instructed to minimize movement as much as possible. Outcomes of interest for the current study included lean mass (LM), fat mass (FM), body fat percentage (BF%), and bone mineral density (BMD).
Figure 5 – DEXA Machine
3.4d – Injury Tracking
proceedings of the injury, as well as any physician involvement. Participants were
dichotomously grouped into two categories, as having sustained a lower extremity stress fracture or bone stress reaction or not having sustained a stress fracture or bone stress reaction within one year of preseason testing. Lower extremity included any body part distal to hips. Stress fractures were confirmed via x-rays, MRI’s, and symptomatic differential diagnoses. A stress fracture was defined as an incomplete or complete fracture of the bone stemming from excessive forces acting on the bone.97 A bone stress reaction left untreated progresses to a stress fracture;10 both bone stress reactions and stress fractures were included in the search as symptoms and treatment are similar and differentiating between the two diagnoses is challenging.98 The research team relied on the diagnosis provided by the athletic trainers and physicians.
3.5 – Data Reduction
Data was compiled in a spreadsheet using Microsoft Office Excel (Microsoft Excel 2010; Microsoft Corporation; Redmond, WA). Information regarding each participant’s 2014-2015 lower extremity injury status, prior lower extremity injury status, movement, and body
composition data were entered. A coding scheme was developed to classify the data in a uniform manner. For the injured leg lean mass comparisons, the lean mass of the injured leg of the
3.6 – Data Analysis
Statistical Package for the Social Sciences, version 21 (SPSS, Armonk, NY) analyzed all data. Ten (10) chi-square analyses determined the differences in the proportions of individuals in the bone stress injury and non- bone stress injury groups displaying each overhead squat
movement error (foot turns out, foot flattens, knee valgus, knee varus, forward lean, low back arching, low back rounding, arms forward, heel lift, weight shift). Nine (9) additional chi-square analyses determined the differences in the proportions of individuals in the bone stress injury and non-bone stress injury groups displaying each single leg squat movement error (foot flattens, knee valgus, knee varus, trunk hip shift, loss of balance, knee flexion <60o, low back rounding, trunk flexion rotation, hip drop or hike). Independent samples t-tests investigated whether significant differences were present in the means between the bone stress injury and non bone stress injury groups in body composition measures (bone mineral density, fat free mass, and percent body fat) between the bone stress injury and non- bone stress injury groups.
CHAPTER IV RESULTS 4.1 – Demographics (Gender, Height, and Age)
There was a total of 10 bone stress injuries identified over the 1-year period, with one of the athletes sustaining more than one injury. Of the 10 injuries, 5 were stress fractures, 4 were stress reactions, and 1 injury was classified as unclear as to whether it was a stress reaction or stress fracture. Stress reactions were located in the tibia, fibula, and metatarsals, while stress fractures were located in the femur, pelvis, tibia, and metatarsals. An overview of the sex of the injured athlete, types of bone stress injury, injury locations and side of the body, as well as the date injury occurred are reported in Table 2.
19.67±1.80, NBSI = 19.79±1.52; t(35) = -0.179, p = 0.861). Group statistics for sex, height, and age are reported in Table 3.
Table 2. Bone stress injury overview. Presented according to type of bone stress injury, location of bone stress injury, and days from screening that the injury occurred.
Subject
Number Sex BSI Type
BSI Location BSI Body Side Days From Movement Screening Until Diagnosis
1 Female Fracture Tibia Left 58 days
2 Female Reaction 4th
metatarsal Right 88 days
3 Female Reaction Tibia and
Fibula Right 93 days
4 Female Fracture Tibia Left 116 days
5 Male Fracture Pelvis Left 226 days
6 Female Reaction/fracture 2nd metatarsal Right 253 days
7 Male Reaction
Fibula (proximal and distal)
Right 262 days
8 Female Fracture Tibia Right 272 days
8 Female Reaction Tibia Left 272 days
9 Female Fracture Femur Right 300 days
Table 3. Demographics. Presented as injury counts by genders, and height (cm), mass (kg), and age (years), mean ± standard deviation.
Variable Bone Stress Injury Stress Injury Non-Bone Total
Males 2 (22.2%) 18 (64.3%) 20
Females* 7 (77.8%) 10 (35.7%) 17
Total 9 (100.0%) 28 (100.0%) 37
Variable Mean ± SD Mean ± SD
Equal Variances Assumed
Equal Variances Not Assumed P Value Statistic T- P Value Statistic
T-Height 170.82±6.87 170.11±8.19 0.815 0.236 0.799 0.259
Age 19.67±1.80 19.79±1.52 0.846 -0.195 0.861 -0.179
4.2 – Body Composition Measures
Individuals who went on to sustain a bone stress injury had a lower BMI prior to the start of the season when assuming equal variances (BSI = 19.90±0.70 kg/m2, NBSI = 21.64±2.32 kg/m2; t(35) = 2.20, p =0.034) and when not assuming equal variances (BSI = 19.90±0.70 kg/m2, NBSI = 21.64±2.32 kg/m2; t(34.98) = 3.51, p =0.001). Injured individuals had a smaller mass when not assuming for equal variances (BSI = 57.31±3.18 kg, NBSI = 62.73±8.41 kg; t(32.56) = 2.77, p = 0.009) but this did not hold true when assuming for equal variances (BSI = 57.31±3.18 kg, NBSI = 62.73±8.41 kg; t(33) = 1.87, p = 0.070). Injured individuals additionally had a significantly smaller lean mass when not assuming equal variances (BSI = 44.03±3.97 kg, NBSI = 49.29±7.93; t(28.20) = 2.58, p =0.015) but not this did not hold true when equal variances were assumed (BSI = 44.03±3.97 kg, NBSI = 49.29±7.93; t(33) = 1.90, p =0.067). There were no differences between the bone stress injury and non-bone stress injury groups for fat mass, percent fat, percent lean mass, or bone mineral density (Table 4).
The leg that went on to sustain a bone stress injury had less lean mass compared to the average lower extremity limbs of the non-bone stress injury group when assuming equal variances (BSI = 4.65±1.72 kg, NBSI = 6.48±0.85 kg; t(32) = 4.13, p ≤ 0.001) and when not assuming equal variances (BSI = 4.65±1.72 kg, NBSI = 6.48±0.85 kg; t(8.08) = 2.92, p = 0.019). Bone stress injury injured leg lean mass as a percentage of the individual’s total mass was
NBSI = 10.35±0.32 kg; t(32) = 3.501, p = 0.001) but this did not hold true with equal variances not assumed (BSI = 8.25±3.11 kg, NBSI = 10.35±0.32 kg; t(7.04) = 1.905, p = 0.098). This was also the case when investigating the leg lean mass as a percentage of total lean mass; when equal variances were assumed, the total lean mass of the injured group was smaller than of the
uninjured group (BSI = 10.94±4.39 kg, NBSI = 13.24±0.83 kg; t(32) = 2.609, p = 0.014) but this was not the case when equal variances were not assumed (BSI = 10.94±4.39 kg, NBSI =
13.24±0.83 kg; t(7.15) = 1.473, p = 0.183). Injured leg lean mass, injured leg lean mass as a percentage of total mass, and injured leg lean mass as a percentage of total lean mass are reported in Table 5.
Table 4. General body composition measures. BMI, bone mineral density (g/cm2), mass (kg), fat mass (kg), lean mass (kg), percent fat (%), percent lean mass (%). Presented as mean ± standard deviation. Bone Stress Injury Non-Bone Stress Injury Equal Variances Assumed Equal Variances Not Assumed Variable Mean ± SD Mean ± SD P Value Statistic T- P Value Statistic
T-BMI*^ 19.90±0.70 21.64±2.32 0.034 2.203 0.001 3.514
Mass^ 57.31±3.18 62.73±8.41 0.070 1.872 0.009 2.765
Fat mass 10.33±1.78 10.11±1.90 0.771 -0.293 0.767 -0.302 Lean mass^ 44.03±3.97 49.29±7.93 0.067 1.896 0.015 2.577 Percent fat 18.38±3.53 16.62±3.49 0.203 -1.299 0.218 -1.291 Percent lean
mass
2.18±0.33 2.32±0.40 0.383 0.883 0.346 0.969
Bone mineral
density 1.11±0.07 1.13±0.09 0.503 0.677 0.465 0.748
Table 5. Lower extremity specific body composition measures. Injured leg lean mass (kg), injured leg lean mass percent of total mass (%), injured leg lean mass percent of total lean mass (%). Bone Stress Injury Non-Bone Stress Injury Equal Variances Assumed Equal Variances Not Assumed Variable Mean ± SD Mean ± SD P Value Statistic T- P Value Statistic T-Injured leg
lean mass*^ 4.65±1.72 6.48±0.85 ≤0.001 4.134 0.019 2.916 Injured leg
lean mass percent of total mass*
8.25±3.11 10.35±0.32 0.001 3.501 0.098 1.905
Injured leg lean mass percent of total lean mass*
10.94±4.39 13.24±0.83 0.014 2.609 0.183 1.473
*Indicates a significant difference between groups at p≤0.05 with equal variances assumed. ^Indicates a significant difference between groups at p≤0.05 with equal variances not assumed.
4.3 – Overhead and Single Leg Squats
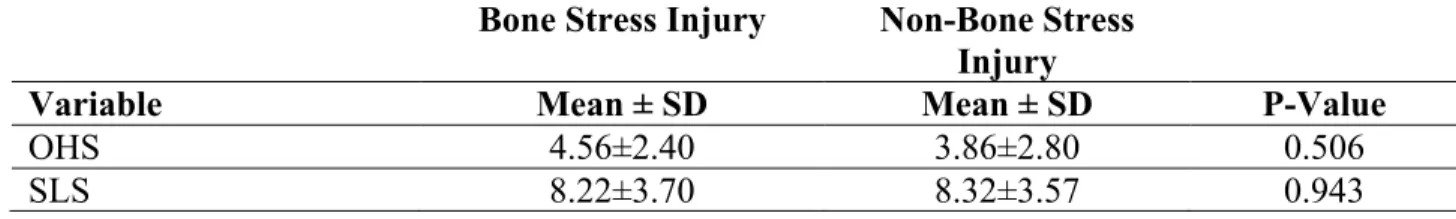
Table 6. Total errors during overhead and single leg squats. Presented as mean ± standard deviation.
Bone Stress Injury Non-Bone Stress Injury
Variable Mean ± SD Mean ± SD P-Value
OHS 4.56±2.40 3.86±2.80 0.506
SLS 8.22±3.70 8.32±3.57 0.943
Table 7. Overhead squat specific errors. Presented as number and percentage of individuals displaying a specific error between bone stress injury and non-bone stress injury groups.
Variable Bone Stress
Injury Non-Bone Stress Injury Total P-Value
Foot turns out 5 (55.6%) 13 (46.4%) 18 (48.6%) 0.634
Foot flattens 2 (22.2%) 9 (32.1%) 11 (29.7%) 0.571
Knee valgus 2 (22.2%) 6 (21.4%) 8 (21.6%) 0.960
Knee varus 4 (44.4%) 5 (17.9%) 9 (24.3%) 0.106
Forward lean 6 (66.7%) 16 (57.1%) 22 (59.4%) 0.613
Low back arching 2 (22.2%) 5 (17.9%) 7 (8.1%) 0.771
Low back rounding 1 (11.1%) 3 (10.7%) 4 (10.8%) 0.973
Arms fall forward 5 (55.6%) 9 (32.1%) 14 (37.8%) 0.208
Heel lift 1 (11.1%) 0 (0%) 1 (2.7%) 0.074
Weight shift 7 (77.8%) 19 (67.9%) 26 (70.3%) 0.571
Table 8. Single leg squat specific errors. Presented as number and percentage of individuals displaying a specific error between bone stress injury and non-bone stress injury groups.
Variable Bone Stress
Injury
Non-Bone Stress Injury
Total P-Value
Foot flattens 6 (66.7%) 21 (75%) 27 (73.0%) 0.624
Knee valgus 7 (77.8%) 21 (75%) 28 (75.7%) 0.866
Knee varus 0 (0%) 1 (3.6%) 1 (2.7%) 0.565
Trunk hip shift 9 (100%) 27 (96.4%) 36 (97.3%) 0.565
Loss of balance 7 (77.8%) 15 (53.6%) 22 (59.5%) 0.198
Knee flexion <60o 1 (11.1%) 2 (7.1%) 3 (8.1%) 0.704
Low back rounding 0 (0%) 1 (3.6%) 1 (2.7%) 0.565
Trunk flexion rotation 5 (55.6%) 21 (75%) 26 (70.3%) 0.267
CHAPTER V DISCUSSION
Nearly 1 in 4 collegiate cross-country athletes sustained a bone stress injury in the present study. Females were more likely to sustain a bone stress injury than males. Pre-season body composition data differed between the bone stress injury and non-bone stress injury groups. Low BMI, low mass, and low lean mass were indicators of bone stress injury development. Leg lean mass in the injured leg was significantly lower when compared to the average mass of the lower extremities of the uninjured group. Surprisingly, lower extremity movement quality did not differ between bone stress injury and non-bone stress injury groups. Thus these findings suggest it may be more important to assess body composition than movement quality when attempting to
identify individuals with high potential for developing a bone stress injury.
bones that are less resistant to bending and thus less resistant to injury,108 higher spongy bone volumetric density that produces more rigid bones,109 inadequate dairy and calcium intake,25 and menstrual irregularities107,110 that may be indicative of an energy imbalance.25 Diet was not tracked for the participants in this study, but female distance runners who do not have adequate caloric intakes are more prone to energy imbalances that lead to oligomenorrhea and
amenorrhea, characteristics that are associated with increased potential for developing a bone stress injury.105,107,110-112
Cross-country athletes that sustained a lower extremity bone stress injury had a lower BMI when equal variances were assumed and not assumed. BMI is an indirect measure of body size, correlated with DEXA scan results.113 It is an indicator of height in relation to weight, but may be inaccurate as it does not discriminate between fat distribution or muscle mass at the same mass.113 Low BMI has been hypothesized to be indicative of an individual who lacks the
indicator of individuals that are likely to sustain a stress fracture injury when used in conjunction with more sensitive measures of body composition (e.g. DEXA data).
This study utilized DEXA data to examine differences between individuals who went on to sustain a bone stress injury and those who did not. DEXA data provided us with the
granularity to examine differences in percent fat, percent lean mass, and bone mineral content.23 Furthermore, with the DEXA data we were able to divide the body into compartments so that the aforementioned variables could be analyzed within body regions of interests, specifically, the lower extremities.23
The bone stress injury group had a smaller lean mass than the non-bone stress injury group when equal variances were not assumed. Lean mass refers to the aspects of a runner’s body that are used as shock absorbers to offset the excessive ground reaction forces.35 It is possible that the bone stress injury group had lower extremity muscles that were fatigued, weak, or tight, which would have lessened their ability to attenuate the ground reaction forces,35 placing more stress on bones and increasing the likelihood of bone stress injury development. It is also possible that these individuals did not have adequate lean mass to act protectively against excessive ground reaction forces traveling up the kinetic chain.
In our study, fat mass and percent fat were not indicators of bone stress injury
excess fat mass. This is especially likely because elite runners are known to have more of their weight as lean tissue as opposed to fat.75 Thus, the potential exists that fat mass and percent fat were not indicative of this injury development because they were not found in excess and thus did not act detrimentally in our runners.
Low bone mineral density was not an indicator of the development of bone stress
injuries. Low bone mineral density reduces the strength of the bone, thus making the bone more susceptible to the accumulation of excess micro damage and stress reaction and stress fracture development.115 Relationships exist between low bone mineral density and stress fracture development in female athletes.105,111 However, studies involving only males,105,116,117 or both males and females,21 have not found clear relationships between bone mineral density and stress fracture injuries. Running is a repetitive activity that results in bone damage that is typically below the injury threshold. If the bone is given the proper time and nutrients to heal, the strength of the bone will increase.35 Stronger bones require a greater amount of accumulated damage or a larger single load to overload an elite runner’s bone to create a bone stress injury.9
The mass of the injured leg was significantly smaller than the averaged mass of the lower limbs of the uninjured group when accounting for both equal variances assumed and equal variances not assumed. This relationship held true when the injured leg lean mass was
reaction forces traveling up the kinetic chain,35 which made them more susceptible to a bone stress injury. Females who sustain stress fractures have less lean mass in the lower limb as compared to the non-stress fracture group.105 No differences in bone mineral density were observed in this study, thus it is indicative that individuals in the bone stress injury group did not have adequate muscle mass to act protectively against stress fractures.
Overhead and single leg squat movement quality did not differ between groups. Neither the overall numbers of errors nor any specific movement errors differed between individuals who sustained a bone stress injury and those who did not. The overhead squat was chosen for its ability to analyze body alignment79 and therefore qualitatively assess movement patterns that may contribute lower extremity injury.89 The single leg squat was chosen as it is a reliable and valid clinical assessment tool84 for identifying flawed lower extremity movement patterns.19 Furthermore, as a runner spends 40% of time in the stance phase of movement – with only one foot contacting the ground – the single leg squat is a good representation of the athlete’s movement patterns as it also shows the runner’s biomechanics during an action with only one foot contacting the ground.88 However, the overhead and single leg squats may not have been dynamic enough to fully load the joints comparably to ground reaction forces observed during the course of a run. Previous work looking at military cadets identified biomechanical
identifying biomechanical errors visually was not a sensitive enough method for identifying differences in movement quality. Additionally, the jump-landing assessment is a more dynamic and demanding task than either the overhead squat or single leg squat, and thus movement errors may be been more pronounced during the jump-landing.118
Furthermore our study population only included elite level runners, and it is possible that they have adapted to their aberrant biomechanical patterns and these aberrant biomechanics are not detrimental to the health of the athlete. The specific errors observed during the overhead and single leg squats are biomechanical patterns that have the potential to contribute to bone stress injuries. However, it is typically not any one particular factor but a complex interaction of various intrinsic and extrinsic predisposing factors that produce a bone stress injury.9 Therefore, it may be challenging to isolate any one particular specific movement flaw as increasing the likelihood of sustaining a bone stress injury.
This study had several limitations. The data gathered included both lower extremity stress reactions and lower extremity stress fractures. Although the injuries are similar, hard to
differentiate, and the stress fracture is a stress reaction not recognized early enough or left
untreated, this may limit the generalizability of the study’s findings. Additionally, this may make it challenging to compare the findings of this study to other similar ones. Lower extremity injury data was gathered prospectively via medical records provided by the team’s physicians and athletic trainers. Thus, the study relied on information provided by external individuals.
Females were the most injured group of athletes in this study, with 7 out of 17 injured as compared to 2 out of 20 males that were injured. Thus, it is likely that the findings of this study are more indicative of female body composition patterns and female biomechanical patterns.
Based on the results and implications of this study, there are several suggested directions for future research. Firstly, the methods of this study should be replicated with novice runners as they may have a greater chance of sustaining a bone stress injury .120 This will allow the findings of the present study to be more generalizable to the general athletic population. Another
REFERENCES
1. Tan SS, van Linschoten RL, van Middelkoop M, Koes BW, Bierma-Zeinstra SM, Koopmanschap MA. Cost-utility of exercise therapy in adolescents and young adults suffering from the patellofemoral pain syndrome. Scandinavian journal of medicine & science in sports. 2010;20(4):568-579.
2. Chan CS, Grossman HY. Psychological effects of running loss on consistent runners.
Percept Mot Skills. 1988;66(3):875-883.
3. Tong KB, Furia J. Economic burden of plantar fasciitis treatment in the United States.
Am J Orthop (Belle Mead NJ). 2010;39(5):227-231. 4. Brody DM. Running injuries. Clin Symp. 1980;32(4):1-36.
5. Kluitenberg B, van Middelkoop M, Diercks R, van der Worp H. What are the Differences in Injury Proportions Between Different Populations of Runners? A Systematic Review and Meta-Analysis. Sports medicine. 2015.
6. Johnson R. Common running injuries of the leg and foot. Minn Med. 1983;66(7):441-444.
7. Macintyre JG, Taunton JE, Clement DB, Lloyd-Smith DR, McKenzie DC, Morrell RW. Running Injuries: A Clinical Study of 4,173 Cases. Clinical Journal of Sports Medicine.
1991;1(2):81-87.
8. Taunton JE, Ryan MB, Clement DB, McKenzie DC, Lloyd-Smith DR, Zumbo BD. A retrospective case-control analysis of 2002 running injuries. Br J Sports Med.
2002;36(2):95-101.
9. Bennell K, Matheson G, Meeuwisse W, Brukner P. Risk factors for stress fractures.
Sports medicine. 1999;28(2):91-122.
10. Stanitski CL, McMaster JH, Scranton PE. On the nature of stress fractures. Am J Sports Med. 1978;6(6):391-396.
11. Archibald HC, Tuddenham RD. Persistent Stress Reaction after Combat: A 20-Year Follow-Up. Arch Gen Psychiatry. 1965;12:475-481.
12. Johnson AW, Weiss CB, Jr., Wheeler DL. Stress fractures of the femoral shaft in athletes--more common than expected. A new clinical test. Am J Sports Med.
13. Hulkko A, Orava S. Stress fractures in athletes. Int J Sports Med. 1987;8(3):221-226. 14. Daffner R, Martinez S, Gehweiler J. Stress Fractures in Runners. Journal of American
Medical Association. 1982;247(7):1039-1041.
15. Scully TJ, Besterman G. Stress fracture--a preventable training injury. Mil Med.
1982;147(4):285-287.
16. Frisch A, Urhausen A, Seil R, Croisier J, Windal T, Theisen D. Association between preseason functional tests and injuries in youth football: a prospective follow-up.
Scandinavian journal of medicine & science in sports. 2011;21(6):e468-e476.
17. McKeag DB. Preseason physical examination for the prevention of sports injuries. Sports medicine. 1985;2(6):413-431.
18. Livengood AL, DiMattia MA, Uhl TL. "Dynamic Trendelenburg": Single-Leg-Squat for Gluteus Medius Strength. Clinical Evaluation and Testing. 2004;9(1):24-25.
19. Mauntel TC, Frank BS, Begalle RL, Blackburn JT, Padua DA. Kinematic differences between those with and without medial knee displacement during a single-leg squat. J Appl Biomech. 2014;30(6):707-712.
20. Stiffler MR, Pennuto AP, Smith MD, Olson ME, Bell DR. Range of motion, postural alignment, and LESS score differences of those with and without excessive medial knee displacement. Clin J Sport Med. 2015;25(1):61-66.
21. Roelofs EJ, Smith-Ryan AE, Melvin MN, Wingfield HL, Trexler ET, Walker N. Muscle size, quality, and body composition: characteristics of division I cross-country runners. J Strength Cond Res. 2015;29(2):290-296.
22. Bosaeus I, Johannsson G, Rosen T, et al. Comparison of methods to estimate body fat in growth hormone deficient adults. Clin Endocrinol (Oxf). 1996;44(4):395-402.
23. Bachrach LK. Dual energy X-ray absorptiometry (DEXA) measurements of bone density and body composition: promise and pitfalls. J Pediatr Endocrinol Metab. 2000;13 Suppl 2:983-988.
24. Knobloch K, Yoon U, Vogt PM. Acute and overuse injuries correlated to hours of training in master running athletes. Foot Ankle Int. 2008;29(7):671-676.
26. Marti B, Knobloch M, Tschopp A, Jucker A, Howald H. Is excessive running predictive of degenerative hip disease? Controlled study of former elite athletes. BMJ.
1989;299(6691):91-93.
27. Dyck PJ, Classen SM, Stevens JC, O'Brien PC. Assessment of nerve damage in the feet of long-distance runners. Mayo Clin Proc. 1987;62(7):568-572.
28. Marti B, Vader JP, Minder CE, Abelin T. On the epidemiology of running injuries. The 1984 Bern Grand-Prix study. Am J Sports Med. 1988;16(3):285-294.
29. Macera CA, Pate RR, Powell KE, Jackson KL, Kendrick JS, Craven TE. Predicting lower-extremity injuries among habitual runners. Arch Intern Med. 1989;149(11):2565-2568.
30. Hreljac A, Marshall RN, Hume PA. Evaluation of lower extremity overuse injury potential in runners. Med Sci Sports Exerc. 2000;32(9):1635-1641.
31. van der Worp MP, Ten Haaf DS, van Cingel R, de Wijer A, Nijhuis-van der Sanden MW, Staal JB. Injuries in runners; a systematic review on risk factors and sex differences.
PLoS One. 2015;10(2):e0114937.
32. Rolf C. Overuse injuries of the lower extremity in runners. Scandinavian journal of medicine & science in sports. 1995;5(4):181-190.
33. Hreljac A. Medicine and Science in Sports and Exercise: Impact and Overuse Injuries in Runners. American College of Sports Medicine. 2004;36(5):845-849.
34. Kulmala JP, Avela J, Pasanen K, Parkkari J. Forefoot Strikers Exhibit Lower Running-Induced Knee Loading than Rearfoot Strikers. Medicine and Science in Sports and Exercise. 2013;45(12):2306-2313.
35. Warden SJ, Burr DB, Brukner PD. Stress fractures: pathophysiology, epidemiology, and risk factors. Curr Osteoporos Rep. 2006;4(3):103-109.
36. Hughes LY. Biomechanical analysis of the foot and ankle for predisposition to developing stress fractures. J Orthop Sports Phys Ther. 1985;7(3):96-101.
37. Detmer DE. Chronic shin splints. Classification and management of medial tibial stress syndrome. Sports medicine. 1986;3(6):436-446.
38. Kaufman KR, Brodine SK, Shaffer RA, Johnson CW, Cullison TR. The effect of foot structure and range of motion on musculoskeletal overuse injuries. Am J Sports Med.
39. Neely FG. Biomechanical risk factors for exercise-related lower limb injuries. Sports medicine. 1998;26(6):395-413.
40. Kindred J, Trubey C, Simons SM. Foot injuries in runners. Curr Sports Med Rep.
2011;10(5):249-254.
41. James SL. Biomechanical and neuromuscular aspects of running. Exerc Sport Sci Rev.
1973;1:189-216.
42. Gallo RA, Plakke M, Silvis ML. Common leg injuries of long-distance runners: anatomical and biomechanical approach. Sports Health. 2012;4(6):485-495.
43. Davis I, Milner C, Hamill J. Does increased loading during running lead to tibial stress fractures? A prospective study. Med Sci Sports Exerc. 2004;36(5):S58.
44. Clansey AC, Hanlon M, Wallace ES, Lake MJ. Effects of fatigue on running mechanics associated with tibial stress fracture risk. Med Sci Sports Exerc. 2012;44(10):1917-1923. 45. Willems TM, De Clercq D, Delbaere K, Vanderstraeten G, De Cock A, Witvrouw E. A
prospective study of gait related risk factors for exercise-related lower leg pain. Gait Posture. 2006;23(1):91-98.
46. Finestone A, Shlamkovitch N, Eldad A, et al. Risk factors for stress fractures among Israeli infantry recruits. Mil Med. 1991;156(10):528-530.
47. Piva SR, Goodnite EA, Childs JD. Strength around the hip and flexibility of soft tissues in individuals with and without patellofemoral pain syndrome. J Orthop Sports Phys Ther. 2005;35(12):793-801.
48. Noehren B, Hamill J, Davis IS. Prospective evidence for a hip etiology in patellofemoral pain. Med Sci Sports Exerc. 2013;45(6):1120-1124.
49. Messier S, Davis S, Curl W, Lowery R, Pack R. Etiologic factors associated with patellofemoral pain in runners. Medicine and Science in Sport and Exercise.
1991;23(9):1008-1015.
50. Vannatta NC, Kernozek TW. Patellofemoral Joint Stress During Running with
Alterations in Foot Strike Pattern. Medicine and Science in Sports and Exercise. 2014. 51. Lieberman DE, Venkadesan M, Werbel WA, et al. Foot strike patterns and collision
52. Gellman R, Burns S. Walking Aches and Running Pains: Injuries of the Foot and Ankle.
Orthopedics. 1996;23(2):263-279.
53. Messier S, Pittala K. Etiologic factors associated with selected running injuries. Medicine and Science in Sport and Exercise. 1988;20(5):501-505.
54. B. K, C. G, T. C. Functional biomechanical deficits in running athletes with plantar fasciitis. American Journal of Sports Medicine. 1991;19(1):66-71.
55. Novacheck TF. The biomechanics of running. Gait Posture. 1998;7(1):77-95.
56. Haglund-Akerlind Y, Eriksson E. Range of motion, muscle torque and training habits in runners with and without Achilles tendon problems. Knee Surg Sports Traumatol Arthrosc. 1993;1(3-4):195-199.
57. Kvist M. Achilles Tendon Injuries in Athletes. Annales Chirurgiae et. Gynaecolagiae.
1991;18(3):188-200.
58. Kent M. The Oxford Dictionary of Sports Science & Medicine The Oxford Dictionary of Sports Science & Medicine. 3 ed: Oxford University Press; 2006.
59. Schulthies SS, Francis RS, Fisher AG, Van de Graaff KM. Does the Q angle reflect the force on the patella in the frontal plane? Phys Ther. 1995;75(1):24-30.
60. Lutter L. Foot-related Knee Problems in the Long Distance Runner. Foot & Ankle International. 1980;1(2):112-116.
61. Mauntel TC, Begalle RL, Cram TR, et al. The effects of lower extremity muscle
activation and passive range of motion on single leg squat performance. J Strength Cond Res. 2013;27(7):1813-1823.
62. Hreljac A. Etiology, prevention, and early intervention of overuse injuries in runners: a biomechanical perspective. Physical medicine and rehabilitation clinics of North America. 2005;16(3):651-667, vi.
63. Nigg BM. The role of impact forces and foot pronation: a new paradigm. Clin J Sport Med. 2001;11(1):2-9.
64. Milner CE, Ferber R, Pollard CD, Hamill J, Davis IS. Biomechanical factors associated with tibial stress fracture in female runners. Med Sci Sports Exerc. 2006;38(2):323-328. 65. Dixon SJ, Collop AC, Batt ME. Surface effects on ground reaction forces and lower
66. Nigg BM. Biomechanics of running shoes. Champaign, Ill.: Human Kinetics Publishers; 1986.
67. Reynolds KL, Heckel HA, Witt CE, et al. Cigarette smoking, physical fitness, and injuries in infantry soldiers. Am J Prev Med. 1994;10(3):145-150.
68. Jones BH, Bovee MW, Harris JM, 3rd, Cowan DN. Intrinsic risk factors for exercise-related injuries among male and female army trainees. Am J Sports Med. 1993;21(5):705-710.
69. Dahlstrom S, Kujala UM. Anthropometry and knee exertion injuries incurred in a physical training program. J Sports Med Phys Fitness. 1990;30(2):190-193.
70. Haarbo J, Gotfredsen A, Hassager C, Christiansen C. Validation of body composition by dual energy X-ray absorptiometry (DEXA). Clin Physiol. 1991;11(4):331-341.
71. Carter DR, Hayes WC, Schurman DJ. Fatigue life of compact bone--II. Effects of microstructure and density. J Biomech. 1976;9(4):211-218.
72. Kemmler W, Engelke K, Baumann H, et al. Bone status in elite male runners. Eur J Appl Physiol. 2006;96(1):78-85.
73. Fredericson M, Chew K, Ngo J, Cleek T, Kiratli J, Cobb K. Regional bone mineral
density in male athletes: a comparison of soccer players, runners and controls. Br J Sports Med. 2007;41(10):664-668; discussion 668.
74. Eston R, Reilly T. Kinanthropometry and Exercise Physiology Laboratory Manual: Tests, Procedures, and Data. Vol 1. 3 ed2009.
75. Bale P, Bradbury D, Colley E. Anthropometric and training variables related to 10km running performance. Br J Sports Med. 1986;20(4):170-173.
76. Arrese AL, Ostariz ES. Skinfold thicknesses associated with distance running performance in highly trained runners. J Sports Sci. 2006;24(1):69-76.
77. Neely FG. Intrinsic risk factors for exercise-related lower limb injuries. Sports medicine.
1998;26(4):253-263.