OCCUPATIONAL MOBILITY, GENDER AND CLASS IN THE UNITED STATES, 1965-2015
Jessica Anne Pearlman
A dissertation submitted to the faculty at University of North Carolina at Chapel Hill in partial fulfillment of the requirements for the degree of Doctor of Philosophy in the Department of
Sociology in the College of Arts and Sciences.
Chapel Hill 2016
Approved by: Arne Kalleberg
Philip Cohen
Guang Guo
Ted Mouw
ii © 2016
iii ABSTRACT
Jessica Anne Pearlman: Occupational Mobility, Gender and Class in the United States, 1965-2015
(Under the direction of Arne Kalleberg)
This dissertation consists of three papers. The first paper examines the impact of inter-firm mobility on wage trajectories of three birth cohorts of young male workers, focusing on how the relationship between mobility and wages has changed form 1965-2013. A key element of this analysis is exploring how occupational mobility might moderate the impact of inter-firm
mobility on wages. A second element of this analysis examines how educational attainment moderates the impact of inter-firm mobility on wages and how this may have changed over time, concurrent with rising wage returns to education. The second paper also examines the
relationship between inter-firm mobility and wages and the extent to which occupational mobility and educational attainment might moderate this impact. The second paper takes a life course perspective, examining a single cohort of men and women from ages 18-55, over the years 1979-2012. This paper explores the extent to which the relationships between inter-firm mobility, occupational mobility, education and wages vary over the life course, as a function of the duration of time since the mobility event and between men and women. This paper also explores the extent to which gender differences are due to the behavior and treatment of
iv
v
vi
ACKNOWLEDGEMENTS
This dissertation could not have been completed without the guidance and support of many people. Much gratitude to my adviser, Arne Kalleberg, who had the uncanny ability to help me to transform my complicated set of research interests into a coherent dissertation topic and set of research questions and whose vast knowledge of and own incredibly comprehensive and creative theoretical framework for understanding the changes in the United States labor market over the past 50 years informs each piece of this dissertation. Many thanks also to my
dissertation committee: Ted Mouw, whose boundless knowledge of both statistical methods and the literature on labor market stratification was enormously helpful, provided guidance that was instrumental in developing and operationalizing a theoretical framework for occupational mobility for this dissertation. Ted’s own work also serves as an example for me of research of the highest levels of rigor and quality. Philip Cohen’s expertise and ideas were invaluable in guiding the development of the framework for gender inequality in the labor market used in this dissertation; his careful treatment of the concept of occupational mobility also helped me to operationalize this concept in a much fuller way. In addition, Philip’s own research modeled for me incredibly creative ways to use and interpret quantitative methods to illustrate theoretical concepts. I have learned a tremendous amount from Lisa Pearce about the distinguishing
vii
my interest in Nepal. It would have been impossible for me to use the methods applied in this dissertation without Guang Guo’s expertise and research contributions on event history models; he also helped me several times to recognize my own methodological assumptions to develop a more comprehensive tool kit.
Needless to say, this research could not have been conducted without the respondents of the four waves of the NLS surveys, who generously gave their time to answer the survey questions year after year. Many thanks also to the staff of the NLS Surveys who created the surveys, interviewed respondents, and transformed the data into a very user-friendly format. Special thanks to Steve McClaskie of NLS User Services for patiently answering numerous questions.
Thanks to Jan Hendrickson-Smith, Cathy Zimmer, Chris Wiesen, Howard Aldrich, Ken Bollen, David Guilkey, Tom Mroz, Jennie Brand, Matt Huffman, Dirgha Ghimire, Prem Bhandari, and the entire staffs of the UNC Departments of Sociology and Statistics, the Odum Institute, the Carolina Population Center, and ISER at the University of Michigan and in the Chitwan Valley, Nepal.
viii
ix
TABLE OF CONTENTS
LIST OF TABLES………xiii
LIST OF FIGURES………..…….xiv
CHAPTER 1: INTRODUCTION TO DISSERTATION……….…1
Background Context……….……1
Paper 1: Should I Stay or Should I Go? The Impact of Firm Changes, Occupational Mobility and Education on Earnings, 1965-2015……….…2
Paper 2: Should She Go or Should He? Gender Differences in the Impact of Firm Changes, Occupational Mobility and Education on Earnings across the Life Course, 1965-2015………3
Paper 3: Has the Revolving Door Shut?: Women’s Occupational Mobility and Occupational Segregation, 1965-2015……….5
Overall Themes Linking the Three Papers………..………..7
Occupation Specific Human Capital.………...7
Lack of Benefits from Job Mobility among Less Well Educated Workers………...8
Occupational Segregation among Highly Educated Women………....9
CHAPTER 2: SHOULD I STAY OR SHOULD I GO? THE IMPACT OF FIRM CHANGES, OCCUPATIONAL MOBILITY AND EDUCATION ON EARNINGS, 1965-2015………10
Introduction………..1
Literature Review………...…12
Inter-Firm Mobility: Theory………...…12
Inter-Firm Mobility: Results………..14
Inter-Firm Mobility: Changes over Time………...…16
x
Occupational Mobility: Results……….……….19
Summary on Inter-Firm and Occupational Mobility………..23
Research Questions………....24
Data and Methods………..….24
Sample………....24
Variables………....27
Analysis Techniques………..34
Results………38
Descriptive Statistics………..38
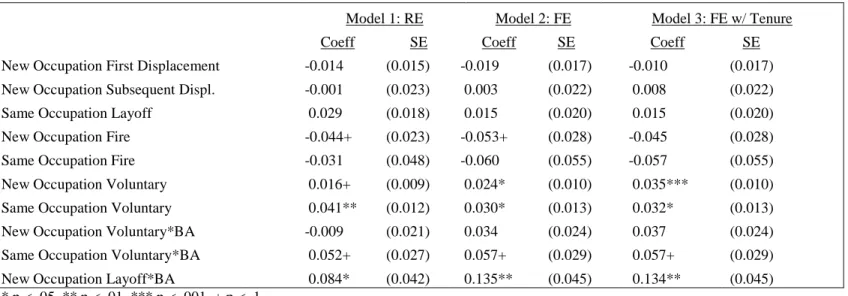
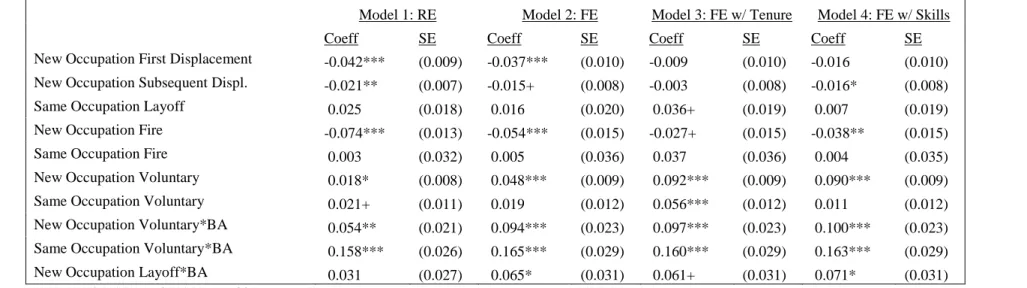
Regression Results……….39
Involuntary Job Loss………..40
Voluntary Inter-Firm Mobility………...41
Summary of Key Findings………..44
Discussion and Conclusion………....45
CHAPTER 3: SHOULD SHE GO OR SHOULD HE? GENDER DIFFERENCES IN THE IMPACT OF FIRM CHANGES, OCCUPATIONAL MOBILITY AND EDUCATION ON EARNINGS ACROSS THE LIFE COURSE, 1965-2015………..61
Introduction………....61
Literature Review………...…62
Inter-Firm Mobility: Age at which the Mobility Occurs……….62
Inter-Firm Mobility and Wages: Duration of Time since the Mobility Event…….64
Voluntary Inter-Firm Mobility: Gender Differences: Theory……….65
Involuntary Inter-Firm Mobility: Gender Differences: Theory………..70
xi
Summary on Inter-Firm and Occupational Mobility by Gender,
Age and Time Since Mobility………72
Research Questions………....73
Data and Methods………...…73
Sample………73
Variables………74
Analysis Technique………...78
Results………....83
Descriptive Statistics………..83
Regression Results……….84
Involuntary Job Loss………..…84
Voluntary Inter-Firm Mobility: Age and Duration Since Mobility……….…86
Voluntary Inter-Firm Mobility: Gender Differences………..89
Summary of Key Findings………..92
Discussion and Conclusion………92
CHAPTER 4: HAS THE REVOLVING DOOR SHUT?: WOMEN’S OCCUPATIONAL MOBILITY AND OCCUPATIONAL SEGREGATION,1965-2015………..111
Introduction……….…….111
Literature Review……….113
Occupational Segregation by Gender………...…113
Revolving Door Theory………114
Applications of the Revolving Door Theory……….115
Summary of Mobility between Male and Female Dominated Occupations………..120
xii
Data and Methods……….121
Sample………..…121
Variables………..…122
Analysis Technique………..125
Modeling Strategies……….129
Additional Modeling Issues………..…131
Results………..136
Descriptive Statistics………137
Regression Results: Six Category Outcome……….…139
Regression Results: Four Category Outcome………...141
Summary of Key Findings………150
Discussion and Conclusion………..150
Addendum to Chapter 3: Random Effects Models………...153
APPENDIX: ADDITIONAL FIGURES FOR CHAPTER 4………...179
xiii
LIST OF TABLES
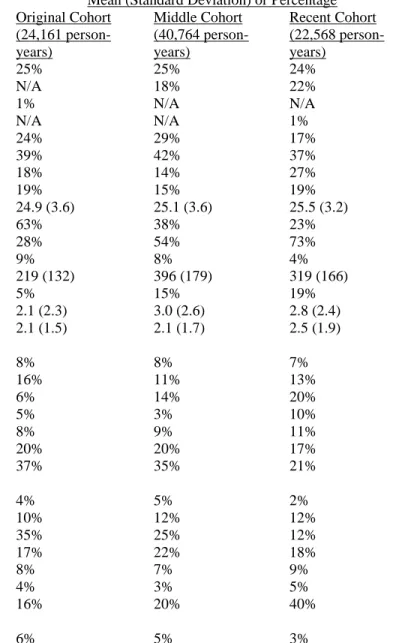
Table 2.1 – Descriptive Statistics………....50
Table 2.2 – Regression Models: Original Cohort………..…..51
Table 2.3 – Regression Models: Middle Cohort………...52
Table 2.4 – Regression Models: Recent Cohort………..…....53
Table 2.5 – Impact on Wages and Log Wages………..…..54
Table 3.1 – Prevalence of Inter-Firm Mobility Using One and Two Year Intervals …………...96
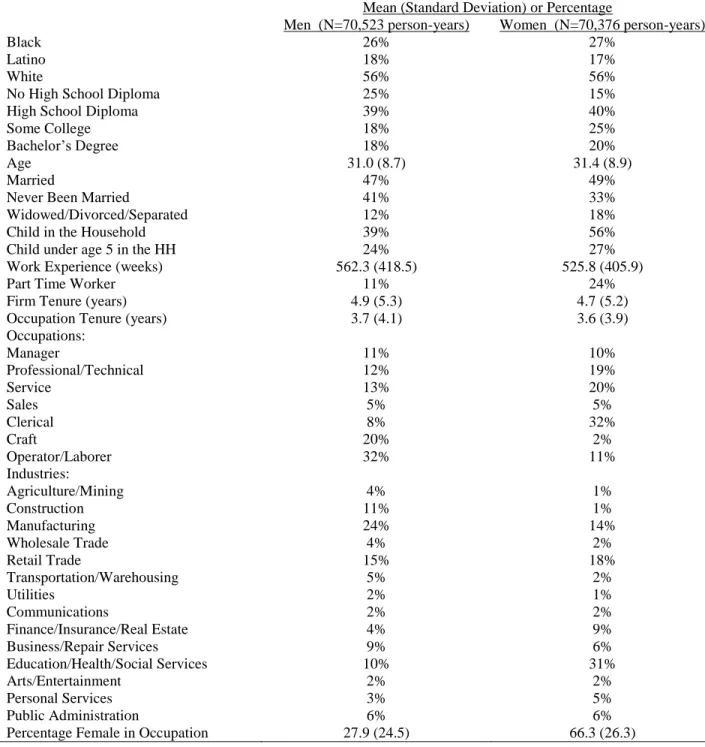
Table 3.2 – Descriptive Statistics………...….99
Table 3.3 – Regression Models……….…100
Table 3.4 – Regression Models with Tenure Controls………...101
Table 3.5 – Regression Models with Occupation Fraction Female………...102
Table 4.1 – Matched Pairs of Two Year Intervals………...156
Table 4.2 – Descriptive Statistics………..…160
Table 4.3 – Change in Fraction Female………....161
Table 4.4 – Occupational Transitions, Originated Male Dominated Occupation………..163
Table 4.5 – Occupational Transitions, Originated Integrated Occupation………..…..164
Table 4.6 – Occupational Transitions, Originated Female Dominated Occupation…………...165
Table 4.7 – Occupational Transitions, Originated Male Dominated Occupation, RE………...175
Table 4.8 – Occupational Transitions, Originated Integrated Occupation, RE………...176
Table 4.9 – Occupational Transitions, Originated Female Dominated Occupation, RE………...177
xiv
LIST OF FIGURES
Figure 2.1 – Conceptual Framework………..48 Figure 2.2 – Percentage of Respondents with at least One Experience of Firm
Mobility by Type………49 Figure 2.3 – Impact of Involuntary Mobility on Log Wages ………..55 Figure 2.4 – Impact of Involuntary Job Loss on Log Wages: Total Effect and
Net of Tenure...56 Figure 2.5 – Impact of Voluntary Firm Mobility on Log Wages……….…57 Figure 2.6 – Impact of Voluntary Firm Mobility on Log Wages: Total Effect and
Net of Tenure...58 Figure 2.7 – Impact of Voluntary Occupation Change for Individuals without a BA…………...59 Figure 2.8 – Occupation Skill Differences and the Impact of Occupational Mobility……….60 Figure 3.1 – Conceptual Framework………..95 Figure 3.2 – Percentage of Respondents with at least One Involuntary Mobility
Event by Type...97 Figure 3.3 – Percentage of Respondents with at least One Voluntary Mobility
Event by Type………98 Figure 3.4 – Impact of Displacement on Wages in the Year of Displacement………...…104 Figure 3.5 – Impact of Displacement w/ New Occupation on Wages in Year
of Displacement………...105 Figure 3.6 – Impact of Voluntary Inter-Firm Mobility on Wages for Individuals
without a BA...106 Figure 3.7 – Impact of Voluntary Inter-Firm Mobility for Individuals without a
BA: Model 2...107 Figure 3.8 – Impact of Voluntary Mobility on Log Wages for Individuals with a BA…………..108 Figure 3.9 – Impact of Voluntary Firm Mobility on Wages: Gender Differences……….109 Figure 3.10 – Impact of Voluntary Firm Mobility for Individuals with a BA:
xv
Figure 4.1 – Mean and Median Percentage Female in Women's Occupations………..157
Figure 4.2 – Percent of Women in Occupation Categories over Time………..158
Figure 4.3 – Percent of Labor Force in Occupation Categories over Time………159
Figure 4.4 – Probability of Occupational Transitions by Year and Model………162
Figure 4.5 – Probability of Occupational Transitions by Year and Occupation Gender Representation Category of Origin, Net of Age………..166
Figure 4.6 – Probability of Occupational Transitions by Year and Occupation Gender Representation Category of Origin, Net of National Occupational Distribution and Age………..…..167
Figure 4.7 – Probability of Occupational Transitions by Year and Model, Originated Male Dominated Occupation.………..168
Figure 4.8 – Probability of Occupational Transitions by Year and Model, Originated Integrated Occupation………..169
Figure 4.9 – Probability of Occupational Transitions by Year and Model, Originated Female Dominated Occupation………....170
Figure 4.10 – Probabilities of Occupational Transitions by Year and Education Level (Model 4): Originated Male Dominated Occupation………....171
Figure 4.11 – Probabilities of Occupational Transitions by Year and Education Level (Model 4): Originated Integrated Occupation………..….172
Figure 4.12 – Probabilities of Occupational Transitions by Year and Education Level (Model 4): Originated Female Dominated Occupation………...….173
Figure 4.13 – Impact of Unemployment Rate on Probability of Occupation Transitions (Model 4 Coefficients)………...………..174
Figure A.1 - Labor Market Characteristics over Time………..………....179
Figure A.2 - Transition Percentages by Year: Originated Male Dominated Occupation……….…..180
Figure A.3 - Transition Percentages by Year: Originated Integrated Occupation ………....181
xvi
Figure A.5 - Transition Percentages by Year………....183
Figure A.6 - Transition Percentages by Age: Early Cohort, Originated Male Dominated Occupation………….……….…...184
Figure A.7 - Transition Percentages by Age: Early Cohort, Originated Integrated Occupation…………...………...185
Figure A.8 - Transition Percentages by Age: Early Cohort, Originated Female Dominated Occupation………...186
Figure A.9 - Transition Percentages by Age: Original Cohort, Originated Male Dominated Occupation……….187
Figure A.10 - Transition Percentages by Age: Original Cohort, Originated Integrated Occupation………...188
Figure A.11 - Transition Percentages by Age: Original Cohort, Originated Female Dominated Occupation……….189
Figure A.12 - Transition Percentages by Age: Middle Cohort, Originated Male Dominated Occupation……….190
Figure A.13 - Transition Percentages by Age: Middle Cohort, Originated Integrated Occupation………...191
Figure A.14 - Transition Percentages by Age: Middle Cohort, Originated Female Dominated Occupation………....192
Figure A.15 - Transition Percentages by Age: Recent Cohort, Originated Male Dominated Occupation ………..….193
Figure A.16 - Transition Percentages by Age: Recent Cohort, Originated Integrated Occupation………..194
Figure A.17 - Transition Percentages by Age: Recent Cohort. Originated Female Dominated Occupation………....195
Figure A.18 - Transition Percentages by Age: Early Cohort……….196
Figure A.19 - Transition Percentages by Age: Original Cohort………....197
Figure A.20 - Transition Percentage by Age: Middle Cohort………...198
xvii
Figure A.22 - Transition Percentages by Years in Occupation, Originated
Male Dominated Occupation.………..……….200 Figure A.23 - Transition Percentages by Years in Occupation, Originated
Integrated Occupation.……….201 Figure A.24 - Transition Percentages by Years in Occupation, Originated
1
CHAPTER 1: INTRODUCTION TO DISSERTATION
Background Context
In the United States, the past 50 years have seen three transformations in the structure of the labor market. The first of these is an increase in the precarity of work. Over the course of a career, an individual today is likely to work for a greater number of different employers and possibly in a greater number of occupations than 40-50 years ago. While some individuals may switch employers and occupations voluntarily, others do so as a result of layoffs and downsizing implemented by firms in the effort to stay profitable. There also has been an increase in non-standard work such as temporary, contract and part-time work which contributes to the overall precarity of the labor market.
The second transformation in the labor market is the rise in wage inequality. One
defining feature of the increase in wage inequality is the widening wage gap between individuals who have at least a bachelor’s degree and those who do not. A large body of research has
documented this and explored various causes including change in industrial and occupational structure, changes in technology leading to a higher demand for well educated workers and declining demand for less well educated workers, and a decline in union power to name a few.
2
occupations. Finally there has been a narrowing of the gender wage gap although the last couple of decades have seen a leveling off of this trend.
This dissertation explores the aforementioned three trends, as well as the relationships between them through the lens of occupations and occupational mobility, or the process of an individual changing from one occupation to another. Occupations are key element of individual labor market experience; they determine the activities an individual worker engages in in each day and along with education are one of the key predictors of wage outcomes. Thus occupational structure, both the type and distribution of occupations in the labor market as well as the
demographic composition of occupations is a key factor relating to wage inequality by education and gender. Furthermore, any exploration of the relationship between inequality with precarity and mobility must also consider the role of occupational mobility.
Paper 1: Should I Stay or Should I Go? The Impact of Firm Changes, Occupational Mobility and Education on Earnings, 1965-2015
This dissertation consists of three papers. The first paper examines the impact of inter-firm mobility on wage trajectories of three birth cohorts of young male workers (aged 18-31), focusing on how the relationship between mobility and wages has changed form 1965-2013. A key element of this analysis is exploring how occupational mobility might moderate the impact of inter-firm mobility on wages. A second element of this analysis examines how educational attainment moderates the impact of inter-firm mobility on wages and how this may have changed over time, concurrent with rising wage returns to education.
The key findings from this first paper include the following:
3
The negative impact of displacement has increased over time.
For the middle recent cohorts, firm and occupational tenure explain a substantial portion of the loss in wages due to displacement and firing. This is somewhat less true for the recent cohort.
There is a large education differential in the impact of voluntary firm mobility on wages and this has increased over time.
For the middle and recent cohorts, those without a bachelor’s degree do not generally benefit from voluntary firm mobility and there has been minimal change over time.
o They find ‘higher wage quality’ positions, but the loss of firm and/or occupational tenure cancels out the wage benefits.
Individuals without a bachelor’s degree who will voluntarily change firm and occupation tend to be those with worse earning prospects to begin with.
Finding a new occupation with similar skills mitigates the wage loss due to displacement and firing and brings substantial benefits when the inter-firm mobility is voluntary.
The prevailing wisdom in Sociology, based on the seminal work by Bernhardt et al in the late 1990s has been that the impact of mobility on wages has gotten worse over time, particularly for those with less education. This research counters that argument, showing that while the impact of involuntary job loss has worsened over time, the wage benefits of voluntary inter-firm mobility have remained constant for those without a bachelor’s degree and have markedly increases for those with a bachelor’s degree or more.
Paper 2: Should She Go or Should He? Gender Differences in the Impact of Firm Changes, Occupational Mobility and Education on Earnings across the Life Course, 1965-2015
4
relationships between inter-firm mobility, occupational mobility, education and wages vary over the life course, as a function of the duration of time since the mobility event and between men and women. This paper also explores the extent to which gender differences are due to the behavior and treatment of individual women and men as well as opposed to their occupational location in the labor market.
The key findings from the second dissertation paper include the following:
The impact of most types of inter-firm mobility worsen with increasing age at which the mobility occurs: positive wage gains abate and wage losses are larger.
The moderating effect of occupational mobility on the relationship between inter-firm mobility and wages varies depending on the age at which the mobility occurs:
o For individuals without a bachelor’s degree, for mobility events that occur before the age of 30, voluntary inter-firm mobility with an occupation change ultimately brings higher wage returns than voluntary inter-firm mobility while remaining in the same occupation.
o For individuals without a bachelor’s degree, for mobility events that occur after the age of 30, voluntary inter-firm mobility with an occupation change results in a wage loss, while voluntary inter-firm mobility while remaining in the same occupation results in no net wage change.
For individuals without a bachelor’s degree, the wage loss due to voluntary inter-firm mobility with an occupation change that occurs after age 30 is largely due to loss of firm and occupational tenure.
The wage gains for voluntary inter-firm mobility with an occupation change are not fully realized until three years after the inter-firm mobility event.
Men receive a bachelor’s degree premium in the wage returns to voluntary inter-firm mobility. Women do not receive the bachelor’s degree premium for most types of voluntary inter-firm mobility.
The differences between men and women in the bachelor’s degree premium for voluntary inter-firm mobility can be largely explained by occupational segregation.
5
For individuals without a bachelor’s degree, when displacement with a new occupation occurs after age 30, wage losses are worse for men than for women.
The prevailing wisdom in Sociology and Economics is that voluntary inter-firm mobility is associated with wage gains, although significant gains may be restricted to mobility early in the career. Findings from this paper suggest that for less well educated workers, inter-firm mobility after age 30 that also involves an occupation change actually results in workers earning less on average over time than they might have otherwise. This highlights the variation between different types of volunteer inter-firm mobility and the importance of considering concurrent occupation changes as well as education level. A second contribution of this paper is to highlight the importance of occupational segregation in explaining gender differences in the relationship between inter-firm mobility and wages. While the literature suggests that a variety of factors contribute to the gender wage gap in general, differences between men and women in terms of the wage benefits to voluntary inter-firm mobility are almost completely explained by
occupational segregation.
Paper 3: Has the Revolving Door Shut?: Women’s Occupational Mobility and Occupational Segregation,1965-2015
6
mentioned above have changed during that time period as well as the extent to which the
relationship between education level and the probability of specific transitions has changed over time. In addition, the paper explores the relationship between macro-economic conditions and the likelihood of these transitions.
The key findings from the third dissertation paper include the following:
The two-year probability of changing occupations declined markedly for women between 1970-2010.
The largest declines are in the two-year probability of transitioning out of the set of male dominated occupations, to both female dominated occupations as well as integrated occupations (net of changes in relative size of the occupational categories).
o However, in 2010, women are still more likely to transition out of the set of male dominated occupations than out of the set of female dominated occupations. Overall, the two year-probability of transitioning out of female dominated occupations
does not change over time. However, net of changes in relative size of the occupational categories, the two-year probability of transitioning from female dominated to integrated occupations gets substantially smaller over time.
Once changes in relative size of the occupational categories are accounted for, the declines in transition probabilities of exiting male and female dominated occupations are driven primarily by the fact that women are much less likely to change occupations by 2010.
A higher proportion of gender-integrated occupations is associated with more occupational mobility for women both into, out of and within gender integrated occupations.
Whereas the two-year probability of transitioning from male dominated to female dominated occupations declines for women with a high school diploma, it actually increases for women with no high school diploma or a bachelor’s degree.
The changing patterns over time for different educational groups actually result in a convergence across educational groups by 2010 in most two-year transition probabilities. Across years, women with bachelor’s degree consistently have the lowest probability of
7
A higher unemployment rate is associated with a higher probability of women leaving male dominated occupations but does not appear to impact the probability of entering male dominated occupations.
The conventional wisdom in Sociology, based on the seminal work by Jacobs in the early 1980s suggests that there is considerable movement by women between male dominated, female dominated and integrated occupations and that this mobility does not decline with age. The findings from this paper show considerabl e declines in the degree of mobility between male dominated, female dominated and integrated occupations both over the life course of individual women and in across all women over the past 50 years.
Overall Themes Linking the Three Papers
Occupation Specific Human Capital
The first theme that arises from these papers is the importance of occupation specific human capital. Occupation specific human capital refers to the knowledge and skills that
individuals develop over time while working in an occupation that allow them to be successful in that occupation. This knowledge and these skills are particularly helpful for the specific
8
skills. Occupational tenure is associated with a wage premium precisely because of the
occupation specific human capital that long-time workers in an occupation have developed over time.
Lack of Benefits from Job Mobility among Less Well Educated Workers
Asecond theme among the first two papers in this dissertation is that workers without a bachelor’s degree generally do not benefit much from inter-firm mobility. The first paper shows that for mobility that occurs under before age 32, the wage gains are less than 5% and have only scattered statistical significance. The second paper indicates that while there are eventual gains for mobility that occurs before age 30, particularly for those who change occupations, mobility that occurs after age 30 with an occupation change results in these workers eventually having lower wages then they would have had they remained in their original occupation and firm. In addition, findings from the first paper indicate that these workers are individuals who have characteristics that are associated with lower earning prospects overall, regardless of whether experience inter-firm mobility or not.
9
Overall, the findings suggests that it is appropriate to take a closer look at the experience of ‘voluntary’ inter-firm mobility for less well educated workers. What prompts their decisions to move job and/or occupation? Is their variation among this group in terms of their earning prospects following inter-firm mobility and what individual and labor market characteristics might account for these differences.
Occupational Segregation among Highly Educated Women
A final theme from the second and third papers is the somewhat surprising outcomes for highly educated women (those with a bachelor’s degree). Over the past 50 years, most of the decline in occupational segregation has been in positions requiring at least a bachelor’s degree. Thus in a general sense, declines in labor market gender inequality have been stronger among college educated women compared to women who do not have a bachelor’s degree. However, several of the findings from this dissertation suggest that women with a bachelor’s face more gender inequality than less well educated women. Results from the second paper indicate that there are not gender differences in the impact of voluntary inter-firm mobility on wages for men and women without a college degree. The gender gap is restricted to men and women who have at least a bachelor’s degree and is almost completely a function of occupational segregation, in spite of the fact that occupational segregation is lower among college educated men and women.
10
The findings of the second and third paper suggest that further attention should be paid to the characteristics of and factors that lead to continued occupational segregation among college educated women. Are the occupations that remain male dominated particularly unwelcoming to this set of women and if so, why is that the case? What role might college majors and
11
CHAPTER 2: SHOULD I STAY OR SHOULD I GO? THE IMPACT OF FIRM CHANGES, OCCUPATIONAL MOBILITY AND EDUCATION ON EARNINGS, 1965-2015
Introduction
Over the past 40 years, the structure of the United States labor market has fundamentally changed. Whereas relations between companies and employees were once characterized by long term stable relationships, the current relations are more precarious and tenuous. The use of permanent layoffs by firms as a strategy to cut costs and remain profitable has increased and the average time that employees work for a specific firm (firm tenure) has declined. There has also been a rise in contingent labor relations such as part-time, temporary and contract work
(Kalleberg 2011, Farber 2008, Uchitelle 2007). In addition, the past 40 years have seen a rise in wage inequality, in particular the wage gap has widened between those who do and do not have a college degree (Cheesman-Day and Newburger 2002).
12
changes over the past 40 years, there has been surprisingly little attention paid to specifically how the relationship between inter-firm mobility and wages may have changed during this time.
Occupations are key element of individual labor market experience; they determine the activities an individual worker engages in in each day and along with education are one of the key predictors of wage outcomes. Due to the fact that over time individuals develop occupation specific skills, occupational tenure has not surprisingly been found to be a strong predictor of individual wage growth. Clearly a firm switch that is made while retaining the same occupation will be an entirely different experience from a firm change that also involves a change in occupation. It is reasonable to expect that these two types of mobility might have different impacts on the subsequent average wages. However, research on the impact of individual inter-firm mobility on wages has largely ignore the question of how the relationship between mobility and wages might be moderated based on whether or not the individual also changes occupations concurrently with switching firms.
This paper thus focuses on two areas, first how the impact of inter-firm mobility on wages has changed over the past 40 years and second, how this impact is moderated by the presence or absence of simultaneous occupational mobility. I also explore how the
aforementioned patterns vary according to educational attainment. Finally I examine the extent to which the role of occupational mobility varies depending on the transferability of skills between an individuals’ initial and subsequent occupations.
Literature Review
Inter-Firm Mobility: Theory
13
achieve. They will thus only voluntarily accept a position at a new firm if the new position provides them greater utility than their current position. In principle, utility is defined broadly and may include wages, other monetary benefits (e.g. health insurance) and non-monetary benefits such as flexibility of work. In fact, as the primary purpose of work for most individuals is to earn a living, most research on inter-firm mobility is based on the assumption that voluntary decision to change firms result from an individual’s desire to maximize wages. (Longhi and Taylor 2013, Burdett (1978) and Jovanovic (1979). Thus the job search model posits that voluntary inter-firm mobility will result in higher wages. This expectation is mitigated however by what is referred to as the ‘problem of imperfect information’ (Borjas 2005). Individuals who change firms know their starting wage at the new firm, but may be somewhat limited in their ability to project what their wages will be several years in the future relative to they might have earned if they stayed at their former position.
14
Inter-Firm Mobility: Results
National and regional studies on worker displacement, e.g. job loss due to permanent layoffs and plant closures, since the 1970s, have overwhelmingly found job displacement results in wage declines; estimates range from 6-25%, which persist for at least 7 years (Farber 2003, Kletzer and Farlie 2003, Fallick 1996, Jacobson Lalonde and Sullivan 1993, Couch and Placzek 2010) and for as long as 20 years (Von Wachter, Song and Manchester 2009).
In addition, a variety of research that distinguishes between voluntary and involuntary firm separations, based on data from 1966-2002, has shown that involuntary separations, whether being fired, laid off, or working at a plant that subsequently closed, result in lower wages at the following job relative to remaining at the same firm. On the other hand, voluntary separations, e.g. ‘quits’ have a positive impact on subsequent wages. This research includes studies focusing on specific birth cohorts (e.g. groups of individuals who were born during a specified time interval), including cohorts born 1907-20 (Mincer and Jovanovic, 1981; Black 1980), 1942-52 (Antel, 1983; Blau and Kahn, 1981a, 1981b; Bartel and Borjas, 1981), and 1958-65 (Keith and McWilliams 1995, Perticara, 2002; Fuller, 2008). Other than for the earliest cohort mentioned above, who were analyzed in mid-life, cohort based studies have focused on the first 10-20 years of the respondents professional lives. Other research has been based on samples of the entire workforce (e.g. all working ages), including data from the mid-1970s to the early 1990s (Polsky, 1999, Ruhm, 1997, Moore, 1998). While most of the research has focused on men, the studies by Keith and McWilliams (1995), Fuller (2008), Blau and Kahn (1981a, 1981b) also included women1.
15
Individuals with higher education have more resources in the labor market, given that there are a greater set of positions for which they qualify. Therefore we might expect that with increasing educational attainment, the wage gains following voluntary firm switches would be stronger and wage losses following job loss would be ameliorated. It is also possible that since individuals with higher education tend to earn more, they may suffer worse wage losses following displacement in that they ‘have further to fall’. In fact, research on the relationship between educational attainment and the impact of involuntary job loss has not produced
consistent results, with some research suggesting that education provided a protective effect vis a vis wages following job loss and other research indicating the opposite result (Koeber and
Wright 2001, Stevens 1997, Helwig 2001). There is a dearth of research on how voluntary inter-firm mobility might be moderated my educational attainment, which is why I will address this topic in this dissertation paper2.
An issue in the literature discussed above is that firm switches are potentially endogenous. That is, individuals who change firms voluntarily may be workers with
characteristics that would enable them to earn high wages regardless of their firm location; the converse may be true of those experiencing involuntary job loss. While Bartel and Borjas (1981), Antel (1983), Blau and Kahn (1981a, 1981b) and Perticara (2002) use methods to address the endogeneity issue (e.g. Heckman models or fixed effects), the other authors do not. Furthermore the Bartel and Borjas (1981), Antel (1983), and Blau and Kahn (1981a, 1981b) articles all analyze data from 1969-1972. Therefore only one article (Perticara 2002) using data
2 Kronberg (2014) includes models for stratified by educational attainment when examining the impact of
16
from other time periods addresses endogeneity. This is more potentially problematic for the results on voluntary firm separations. For the involuntary separations, many authors restrict the findings to job displacement, which is relatively exogenous vis a vis worker characteristics, or analyze job displacement and firing separately.
Inter-Firm Mobility: Changes over Time
While the literature discussed above includes data from multiple cohorts, little research has been done on the impact of firm mobility for more recent entrants to the labor market: those born 1980 or later, who are often referred to as the millennial cohort. Furthermore, no research that distinguishes between voluntary and involuntary job loss has compared results across birth cohorts. This an important issue to consider because the various cohorts entering the labor market from the 1960s through the present have joined and worked within very different labor markets and under different economic conditions.
Over the past 40 years, the structure of the United States labor market has been
17
of employer-employee relations, the labor market context from 1945-1975 was markedly different than that of the present day for significant proportion of the workforce.
Several macro-economic changes in the 1970s lead to the dismantling of the ‘post-war accord’ between capital and labor. Increased competition from European and Japanese firms and a larger corporate emphasis on accountability to stockholders forced American firms to be much more concerned about the ‘cost’ of labor. At the same time, advances in technology and
communications allowed for the outsourcing of jobs to cheaper labor in overseas factories
(Kalleberg 2010). This combination of forces lead to several changes in the institutional relations of labor market including a rise in contingent work, an increase in layoffs, and a decline in worker tenure as well as the wage returns to tenure. While the post-war accord began to be dismantled 40 years ago, there have also been significant changes in the labor market within this time period. For instance, in the 1980s, most layoffs were in the manufacturing industries since the mid-1990s, displacement has spread to include financial and service industries as well. In addition, the level of labor demand has cycled throughout this time period with unemployment spikes in the early 1980s and in 2008-2010.
18
wages of the more recent cohort were also lower, although the differences were much smaller and did not increase consistently with age. In addition, Beaudry et al (2014) examined wage trajectories for college educated workers aged 25-30 between 1990 and 2010 and found that these became progressively flatter after 2000.
Given the aforementioned changes in the structure of the labor market and earnings trajectories, we might also expect that there would be variation in the impact of firm mobility on wages during this time. However, there has been little attention to this issue. The one seminal work on this topic, by Bernhardt et al (2001), is problematic because the analysis does not
differentiate between involuntary and voluntary job loss3. Bernhardt e al (2001) find that for men with a no more than a high school diploma, the impact of firm mobility on wages are negative for men born 1958-1965, but positive for men born 1942-52. However, these findings may potentially be entirely explained by the fact that a (much) higher percentage of firm mobility for the later cohort resulted from involuntary job losses. For men with at least some college, who are much less likely to suffer involuntary job loss (Boisjoly, Duncan and Smeeding 1992), the impact of firm mobility is positive for both cohorts.
Occupational Mobility: Theory
Since Blau and Duncan’s seminal work (1967), sociologists have had a strong interest in occupational mobility, that is the movement between lower paying and higher paying
occupations (and vice versa), whether across generations or over the life course. Theory suggests multiple contradictory effects. The job search theory and the problem of imperfect information discussed earlier also apply to voluntary decisions to change occupations. Along these lines,
19
Leigh (1976), and Janovic (1997) proposed that individuals use their education, training and skills developed on the job and (attempt to) move through a series of progressively more well paying occupations over their working life. However, an alternate theory suggests that staying within one occupation is associated with greater wage gains. This draws upon the notion that spending significant time in one occupation allows for the development of occupation specific skills which make the employee more valuable and result in higher wages. Spilerman (1977) compares what he refers to as craft or professional career lines, where individuals remain within one occupation, earning progressively higher wages due to acquiring occupation specific skills, with a chaotic career line which is characterized by frequent movement between occupations and stagnant wages.
Occupational Mobility: Results
Most sociological research on occupational mobility has focused on the extent to which individuals have the opportunity to move between large groups of occupations (e.g. professional, clerical, laborer), which are in a sense proxies for detailed social classes. Income mobility here is implied (e.g. doctors earn more than crane operators), but it not directly measured (Haller 1975, Holmes and Tholen 2013). Recent research in this vein has also analyzed more detailed
occupational categories. For instance, Kambourov and Manovskii (2008) found that from 1968-1997, two year occupational mobility has increased from 10-15% at the one digit occupational level and from 16-20% at the three digit occupational level.
20
Caner and Wolff, 2007; Kambourov and Manovskii, 2008; Spilerman, 1977, Sicherman 1990). Occupational mobility is more likely for blue collar occupations (various forms of operator and laborers) although movement tends to be between various blue collar occupations Kim, 2013; Spilerman 1977).
A small body of literature within sociology and economics has also looked at the impact of occupational mobility on subsequent wages. The results are somewhat inconclusive. A few studies using data from the 1960s through the 2000s have found positive associations between occupational change and subsequent wages using one digit and three digit occupational
categories (Parado, Caner and Wolff, 2007, Leigh 1976). However, using three digit
occupational categories Gius (2014) found that while occupation changes within an industry were associated with higher wages, occupational changes that also involved an industry shift were associated with lower wages. Furthermore, Hollister (2012) found that during an
individual’s first 10 years of work experience, change between 1 digit occupational categories when moving firms was associated with a greater likelihood of both an increase and a decrease in wages during experience, relative to staying at the same firm in the same occupation. Finally, Even and Macpherson (2003) found that changing three digit occupation and industry together had a positive impact on workers earning the minimum wage, but no impact on workers earning above the minimum wage, and Gardekci and Neumark (1998) found that there was no impact of occupational change in the first 5 years of work experience on wages4.
Part of the inconsistency of the aforementioned research findings likely stems from the fact that none of the studies separate voluntary and involuntary occupational switches, that is, whether or not the occupational change was concurrent with an involuntary job loss. In fact the
21
Hollister (2012) and Gardekci and Neumark (1998) are the only papers which refer to firms at all. It is reasonable to expect that, like with firms, voluntary occupation switches might lead to higher wages while involuntary occupational changes would be associated with lower wages. When the two experiences are combined, the results may be unstable from paper to paper and are difficult to interpret regardless. In addition, only the Parrado, Caner and Wolff, 2007 and
Gardecki and Neumark (1998) papers use methods (instrumental variable generalized least squares and fixed effects) to address any potential endogeneity of occupational switches. Those who switch occupations may be particularly innovative and would have had high wages
regardless. On the other hand, occupational switchers may also be unstable and would have had lower wages even if they did not switch occupations. Although the direction of the endogeneity is uncertain, it is important to address it in some fashion.
Two articles also specifically examine the impact of occupational switching for displaced workers. Both Choi (1996) and Kambourov and Manovskii (2009) found that remaining in the same occupation after being displaced serves as a protective factor. The wage losses for
displaced workers who remained in the same occupation (6% wage loss) were significantly less than those for displaced workers who changed occupation (18% wage loss) Kambourov and Manovskii (2009). Choi (1996) also found that the protective quality of retaining one’s
occupation following job displacement was stronger as education increased. This is interesting as research has indicated that educational level is not associated with the level of earnings loss following displacement in general in any consistent fashion (Koeber and Wright 2001, Stevens 1997, Helwig 2001).
22
occupational tenure to industry and firm tenure, with findings that occupational tenure is by far the most important Kambourov and Manovskii (2009), Yamaguichi (2010), Pavan (2011). Returns to occupational and firm tenure vary by education as well as occupation. For instance, Sullivan (2010) found that returns to occupational tenure were much larger for professional craft and service occupations as compared to clerical, labor and operative occupations. Yamaguichi (2010) found that over the first 10 years of labor market experience, for those with a high school diploma, career tenure (defined by years in the same occupation and industry) accounted for a 13% increase in wages while employer tenure only accounted for a 5% increase in wages. For individuals with a bachelor’s degree, the difference was even larger; career tenure accounts for 18% increase in wages while employer tenure accounted for < 1%.
23
from each other in terms of skill sets, the worse the wage outcomes (Gathman and Schonberg 2010, Ormiston 2014).
Summary on Inter-Firm and Occupational Mobility What we know:
Involuntary firm mobility tends to lead to wage losses; voluntary firm mobility tends to lead to wage gains.
Remaining in the same occupation appears to ameliorate the wage losses from involuntary job loss.
Occupational tenure and firm tenure lead to wage gains but occupational tenure leads to larger wages gains.
While education does not appear to moderate the impact of involuntary job loss in general, it may strengthen the protective nature of retaining one’s occupation following involuntary job loss.
The more closely related the skills are between a current and former occupation, the better the wage outcomes.
What we do not know:
How incorporating occupational change (or lack thereof) may change the impact of firm mobility on wages.
When firm mobility is voluntary, whether occupational mobility or retaining one’s occupation leads to better wage outcomes
How the impact of all forms of firm and occupational mobility vary over time in the last 50 years.
24 Research Questions5
This paper will focus on the following research questions: What are the impacts on wages of?
o voluntary inter-firm mobility while remaining in the same occupation
o voluntary inter-firm mobility while changing occupations
o involuntary inter-firm mobility while remaining in the same occupation,
o involuntary inter-firm mobility while changing occupations How do the above findings vary by educational attainment?
How do the above findings vary over time from 1965-2015?
To what extent is the impact of inter-firm and occupational mobility a function of the degree to which the prior and new occupation use similar skills?
Figure 2.1 presents a diagram of the conceptual model for my analysis.
Data and Methods
Sample
One of the primary research questions of this paper is how the impact of inter-firm and occupational mobility on wages has changed over the past 50 years. In order to assess changes over time, I use the strategy employed by Bernhardt et al (2001). I use data on three cohorts of workers who born and thus entered the labor market at distinct time points. I then follow the employment trajectories of these three cohorts at identical ages (and thus different points in chronological time). By comparing patterns across these cohorts I assess how the impact of mobility on wages varies over time.
In this paper, I examine the experiences of three cohorts of workers, those born 1942-52, 1957-64 and 1980-84. Each of these three cohorts has entered the labor market under different
25
economic conditions6. The original cohort entered the labor market (1960-70) when the internal labor market was still strong, long-term employment with a single firm was still common and layoffs were rare. The middle cohort entered the labor market (1975-82) just as the labor market was becoming more precarious, with increases in layoffs and a decline in employer tenure. This was also a period of extremely high unemployment. The recent cohort entered the labor market (1998-2002) after the aforementioned changes in the employer-employee relationship had been solidified. However, they also entered the labor market in a period of relative prosperity, although by their late 20s, this was no longer the case (Kalleberg 2010). In addition to influencing the wage trajectories of these three cohorts (Bachman 2009), it is also likely that these various economic conditions have impacted the relationship between various types of inter-firm mobility and wage outcomes.
For each cohort I include a sample of men aged 18-31. Thus I examine the impact of mobility within the context of the early years of work. This is in part determined by the fact that data is only available for the most recent cohort through age 317. However, young workers (those in their teens and 20s) have been the focus of considerable attention by labor market scholars. It is in these years that individuals complete their education, enter the world of work, and explore and frequently decide on occupations. Decisions made during this age period will set trajectories that impact their earning power for the remainder of their lives (Rindfuss, Swicegood and
Rosenfeld 1987). A substantial portion of the occupational and firm mobility that occurs in the
6 The national unemployment rate ranged from 3.5-6.7 between1960-70. However it was <= 5.7 in every year except
1961. The national unemployment rate ranged between 5.8-9.7 from 1975-82 and was above 7.0 in all but two of those years. The national unemployment rate ranged from 4.0-5.8 from 1988-2002.
7 While data for the original cohort are technically available through age 39, due to both sampling structure and
26
working years is likely to occur during these ages. In addition, approximately two thirds of lifetime wage growth occurs in the 20s and early 30s (Bernhardt et al 2001).
I restrict the sample to men for two reasons. First, much of the research on inter-firm mobility, particularly cohort specific analyses, have used samples of men. Therefore, in order to best compare my results to previous findings I restrict the sample to men. Second, in the time period examined (1965-2015), women’s labor market experiences varied dramatically from men as women entered the labor force in much greater numbers and made inroads into previously male dominated occupations. Thus the changing labor market contexts (e.g. increased precarity) over the past 50 years have impacted women differently from men. Thus it is appropriate for analysis of women to be done in a separate paper. In the third paper, I focus on comparing cohorts of women (although using a different outcome).
The data are from the National Longitudinal Surveys for three cohorts: NLS Young Men (5225 men born 1942-52; original cohort), NLSY79 (8979 men born 1957-64; middle cohort)8, and NLSY97 (4599 men born 1980-84; recent cohort). These nationally representative surveys have been widely used in the social sciences to examine labor market outcomes. In addition, they provide the most extensive data available for comparing patterns across cohorts. As mentioned, I will use samples of men aged 18-31. Men aged 18-22 who are enrolled in school will be
excluded. This is because firm and occupational mobility for individuals still completing their schooling does not reflect true career patterns, as schooling rather than work is likely the focus of their energy at the time. In fact the Department of Labor does not consider full time students to be ‘employed’ even when they hold jobs.
27
I use 14 years of data from the NLSY97 (1998-2011), 16 years of data from the NLSY79 (1979-1994) and 12 years of data from the NLS Young Men (1966, 1967, 1968, 1969, 1970, 1971, 1973, 1975, 1976, 1978, 1980, 1981). While the NLSY79 and NLSY97 collect data
annually during the years used for this paper, this is not true of the NLS Young Men, where there are occasionally two years between surveys. I will discuss this issue further in the Analysis Techniques section.
Attrition in the NLSY79 is low. For the NLSY79, in the years 1979-93, the response rate for living respondents was at least 90% in all years through 1994. For the NLSY97, retention rates are somewhat lower, ranging between 80-93% over the course of the survey, with retention rates over 90% through the fourth round (2000). For the NLS Young Men, retention rates are still a bit lower; response rates for living respondents through age 30 are 72%- 80%, for 1969-81 (they higher before 1969), although response rates are at least 76% in all but one year. Bernhardt et al (2001) who conducted a similar analysis (impact of firm mobility on wages) using data from the NLSY79 and NLS Young Men ages 16-37) did an extensive examination of attrition in the NLS Young Men, comparing the characteristics and regression coefficients of the remaining sample and those lost to attrition (using the years those respondents were present). The determined that attrition had minimal impact on their findings.
Variables
28
race/ethnicity (white, black, Latino, multiracial, other9), lifetime weeks of work experience, occupation (1 digit categories), industry (1 digit categories), firm tenure (years), lifetime occupation tenure (years), marital status. Occupation and industry will capture if individuals in some occupations/industries (which may be higher or lower paying) are more likely to change firm and/or occupation voluntarily or not.
I do not include a variable for age. This is because as I am using a cohort sample, age and calendar year are highly collinear. I chose to use calendar year rather than age after exploratory data analysis suggested that the patterns of wage trajectories over time were more accurately modeled by year, rather than age. While age captures elements of the relationship between life course and wages, calendar year is most appropriate for capturing the effect of changing macro-economic conditions. For each cohort, I use a functional form for calendar year that both best fit the data and represents what we know about macro-economic conditions in that time period. For the NLS Young Men, I model calendar year as both a linear an squared term. This represents that real wages increased up until about the mid-1970s and declined slightly afterwards. For the NLEY79, I use a linear term for calendar year as real wages tended to increase slightly from the mid-1980s (recovery from the early 1980s recession) through the md 1990s. For the NLSY97, I use a linear term combined with a dummy variable to let wages be flat from 2000 2008 and decrease from 2008 (as a result of the recent financial crisis).
The key variable of interest is type of inter-firm mobility. I measure this by a seven category variable: 1) remained in same firm, 2) changed firm voluntarily and remained in same occupation, 3) changed firm voluntarily and changed occupation, 4) displacement from previous
9 The NLSY does not collect information on whether a respondent is Asian American or Native American
29
firm and remained in same occupation at subsequent position 5) displacement from previous firm and changed occupation at subsequent position 6) fired from previous firm and remained in same occupation at subsequent position 7) fired from previous firm and changed occupation at new firm. I define a displacement as an involuntary job loss that is not related to the characteristics of the employee e.g. (layoff, plant closure, layoff, end of temporary job). It is important to
distinguish these displacements from firing as being fired is generally related to the employee having poor workplace attitudes or behaviors which may impact prospects for future
employment. Thus we would expect that wage losses following firing may be worse than wage losses following displacement. A voluntary firm move is one that does not involve either type of involuntary job loss10.
The actual measure of firm-mobility consists of 6 time varying variables each measuring whether a specific type of inter-firm mobility has occurred at least once before the survey year, e.g. one variable for voluntary firm switches with occupation change, another for voluntary firm switches while staying in the same occupation, etc. Because this measure is cumulative, it allows for effects that persist over time. A variant of this method has been widely used in the literature on firm changes (Fuller 2008, Keith and McWilliams 1995, Bernhardt et al 2001 (one chapter), Gardecki and Neumark 1998, Light and McGarry 1998)11. Some of the aforementioned articles
10 Another type of mobility is mobility due to family related reasons. As will be discussed in the next paper, while
these changes are technically voluntary they may not result in higher wages. I do not distinguish them here because the NLSY Young Men survey does not separate these types of mobility from other voluntary mobility. However, the incidence of family related mobility among young men is very low as determined from the data from the NLSY79 and NLSY97 data. Thus this should not be problematic for this paper. For this paper I do not distinguish between occupational changes into managerial and non-managerial positions because the occupation categories (1960 codes) used by the NLSY Young Men survey are very problematic in terms of determining what a managerial occupation is (e.g. no codes for supervisors, several finance related positions merged with managerial jobs. For the next paper I will distinguish between managerial and non-managerial occupations.
11 I do not use an alternate method which is frequently used in the Economics literature. This method assesses
30
actually measure the cumulative total number of each type of inter-firm mobility discussed. I explored using this method but decided against it given that the literature suggests that the first instance of voluntary mobility may be the most beneficial and the first instance of involuntary mobility the most detrimental (Fuller 2008, Perticarra 2002). I did experiment with including additional variables for the total number of subsequent events of each type of mobility. Likelihood ratio tests indicated that the only measure of subsequent events to significantly improve model fit is the measure of number of subsequent displacements with an occupation change and I include this variable in the models12.
In order to assess the moderating effects of education, I include interaction terms between having a bachelor’s degree and three of the measures of inter-firm mobility: displaced with new occupation, voluntary with new occupation, voluntary, remaining in same occupation. As
discussed, I distinguish bachelor’s degree holders as these individuals may have more power and choice in selecting firms and occupations due to possession of the bachelor’s degree. Therefore voluntary changes may benefit them more and involuntary changes may hurt them less. I do not include interaction terms for the other three types of inter-firm mobility as the percentage of the
assumptions about the functional form of the relationship between firm and occupational changes (and the control variables) and wages that are very different from the assumptions in standard econometric models.
The problem has to do with the mathematical properties of the logarithm. In typical models, we use the natural log of wages as the outcome. In models with ln(wage) as the outcome, one unit change in any independent
variable results in wages being multiplied by exp(β). In a model with ln(wage)t+1 – ln(wage)t as the outcome, a one
unit change in any independent variable results in the ratio of the wages being multiplied by exp(β)11. This is a very
different functional form, with no specific theoretical justification. And functional form matters. Using the wrong form can result in very biased and unreliable coefficients. As just an example, the coefficient for age is positive in standard econometric models of wages, but it is negative when the difference in log wages is used as the outcome.
To put this issue in perhaps more intuitive terms, a model with log of wages as the outcome allow us to interpret (approximately) any coefficient (β) as the percentage change in wages occurring for a unit change in any
independent variable. However for the model with ln(wage)t+1 – ln(wage)t as the outcome, for a unit change in any
independent variable,we multiply ((% change in wages/100) + 1) by exp(β). Thus, using a very loose conceptual
approximation, this model is estimating something akin to the impact of a unit change in the independent variable on the ‘percentage change in the percentage change’ of wages.
12 The incidence of subsequent events for voluntary, fire and displacement while remaining in the same occupation
31
sample who has experienced these events and has a bachelor’s degree is very small (e.g. < 5%; in some cases < 1%). Therefore estimates of interaction terms would be unreliable.
Consistent with much of the literature, I do not analyze occupation changes within a single firm (Pavan 2011, Yamaguichi 2010). Such occupation changes are difficult to interpret because they may result from many factors including promotions, demotions, firm restructuring, individual choice etc. Such changes do not necessarily reflect a decision on the part of the
employee to change occupations, as even occupation changes following involuntary job loss do. Occupation is measured in 3 digit census categories. The NLSY Young Men survey uses 1960 census occupations, the NLSY79 uses 1970 census occupations and the NLSY97 uses 2000 census occupations. Based on the suggestions at my proposal defense I will use the categories provided by each survey to analyze data from that survey (e.g no harmonizing).
Finally I use variables to measure the degree of difference between the skills used in the individual’s current and former occupation. The lower the difference, the more skill
transferability between the occupations. I use skill measures for the NLSY79 and NLSY97 cohorts; there was not data available which allowed for matching skills with the 1960 occupational codes used by the NLS Young Men survey.
32
coefficients on them are allowed to vary between the first and second year13. Subsequent years and persons who have not yet changed occupations receive a score of 0 (e.g. no difference between the occupations). The skill scales are as follows:
Skill Scales
General Educational Development (1-6) Cognitive Aptitudes (1-5)
Worker Function related to Data (0-8) Worker Function related to People (0-8) Social Aptitudes (0-100)
Physical Aptitudes (1-5)
Worker Function related to Things (0-8) Strength (1-5)
The description of the scales is as follows: General Educational Development takes the highest score on three measures of math, reasoning and verbal ability. This measures the level of abstraction and complexity that are required for the activities of the job. in terms of activities of job e.g. reasoning – scientific thinking vs follow instructions. Cognitive Aptitudes is the average of intelligence aptitude, verbal aptitude, and math aptitude. This assesses what aptitude level is required to do job; it is a ranking compare to population at large. The three Worker Functions scales rank how complex the activities of the occupation are related to category. For instance for ‘People’, ‘take instructions’ is considered less complex than ‘mentor’. For ‘Data’, ‘copy’ is less complex than ‘analyze’. For ‘Things’, precision work is considered more complex than operating simple machinery. The Social Aptitudes scale includes the aptitude required for the occupation on the following types of activities: influencing people, directing activity, dealing with people beyond giving and taking instructions. This is measured by the percentage of persons in occupation requiring this skill. Physical aptitudes is the average of the following: motor
13 I explored using applying them to the third year also, but none were statistically significant and there was no
33
coordination, manual dexterity, finger dexterity, color discrimination, eye-hand-foot coordination, spatial perception, form perception.
For the NLSY97, I use O*Net scores on 923 occupations aggregated (a weighted average) to Census 2002 occupation categories (which I then matched with the Census 2000 categories used in the Recent Cohort survey). For occupation changers, I take the absolute value of the difference between the current and former occupation on each of 35 indicators and average them to make 7 scales devised by O*Net. For the NLSY97, the skill difference is weighted by the importance of the skill to the occupation, which is also provided by O*Net in a 4-5 point ranking. As with the Middle Cohort, the skill differences are applied to the first and second year the individual is in the in new occupation. Subsequent years and persons who have not yet changed occupation are assigned a value of 0 (no difference in skill). The scales are as follows:
Skill Scales (all are on 7 point scale): Content (Academic)
Process (Thinking/Learning) Social Skills
Complex Problem Solving Skills Technical Skills
Systems Skills
Resource Management Skills
34
gauges and dials, and repairing. Systems judgement includes decision making, e.g. considering the costs and benefits of acting, identifying measures of performance. Resource Management involves management of financial, material and personnel resources.
Analysis Techniques
The data I use are longitudinal and the unit of analysis is the person year. The form of the data is thus Yit = Xitβ + νi + εit where Yit is log of wages at time ‘t’, Xit is a matrix of the
independent variables (including the measures of firm change) at time ‘t’, νi captures time invariant unobserved individual characteristics and εit captures time varying unobserved
characteristics at time ‘t’. Due to the presence of νi the error term (νi + εit) is correlated over time. I will use thus use random effects models to account for this correlation and produce efficient coefficient estimates and correct standard errors. Because there may be correlation between time invariant unobserved individual characteristics that may influence both wages and the propensity to change firms or occupations voluntarily or involuntarily, I will also use fixed effects models to analyze the data. There are several ways to mathematically represent a fixed effects model, but one way to think about it is including a dummy variable for each individual in the model, which absorbs (and hence controls for) all of the unobserved time invariant individual characteristics.