DEVELOPMENT OF A NOVEL ASSAY OF PROTEIN TYROSINE PHOSPHATASE ACTIVITY IN SINGLE CELLS USING CAPILLARY ELECTROPHORESIS
Ryan Matthew Phillips
A dissertation submitted to the faculty of the University of North Carolina at Chapel Hill in partial fulfillment of the requirements for the degree of Doctor of Philosophy in the School of Medicine (Pharmacology).
Chapel Hill 2013
Approved by:
Nancy L. Allbritton, M.D., Ph.D. Lee M. Graves, Ph.D.
ii Abstract
RYAN MATTHEW PHILLIPS: Development of a Novel Assay of Protein Tyrosine Phosphatase Activity in Single Cells Using Capillary Electrophoresis
(Under the direction of Nancy Allbritton, M.D., Ph.D.)
The inhalation of diesel exhaust particles has been linked to human diseases including airway inflammation, arrhythmias, heart attack, stroke, hypertension, and cancer.
In vitro studies have implicated the inhibition of protein tyrosine phosphatases (PTPs) by diesel exhaust components as a contributor to the inflammatory processes underlying these conditions. A more complete mechanistic understanding of this phenomenon could be achieved by observing the effects of diesel exhaust particle inhalation on the airways of exposed living human subjects. While airway specimens can be obtained safely from these subjects by bronchial brushing, sample analysis is complicated by low total cell numbers, poor viability, and contamination with inflammatory cells and mucus. We present a novel approach to the analysis of these challenging samples at the single-cell level that provides a direct measure of PTP activity without sacrificing information about intercellular
heterogeneity commonly lost by analysis of bulk lysates.
iii
of PTP activity in these systems by three toxic components of diesel exhaust particles: pervanadate, 1,2-naphthoquinone, and Zn2+.
The PTP reporter was then applied to common model systems of airway biology. PTP activity, as well as inhibition by the toxins listed above, was quantified in immortalized BEAS-2B bronchial epithelial cells as well as cultured primary human airway epithelial cells. PTP activity was then measured in single cells obtained directly from a living human subject via bronchial brushing. The ability to analyze these small, heterogeneous samples of primary cells at the single-cell level demonstrates the power of this approach as new tool for the field of airway biology as well as for the broader study of PTP signaling.
iv
Table of Contents
List of Tables ... ix
List of Figures ...x
List of Abbreviations and Symbols... xi
Chapter I. Introduction ...1
Protein tyrosine phosphatases ...1
PTP substrate recognition and specificity ...1
Regulation of PTP activity ...2
PTPN1...5
PTPN2...6
Diesel exhaust particles and human health ...6
Inhibition mechanisms of PTPs ...7
Sources of heterogeneity in cell populations ...8
Airway structure and bronchial brushings ...9
Measurement of enzyme activity with peptides ...10
Capillary electrophoresis ...11
Analysis of fluorescent peptides using CE-LIF ...13
Solid phase peptide synthesis ...13
Origins of the TS13 and pTS13 sequences ...15
v
Beas-2B cells ...15
Primary human airway epithelial cells (hAECs) ...16
References ...17
II. Measurement of Protein Tyrosine Phosphatase Activity in Single Cells by Capillary Electrophoresis ...27
Overview ...27
Introduction ...28
Experimental Section ...30
Materials ...30
Peptide Synthesis and Characterization ...30
Capillary Electrophoresis ...31
Recombinant Phosphatase Activity Assay ...32
Determination of Kinetic Constants ...33
Cell Culture ...33
Cell lysate experiments ...33
Single Cell Phosphatase Measurement ...34
Statistical Analysis ...35
Results and Discussion ...35
Peptide Selection and Separation ...35
vi
Inhibition of Recombinant Enzymes by Toxins
From Diesel Exhaust ...38
Lifetime of pTS13/TS13 in Cell Lysates ...40
PTP Activity and Inhibition in A431 Cell Lysates ...40
Lifetime of pTS13/TS13 in Single Cells ...41
Single A431 Cell PTP Activity ...41
Conclusion ...43
References ...51
III. Analysis of Protein Tyrosine Phosphatase Activity in Single Human Airway Cells ex vivo by Chemical Cytometry ...54
Overview ...54
Introduction ...55
Experimental Section ...57
Materials ...57
Cell Culture ...58
Immunofluorescence ...58
Single Cell Capillary Electrophoresis ...59
Reporter Lifetime Measurement in Single Cells ...59
Single Cell Phosphatase Activity Assay ...59
Statistical Analysis ...60
vii
Lifetime of the PTP reporter in Single BEAS-2B Cells ...60
Measurement of PTP Activity in Single BEAS-2B Cells ...61
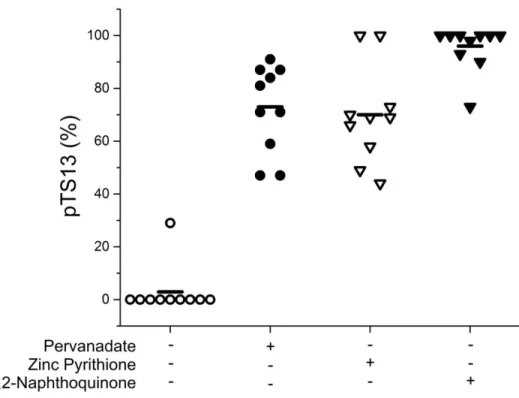
Inhibition of PTP Activity in Single BEAS-2B Cells ...61
Lifetime of the PTP Reporter in Single Primary hAECs ...62
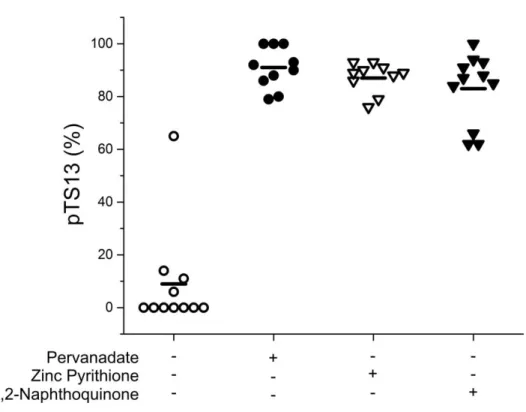
Measurement of PTP Activity in Single Primary hAECs ...63
Inhibition of PTP Activity in Single Primary hAECs ...63
Measurement of PTP Activity in a Bronchial Brushing Specimen ...64
Conclusion ...65
References ...73
IV. Conclusions and Future Directions ...75
viii List of Tables Table
2.1 Kinetic constants for pTS13 dephosphorylation by
ix
List of Figures
Figure
2.1 Separation of pTS13, TS13, and fragments ...46
2.2 Inhibition of recombinant PTPs with environmental toxins ...48
2.3 Inhibition of PTP activity in A431 lysates ...49
2.4 PTP activity measurement in single A431 cells ...50
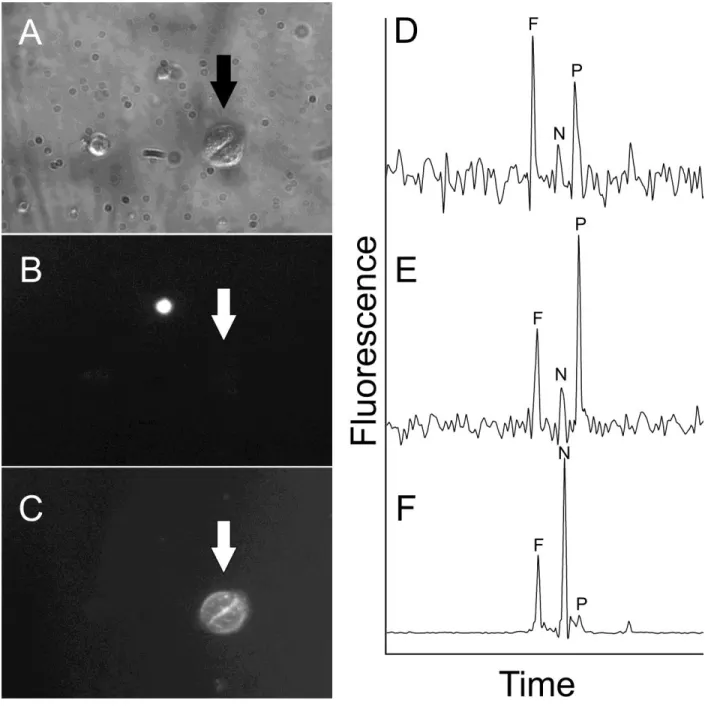
3.1 Fragmentation of TS13 in single BEAS-2B cells ...67
3.2 PTP activity in single BEAS-2B cells ...68
3.3 Fragmentation of TS13 in single hAECs ...69
3.4 PTP activity in single hAECs ...70
x
List of Abbreviations and Symbols
βPDGFR: platelet-derived growth factor receptor beta
μep electrophoretic mobility
ug microgram(s)
uL microliter(s)
μM micromolar
°C degrees Celsius
6-FAM 6-carboxyfluorescein
ADCC antibody dependent cellular cytotoxicity
ALI air-liquid interface
amol attomole(s)
AP-1 activator protein 1
Asp aspartic acid
ATP adenosine triphosphate
AZ Arizona
BB bronchial brushing
BCa bias-corrected and accelerated BEBM bronchial epithelial basal medium BEGM bronchial epithelial growth medium
BOC tert-butoxycarbonyl
BSA bovine serum albumin
CA California
xi
Cdc25A cell division cycle 25 homolog A cDNA complementary deoxyribonucleic acid
CE capillary electrophoresis
CE-LIF capillary electrophoresis with laser-induced fluorescence detection CHCA α-cyano-4-hydroxycinnamic acid
cm centimeter(s)
cm2 square centimeter(s)
Co cobalt
CO2 carbon dioxide
COOH carboxylic acid
COPD chronic obstructive pulmonary disease
CT computed tomography
CTAB cetyl trimethylammonium bromide CZE capillary zone electrophoresis
D aspartic acid
DCM dichloromethane
DEP diesel exhaust particles
DIC diisopropylcarbodiimide
DMEM Dulbecco’s Modified Eagle’s Medium
DMF dimethylformamide
DNA deoxyribonucleic acid
DSP dual-specificity phosphatase
DTT dithiothreitol
E glutamic acid
xii ECB extracellular buffer
e.g. exempli gratia (for example) EGF epidermal growth factor
EGFR epidermal growth factor receptor
Em emission wavelength
EOF electroosmotic flow
EpCAM epithelial cell adhesion molecule ESR1 estrogen receptor 1
eq equivalent(s)
ERK extracellular-signal-regulated kinase
Ex excitation wavelength
FBS fetal bovine serum
Fc fragment crystallizable region FDA Federal Drug Administration FISH fluorescence in situ hybridization
fL femtoliter
Fmoc fluorenylmethyloxycarbonyl
fmol min-1 mg-1 femtomoles per minute per milligram FNA fine needle aspiration
g gram(s) or acceleration due to gravity Gab1 GRB2-associated binding protein 1
Glu glutamic acid
GPCR G-protein coupled receptor
xiii GST glutathione S-transferase
h hour(s)
H2O2 hydrogen peroxide
hAEC human airway epithelial cell(s)
HCl hydrochloric acid
HCTU 2-(6-Chloro-1H-benzotriazole-1-yl)-1,1,3,3-tetramethylaminium hexafluorophosphate
HEPES 2-[4-(2-hydroxyethyl)piperazin-1-yl]ethanesulfonic acid HER2 human epidermal growth factor receptor 2
HOBt 1-hydroxybenzotriazole
HPLC high performance liquid chromatography IC50 concentration eliciting 50% inhibition
IL-8 interleukin 8
IHC immunohistochemistry
IR insulin receptor
JAK2 Janus kinase 2
JNK c-Jun N-terminal kinase
KBM keratinocyte basal medium
kcat turnover number
KCl potassium chloride
KGM keratinocyte growth medium
KM Michaelis constant
kV kilovolt(s)
L leucine
L858R leucine residue 858 mutated to arginine
xiv
LIF laser-induced fluorescence
M molar
MA Massachusetts
MALDI matrix-assisted laser desorption ionization MEKC micellar electrokinetic chromatography
MeOH methanol
MET hepatocyte growth factor receptor
min minute(s)
mg milligram(s)
Mg magnesium
MgCl2 magnesium chloride
min minute(s)
mL milliliter(s)
mM millimolar
Mn manganese
MnCl2 manganese chloride
mol mole(s)
MOPS 3-morpholinopropane-1-sulfonic acid mRNA messenger ribonucleic acid
MS mass spectrometry
Mtt methyltrityl
myrTS13 myristoylated peptide reporter
n sample size
N2 nitrogen
xv
NaOH sodium hydroxide
NC North Carolina
Nd:YAG neodymium-doped yttrium aluminum garnet
NF-κB nuclear factor kappa-light-chain-enhancer of activated B cells
Nle norleucine
nM nanomolar
nm nanometer(s)
nmol min-1 mg-1 nanomoles per minute per milligram NSCLC non-small cell lung cancer
OBt benzotriazolyl
OR Oregon
OtBu O-tert-butyl
P phosphorus
p statistical p-value
PCR polymerase chain reaction
PDAC pancreatic ductal adenocarcinoma
PDMS polydimethylsiloxane
pg picogram(s)
PLC-γ1 phospholipase C gamma 1
PM particulate matter
pmol min-1 mg-1 picomoles per minute per milligram
PS penicillin/streptomycin
PTP protein tyrosine phosphatase
xvi pTS13 phosphorylated peptide reporter
PV pervanadate
Q1 first quartile
Q3 third quartile
qPCR quantitative polymerase chain reaction
R2 correlation coefficient
rcf relative centrifugal force
RNA ribonucleic acid
ROS reactive oxygen species
rpm rotations per minute
RTK receptor tyrosine kinase
RT-PCR reverse transcriptase polymerase chain reaction
s second(s)
SDS sodium dodecyl sulfate
SDS-PAGE sodium dodecyl sulfate polyacrylamide gel electrophoresis Shc Src homology domain 2 containing transforming protein
SOS Son of Sevenless
SPPS solid phase peptide synthesis
ssTS13 myristylated, disulfide linked peptide reporter STAT3 signal transducer and activator of transcription 3 STAT5 signal transducer and activator of transcription 5 T790M threonine residue 790 mutated to methionine TBA tetrabutylammonium phosphate
tBu tert-butyl
xvii
TGR Tentagel Rink
TKI tyrosine kinase inhibitor
TOF time of flight
TS13 nonphosphorylated peptide reporter
Tyr tyrosine
TX Texas
US United States
V volt(s)
Vmax maximum velocity
v/v volume/volume
VEGFR vascular endothelial growth factor receptor
Y tyrosine
I. Introduction
Protein tyrosine phosphatases. The protein tyrosine phosphatase (PTP) gene family consists of at least 100 members encoding enzymes capable of dephosphorylating proteins.1 The classical PTPs are specific for phosphotyrosine-containing substrates, while the dual-specificity phosphatases (DSPs) can act on phosphorylated tyrosine, serine, and threonine residues. All catalytically active members of the PTP family share a characteristic
phosphate-binding motif and act via a common mechanism.2 Briefly, a phosphotyrosine residue is brought into close proximity of the PTP catalytic cysteine by surrounding residues including an essential arginine. Nucleophilic attack of the phosphotyrosine phosphate atom by the cysteine, P-O bond cleavage, and protonation of the tyrosine side-chain oxygen by a nearby PTP aspartate yields a phosphocysteine intermediate, which is subsequently
converted to cysteine and free phosphate through hydrolysis of the unstable S-P bond by water. While the key catalytic machinery is conserved across PTPs, variations in non-catalytic regions of the phosphatase domain can lead to differing substrate specificity. Members of the PTP family participate in many facets of cell signaling and have been implicated in a variety of human diseases.
2
domain and adjacent unstructured regions.3 The higher-order structure of the PTP domain is highly conserved across PTPNs and RPTPs.4 Key features of the PTP domain include an absolutely conversed catalytic cysteine residue within the HCX5R “PTP signature motif”, a phosphotyrosine recognition loop containing a KNRY motif important for substrate
recognition, a WPD loop containing an aspartic acid critical to the phosphatase mechanism, and a Q loop that stabilizes a catalytic water molecule.5 While the major features and overall fold of PTP domains is well conserved, the surface residues as well as several areas involved in substrate binding are highly variable to afford specificity of substrate recognition and interactions with scaffold and adapter proteins. For instance, while the WPD loop is present across PTPs, specific residues within and adjacent to the loop determine the details of its structure and dynamics, which in turn affect substrate binding and catalysis.6 Variable residues critical to PTP substrate recognition also include two residues immediately
N-terminal to the tyrosine of the KNRY motif and residues within and adjacent to the secondary substrate-binding pocket found in some PTPs, including PTPN1. Ultimately, the
physiological substrate specificity of PTPs involves residues near the active site and more distant residues in the PTP domain that ensure proper substrate orientation, as well as the presence of additional protein-protein interaction domains and proper subcellular localization of PTPs.7
3
residues through protein binding.8 The latter three mechanisms of regulation have the greatest bearing on the work presented herein and therefore warrant further discussion.
PTP activity can be regulated by targeting to specific regions of the cell, both to prevent undesirable dephosphorylation and to ensure proximity of PTPs to appropriate targets.9 The former is illustrated by PTP-1B and TC-PTP, which both possess hydrophobic C-terminal regions that target the enzymes to membranes including the endoplasmic
reticulum. While membrane-bound, these enzymes possess little to no enzymatic activity, but physiological cleavage of the targeting sequences results in soluble PTPs with
significantly increased activity. Targeting of active PTPs to specific cellular
subcompartments has been observed, including cytoskeletal localization of PTPH1 by the Band 4.1 domain,10 as well as nuclear localization of PTPε by a removable N-terminal sequence11 and SHP-1 through a C-terminal sequence not found in the closely related SHP-2, which consequently does not localize to the nucleus.12 Because the physiological context of PTPs often involves spatial targeting within the cell, it is important to ensure that a reporter of PTP activity will be accessible to its enzyme of interest within the cell, and also underlines an important difference between measuring PTP activity in cell lysates and in intact cells.
A second important mechanism of PTP regulation involves the transient inactivation of PTP catalytic activity through oxidation. Catalysis by PTPs involves transfer of a
(R-4
SO3H) acids is irreversible. To prevent permanent PTP inactivation, the sulfenic acid can react with the peptide backbone to form a sulfenamide bond (R-SN-R) or with reduced glutathione or another cysteine residue to form S-glutathionylated cysteine or a disulfide bond, respectively. All of these products are less susceptible to further oxidation than sulfenic acid and permit regulation of signaling through reversible inactivation of PTPs. Proper regulation of PTPs through transient oxidation occurs in the complex redox environment of the intact cell, further supporting the value of studying PTP activity and inhibition in intact cells rather than lysates.
A third mechanism of PTP regulation involves physical separation of the enzymes from potential substrates through protein domains that bind phosphotyrosine, primarily the phosphotyrosine-binding (PTB) and src-homology 2 (SH2) domains.14 Both of these domains are non-catalytic protein-protein interaction modules that recognize and bind
5
domains interact with phosphotyrosine contribute to the intricacy and complexity of cell signaling, both domains bind phosphotyrosine residues, simultaneously permitting signal transduction based on tyrosine phosphorylation status and preserving signals by physically preventing binding and subsequent dephosphorylation by PTPs.18
PTPN1. First reported by Tonks et al,19 PTPN1 (PTP-1B) is one of the most studied of the non-receptor PTPs, and plays critical roles in cell physiology and homeostasis. PTPN1 modulates signal transduction through dephosphorylation of RTKs (e.g. βPDGFR,20 EGFR,21 IR22), cytoplasmic kinases (e.g. JAK2,23 GSK-3β,24 Src25), transcription factors (e.g.
STAT5,26 ESR127) and adapter proteins (e.g. β-catenin,28 p62Dok29). The broad signaling network of PTPN1 underlies its implication in disease processes including obesity, type II diabetes mellitus, cancer, and airway inflammation.30-31
While interest in PTPN1 activity and inhibition has fueled drug development efforts, few compounds have been tested in vivo.32 The PTPN1 inhibitor Trodusquemine (MSI-1436) was shown to increase fat loss in murine models of obesity,33 leading to Phase I clinical trials in healthy and obese diabetic individuals.34 Ertiprotafib progressed through Phase II clinical trials as a potential treatment for Type II Diabetes Mellitus, but was abandoned due to undesirable off-target effects.35 Finally, studies in mice suggest that PTPN1 inhibition with 7-bromo-6-difluoromethylphosphonate 3-naphthalenenitrile may protect against progression and metastasis of some breast cancers,36 however this has not yet been demonstrated in humans and concerns exist about the complex nature of PTPN1
6
PTPN2. PTPN2 (T-Cell Protein Tyrosine Phosphatase, TC-PTP) was originally described in T-cells, but is ubiquitously expressed in humans.37 Significant structural and functional similarities have been noted between PTPN2 and PTPN1.38 However, absence of these enzymes in mice result in different phenotypes,39-40 and structural differences have been identified as potential targets for specific inhibitors.41
Cancer has been a major focus of studies linking PTPN2 to human disease. Absent or decreased PTPN2 is associated with tumorigenesis in certain forms of human T-cell acute lymphoblastic leukemia,42 and breast cancer,43 and inhibition of apoptosis in murine keratinocytes exposed to ultraviolet radiation.44 Conversely, deceased PTPN2 function results in decreased viability and proliferation in murine B-cell lymphomas,45 suggesting that PTPN2 can both promote and inhibit carcinogenesis.
This duality of action extends beyond cancer. Decreases in PTPN2 activity have been implicated in autoimmune disease due to insufficient regulation of T-cell receptor
signaling,46 and specifically in ulcerative colitis and Crohn’s disease through disregulation of autophagy47 and inflammatory signaling48 in colonic epithelia. However, partial inhibition of PTPN2 appears to prevent the development of insulin resistance in type 2 diabetes.49 The complicated implications of PTPN2 activity modulation may underlie the lack of clinical inhibitor development for this enzyme.
7
particularly in areas with high levels of automobile and industrial pollution. Processes like diesel fuel combustion generate fine and ultrafine particulate matter (PM) that deposits in the airways when inhaled. Epidemiological studies have linked PM inhalation to increases in blood pressure,51 decreased cardiac autonomic control,52 and significantly increased risk of heart attack and stroke.53
While the details underlying these health effects has not been fully elucidated, PM exposure has been linked to increased extracellular signal-regulated kinase (ERK) dependent IL-8 secretion in airways,54 as well as increases in NF-κB and AP-1 activation and phosphorylation of p38 and JNK kinases,55 all indicative of an inflammatory response mechanism. Recently, PM exposure has been shown to increase reactive oxygen species (ROS) in cells, resulting in activation EGFR56 and p38.57 A major contributor to the signaling disruptions associated with PM is intracellular PTP inhibition, which can be accomplished by several mechanisms as a result of the complex chemistry of PM.58
8
cysteines. Ultraviolet light has also been shown to oxidize these residues and inhibit PTPs secondary to reactive oxygen species generation.
A non-oxidative mechanism of PTP inhibition related to PM involves the covalent modification by quinones adsorbed to airborne particulates or formed intracellularly through metabolism of naphthalene.65-66 Specifically, exposure of PTPN1 to 1,2-naphthoquinone has been shown by mass spectrometry to result in covalent modification of cysteine and histidine residues.67 Non-oxidative inhibition can also result from binding of Zn2+ to the PTP active site.68 It should be noted that, while quinones and zinc can modify PTP through
non-oxidative mechanisms, these species are also implicated in cellular redox disruption through glutathione depletion.69-70
Sources of heterogeneity in cell populations. Investigations at the single cell level have shown a surprising level of heterogeneity, even within clonal populations. In
genomically unstable populations such as tumor cell lines, heterogeneity can result from the accumulation of isolated, stochastic genetic mutations and subsequent phenotypic alterations over time.71 However, non-genetic heterogeneity is also an important consideration, and can be subdivided into temporal and population heterogeneity.72
Temporal heterogeneity is the variation of some characteristic (e.g. protein
9
Population heterogeneity refers to temporally stable differences between clones. Computer modeling in conjunction with experimental validation suggests this phenomenon emerges from a combination of localized environmental fluctuations and subsequent cell-cell communication leading to adaptation such that while individual cells may differ, the net result of their signaling behavior maintains environmental homeostasis.75
While the variation among clonal populations of cells is a strong argument for pursuing techniques that measure signaling in single cells, the added complexity of tissue samples, whether from model organisms, human research subjects, or patients, provides further motivation. Tissues are by definition a mixture of distinct cell types and bulk analysis of a mixed population averages multiple layers of heterogeneity into a single “typical”
readout. Two tissues of interest during this work were human bronchial brushings and tumor biopsies.
10
Measurement of enzyme activity with peptides. Peptides allow investigation into the impact of protein primary (and sometimes secondary) structure on behavior. While the interaction of a substrate peptide with an enzyme does not recapitulate potential higher order structure, peptides have been used to study a wide range of enzyme-catalyzed protein
modifications (e.g. methylation,80 acetylation,81 ubiquitination,82 proteolysis83), though further discussion herein will focus on phosphorylation and dephosphorylation.
Perhaps the most straightforward application of peptides for measuring phosphorylation is the monitoring of transfer of radioactive phosphate from [γ-32
P] ATP to a substrate peptide by a kinase. This approach is widely used with enzyme-specific84 or generic peptide substrates (e.g. poly(Glu,Tyr) 4:1 copolymer)85 to measure kinase activity. While a powerful technique, relatively high limits of detection (10-14-10-18 mol) limit its utility in studying single cells. Peptide substrate phosphorylation is also assessed via Western blot with anti-phosphotyrosine antibodies.86 The integration of SDS-PAGE with this approach affords separation and detection of multiple substrates. Drawbacks to this technique include costly antibodies and relatively large sample size requirements. Another powerful approach for evaluation of kinases using peptides is mass spectrometry. Using this analytical technique, naturally occurring87 and synthetic peptides88 alike can be identified by molecular weight from complex samples including cell lysates89 and single cells90.
11
rhodamine 110 and results in a fluorescence increase, but serine-phosphorylation of the substrate prevents degradation and keeps the fluorophore in a conjugated, non-fluorescent state.91 A single-step alternative for kinase sensing involves development of environmentally sensitive sensors in which phosphorylation in the presence of an appropriate soluble
phospho-motif binding domain results in a changes in solvation or quenching interactions and induce a fluorescence increase.92 Fluorogenic peptides have been used to measure phosphatase activity using tyrosine analogs that exhibit a fluorescence increase upon dephosphorylation93 as well as designs in which serine-dephosphorylation leads to peptide cyclization and fluorophore release.94
Capillary electrophoresis. Jorgenson and Lukacs first demonstrated that free-zone electrophoresis could be performed in thin glass capillaries to provide high resolution separations.95 Chief among the benefits described in this early work were the elimination of potentially adsorptive stabilizing media (gels, paper, etc.) and the elimination of thermal gradient formation as a major contributor to band broadening. Since this initial report, capillary electrophoresis (CE) has evolved into a powerful analytical technique with a wide range of applications.
12
toward the negative electrode with a velocity dependent on electric field strength as well as buffer pH, ionic strength, and viscosity.
While CZE is a powerful separation technique, the inclusion of micelle-forming additives in the background electrolyte, known as micellar electrokinetic capillary
chromatography (MEKC), can aid in difficult separations by providing a pseudostationary phase. Under MEKC conditions, analytes migrate based on EOF and μep, but may also interact with micelles through electrostatic as well as hydrophibic interations. The dynamic partitioning of analytes between free solution and large, relatively slow-moving micelles provides an additional parameter for distinguishing otherwise similar analytes.
Analytes in CE can be detected by a variety of methods including absorbance, conductivity, mass spectrometry, and fluorescence. Laser induced fluorescence (LIF) detection, in which fluorescent analytes are excited with a laser, can afford very high sensitivity on the order of 10-21 mol.97 LIF detection is limited to detection of fluorescent analytes, which may necessitate careful selection or modification of analytes, but also eliminates the potentially confounding detection of contaminants such as assay constituents and cell debris.
13
Analysis of fluorescent peptides using CE-LIF. While fluorogenic peptides can provide real-time information about phosphorylation, but as only one species is fluorescent, phosphorylated and nonphosphorylated reporter cannot be quantified simultaneously. This issue can be addressed using CE-LIF, which has been demonstrated for purified peptides, in vitro assays, cellular lysates, and single cells. Because fluorescence does not rely on
phosphorylation status, both species can be quantified simultaneously. Peptides containing tryptophan or phenylalanine can be detected (ex: ~270 nm, em: 305 nm) without
derivitization,105 however this method lends itself to confounding from other biological components containing these residues. Derivitization of analytes with fluorophores permits detection at wavelengths unlikely to overlap significantly with native fluorescence. A wide range of reactive fluorophores are available for functionalization of the amines, hydroxyls, carboxylic acids, and sulfhydryls present on peptides and proteins (bioconjugate techniques), and many have been used in conjuction with CE-LIF either prior to electrophoresis (off-column) or within the capillary (on-(off-column).105 For analysis of synthetic peptides,
fluorophores can be readily conjugated to the N-terminus or to reactive side chains such as lysine using standard SPPS.
14
carboxylic acid. The completed peptide is then cleaved from the resin for purification and characterization.106
Polystyrene resin beads serving as solid support for synthesis afford rapid reagent exchange and dramatically simplify multi-step syntheses. Beads can be functionalized with a variety of linkers to yield products with C-terminal moieties including amides, carboxylic acids, and sulfhydryl groups. Linker identity also dictates the conditions under which the peptide is removed from the resin. The acid-labile trialkoxybenzhydrylamine (Rink amide) linker was used for synthesis of the peptide amides TS13 and pTS13, while peptide acid fragments were synthesized using the highly acid-labile 2-chlorotrityl chloride linker.
Peptides often contain amines, carboxylic acids, hydroxyls, or sulfhydryl moieties that require chemical modification, in the form of orthogonal protecting groups, to avoid undesirable reactivity during synthesis. The use of N-α-fmoc protected amino acids prevents off-resin amide bond formation during peptide elongation. Groups such as tert-butyl (tBu), O-tert-butyl (OtBu), and tert-butoxycarbonyl (BOC) are commonly used to protect
carboxylic acids, hydroxyls, and amines. These groups are removed during cleavage from the resin and thus are inappropriate for on-resin side-chain modification. However, protecting groups such as methyltrityl (Mtt) can be removed under otherwise minimally disruptive conditions and thus facilitate on-resin side-chain modifications.
15
This ester is susceptible to nucleophilic attack by the N-terminal free amino of the resin-bound peptide, leading to peptide bond formation.
Origins of the TS13 and pTS13 sequences. The observation that tyrosine kinases preferentially phosphorylate sites with nearby acidic residues107 led to investigation of numerous proteins as potential EGFR substrates, including human erythrocyte Band 3 Protein.108 The acidic N-terminus of this protein served as the basis for the highest affinity EGFR peptide substrate known (Km = 34 μM).109-110 This peptide in turn was modified with an N-terminal fluorescein to produce TS13 and its phosphotyrosine-containing analogue pTS13.
A431 cells. The A431 cell line was cultivated from a human epidermoid carcinoma specimen by Giard and colleagues.111 These cells produce large quantities of wild-type EGFR,112 approximately 2.6 x 10⁶ receptors/cell,113 due to genetic amplification through chromosomal translocations.114 These cells have been essential in the study of PTP activity and inhibition. Lee et al observed that treatment of A431 cells with EGF results in reversible PTP1B inhibition linked to a transient increase in intracellular H2O2.115 The mechanism of this inhibition, PTP sulfenylation, was subsequently described in A431 lysates116 and later in living A431 cells.117 These cells have also been used to study the importance of PTPs in cell adhesion118 and as transducers between GPCRs and RTKs.119
16
and exposed to Ad12-SV40 virus, resulting in immortalized, nontumorigenic bronchial epithelia that were continuously propagated in culture for over one year. While BEAS-2B cells are non-ciliated,121 they bear similarities to primary epithelia cultured as a monolayer in terms of antioxidative capacity,122 inflammatory response,123 and matrix attachment.124 These similarities have facilitated many studies of inflammatory signaling due to chronic disease as well as environmental exposures.125-129
17 References
1. Tonks, N. K., Nat Rev Mol Cell Biol, 2006, 7, 833-846.
2. Barford, D.; Das, A. K.; Egloff, M. P., Annu Rev Biophys Biomol Struct, 1998, 27,
133-164.
3. Tiganis, T.; Bennett, A. M., Biochem J, 2007, 402, 1-15.
4. Barr, A. J.; Ugochukwu, E.; Lee, W. H.; King, O. N.; Filippakopoulos, P.; Alfano, I.; Savitsky, P.; Burgess-Brown, N. A.; Muller, S.; Knapp, S., Cell, 2009, 136, 352-363.
5. Buist, A.; Zhang, Y. L.; Keng, Y. F.; Wu, L.; Zhang, Z. Y.; den Hertog, J.,
Biochemistry, 1999, 38, 914-922.
6. Brandao, T. A.; Johnson, S. J.; Hengge, A. C., Arch Biochem Biophys, 2012, 525, 53-59.
7. den Hertog, J., Mech Dev, 1999, 85, 3-14.
8. Tonks, N. K., FEBS J, 2013, 280, 346-378.
9. Mauro, L. J.; Dixon, J. E., Trends Biochem Sci, 1994, 19, 151-155.
10. Zhang, S. H.; Eckberg, W. R.; Yang, Q.; Samatar, A. A.; Tonks, N. K., J Biol Chem,
1995, 270, 20067-20072.
11. Kraut, J.; Volohonsky, G.; Toledano-Katchalski, H.; Elson, A., Exp Cell Res, 2002,
281, 182-189.
12. Poole, A. W.; Jones, M. L., Cell Signal, 2005, 17, 1323-1332.
13. den Hertog, J.; Groen, A.; van der Wijk, T., Arch Biochem Biophys, 2005, 434, 11-15.
18
15. Kaneko, T.; Huang, H.; Zhao, B.; Li, L.; Liu, H.; Voss, C. K.; Wu, C.; Schiller, M. R.; Li, S. S., Sci Signal, 2010, 3, ra34.
16. Yaffe, M. B., Nat Rev Mol Cell Biol, 2002, 3, 177-186.
17. Shoelson, S. E., Curr Opin Chem Biol, 1997, 1, 227-234.
18. Rotin, D.; Margolis, B.; Mohammadi, M.; Daly, R. J.; Daum, G.; Li, N.; Fischer, E. H.; Burgess, W. H.; Ullrich, A.; Schlessinger, J., EMBO J, 1992, 11, 559-567.
19. Tonks, N. K.; Diltz, C. D.; Fischer, E. H., J Biol Chem, 1988, 263, 6731-6737.
20. Klinghoffer, R. A.; Kazlauskas, A., J Biol Chem, 1995, 270, 22208-22217.
21. Flint, A. J.; Tiganis, T.; Barford, D.; Tonks, N. K., Proc Natl Acad Sci U S A, 1997,
94, 1680-1685.
22. Bandyopadhyay, D.; Kusari, A.; Kenner, K. A.; Liu, F.; Chernoff, J.; Gustafson, T. A.; Kusari, J., J Biol Chem, 1997, 272, 1639-1645.
23. Myers, M. P.; Andersen, J. N.; Cheng, A.; Tremblay, M. L.; Horvath, C. M.; Parisien, J. P.; Salmeen, A.; Barford, D.; Tonks, N. K., J Biol Chem, 2001, 276, 47771-47774.
24. Wang, Q. M.; Fiol, C. J.; DePaoli-Roach, A. A.; Roach, P. J., J Biol Chem, 1994, 269,
14566-14574.
25. Bjorge, J. D.; Pang, A.; Fujita, D. J., J Biol Chem, 2000, 275, 41439-41446.
26. Aoki, N.; Matsuda, T., J Biol Chem, 2000, 275, 39718-39726.
27. Arnold, S. F.; Obourn, J. D.; Jaffe, H.; Notides, A. C., Mol Endocrinol, 1995, 9, 24-33.
19
29. Dube, N.; Cheng, A.; Tremblay, M. L., Proc Natl Acad Sci U S A, 2004, 101, 1834-1839.
30. Dube, N.; Tremblay, M. L., Biochim Biophys Acta, 2005, 1754, 108-117.
31. Berdnikovs, S.; Pavlov, V. I.; Abdala-Valencia, H.; McCary, C. A.; Klumpp, D. J.; Tremblay, M. L.; Cook-Mills, J. M., J Immunol, 2012, 188, 874-884.
32. Scott, L. M.; Lawrence, H. R.; Sebti, S. M.; Lawrence, N. J.; Wu, J., Curr Pharm Des, 2010, 16, 1843-1862.
33. Lantz, K. A.; Hart, S. G.; Planey, S. L.; Roitman, M. F.; Ruiz-White, I. A.; Wolfe, H. R.; McLane, M. P., Obesity (Silver Spring), 2010, 18, 1516-1523.
34. Clinicaltrials.gov. http://clinicaltrials.gov/ct2/results?term=MSI-1436&Search=Search (accessed February 21, 2013).
35. Erbe, D. V.; Wang, S.; Zhang, Y. L.; Harding, K.; Kung, L.; Tam, M.; Stolz, L.; Xing, Y.; Furey, S.; Qadri, A.; Klaman, L. D.; Tobin, J. F., Mol Pharmacol, 2005, 67, 69-77.
36. Julien, S. G.; Dube, N.; Read, M.; Penney, J.; Paquet, M.; Han, Y.; Kennedy, B. P.; Muller, W. J.; Tremblay, M. L., Nat Genet, 2007, 39, 338-346.
37. Doody, K. M.; Bourdeau, A.; Tremblay, M. L., Immunol Rev, 2009, 228, 325-341.
38. Romsicki, Y.; Kennedy, B. P.; Asante-Appiah, E., Arch Biochem Biophys, 2003, 414,
40-50.
39. Klaman, L. D.; Boss, O.; Peroni, O. D.; Kim, J. K.; Martino, J. L.; Zabolotny, J. M.; Moghal, N.; Lubkin, M.; Kim, Y. B.; Sharpe, A. H.; Stricker-Krongrad, A.; Shulman, G. I.; Neel, B. G.; Kahn, B. B., Mol Cell Biol, 2000, 20, 5479-5489.
40. You-Ten, K. E.; Muise, E. S.; Itie, A.; Michaliszyn, E.; Wagner, J.; Jothy, S.; Lapp, W. S.; Tremblay, M. L., J Exp Med, 1997, 186, 683-693.
41. Iversen, L. F.; Moller, K. B.; Pedersen, A. K.; Peters, G. H.; Petersen, A. S.; Andersen, H. S.; Branner, S.; Mortensen, S. B.; Moller, N. P., J Biol Chem, 2002, 277,
20
42. Kleppe, M.; Lahortiga, I.; El Chaar, T.; De Keersmaecker, K.; Mentens, N.; Graux, C.; Van Roosbroeck, K.; Ferrando, A. A.; Langerak, A. W.; Meijerink, J. P.; Sigaux, F.; Haferlach, T.; Wlodarska, I.; Vandenberghe, P.; Soulier, J.; Cools, J., Nat Genet, 2010, 42,
530-535.
43. Shields, B. J.; Wiede, F.; Gurzov, E. N.; Wee, K.; Hauser, C.; Zhu, H. J.; Molloy, T. J.; O'Toole, S. A.; Daly, R. J.; Sutherland, R. L.; Mitchell, C. A.; McLean, C. A.; Tiganis, T.,
Mol Cell Biol, 2013, 33, 557-570.
44. Kim, D. J.; Tremblay, M. L.; Digiovanni, J., PLoS One, 2010, 5, e10290.
45. Young, R. M.; Polsky, A.; Refaeli, Y., Blood, 2009, 114, 5016-5023.
46. Zikherman, J.; Weiss, A., J Clin Invest, 2011, 121, 4618-4621.
47. Scharl, M.; Wojtal, K. A.; Becker, H. M.; Fischbeck, A.; Frei, P.; Arikkat, J.; Pesch, T.; Kellermeier, S.; Boone, D. L.; Weber, A.; Loessner, M. J.; Vavricka, S. R.; Fried, M.; McCole, D. F.; Rogler, G., Inflamm Bowel Dis, 2012, 18, 1287-1302.
48. Scharl, M.; McCole, D. F.; Weber, A.; Vavricka, S. R.; Frei, P.; Kellermeier, S.; Pesch, T.; Fried, M.; Rogler, G., Gut, 2011, 60, 189-197.
49. Fukushima, A.; Loh, K.; Galic, S.; Fam, B.; Shields, B.; Wiede, F.; Tremblay, M. L.; Watt, M. J.; Andrikopoulos, S.; Tiganis, T., Diabetes, 2010, 59, 1906-1914.
50. Lloyd-Jones, D.; Adams, R. J.; Brown, T. M.; Carnethon, M.; Dai, S.; De Simone, G.; Ferguson, T. B.; Ford, E.; Furie, K.; Gillespie, C.; Go, A.; Greenlund, K.; Haase, N.;
Hailpern, S.; Ho, P. M.; Howard, V.; Kissela, B.; Kittner, S.; Lackland, D.; Lisabeth, L.; Marelli, A.; McDermott, M. M.; Meigs, J.; Mozaffarian, D.; Mussolino, M.; Nichol, G.; Roger, V.; Rosamond, W.; Sacco, R.; Sorlie, P.; Stafford, R.; Thom, T.; Wasserthiel-Smoller, S.; Wong, N. D.; Wylie-Rosett, J., Circulation, 2009.
51. Bartoli, C. R.; Wellenius, G. A.; Diaz, E. A.; Lawrence, J.; Coull, B. A.; Akiyama, I.; Lee, L. M.; Okabe, K.; Verrier, R. L.; Godleski, J. J., Environ Health Perspect, 2008, 117.
21
53. Miller, K. A.; Siscovick, D. S.; Sheppard, L.; Shepherd, K.; Sullivan, J. H.; Anderson, G. L.; Kaufman, J. D., N Engl J Med, 2007, 356, 447-458.
54. Samet, J. M.; Rappold, A.; Graff, D.; Cascio, W. E.; Berntsen, J. H.; Huang, Y. C.; Herbst, M.; Bassett, M.; Montilla, T.; Hazucha, M. J.; Bromberg, P. A.; Devlin, R. B., Am J Respir Crit Care Med, 2009, 179, 1034-1042.
55. Pourazar, J.; Mudway, I. S.; Samet, J. M.; Helleday, R.; Blomberg, A.; Wilson, S. J.; Frew, A. J.; Kelly, F. J.; Sandstrom, T., Am J Physiol Lung Cell Mol Physiol, 2005, 289,
L724-730.
56. Samet, J. M.; Dewar, B. J.; Wu, W.; Graves, L. M., Toxicol Appl Pharmacol, 2003,
191, 86-93.
57. Wang, T.; Chiang, E. T.; Moreno-Vinasco, L.; Lang, G. D.; Pendyala, S.; Samet, J. M.; Geyh, A. S.; Breysse, P. N.; Chillrud, S. N.; Natarajan, V.; Garcia, J. G., Am J Respir Cell Mol Biol, 2009.
58. Samet, J. M.; Tal, T. L., Annu Rev Pharmacol Toxicol, 2010, 50, 215-235.
59. Costa, D. L.; Dreher, K. L., Environ Health Perspect, 1997, 105 Suppl 5, 1053-1060.
60. Walther, U. I.; Wilhelm, B.; Walther, S.; Muckter, H.; Fichtl, B., Biol Trace Elem Res, 2000, 78, 163-177.
61. Park, S.; Nam, H.; Chung, N.; Park, J. D.; Lim, Y., Toxicol In Vitro, 2006, 20, 851-857.
62. Huyer, G.; Liu, S.; Kelly, J.; Moffat, J.; Payette, P.; Kennedy, B.; Tsaprailis, G.; Gresser, M. J.; Ramachandran, C., J Biol Chem, 1997, 272, 843-851.
63. Barrett, D. M.; Black, S. M.; Todor, H.; Schmidt-Ullrich, R. K.; Dawson, K. S.; Mikkelsen, R. B., J Biol Chem, 2005, 280, 14453-14461.
64. Xu, Y.; Shao, Y.; Voorhees, J. J.; Fisher, G. J., J Biol Chem, 2006, 281, 27389-27397.
65. Xia, T.; Korge, P.; Weiss, J. N.; Li, N.; Venkatesen, M. I.; Sioutas, C.; Nel, A.,
22
66. O'Brien, P. J., Chem Biol Interact, 1991, 80, 1-41.
67. Iwamoto, N.; Sumi, D.; Ishii, T.; Uchida, K.; Cho, A. K.; Froines, J. R.; Kumagai, Y.,
J Biol Chem, 2007, 282, 33396-33404.
68. Haase, H.; Maret, W., Exp Cell Res, 2003, 291, 289-298.
69. Kumagai, Y.; Shinkai, Y.; Miura, T.; Cho, A. K., Annu Rev Pharmacol Toxicol, 2012,
52, 221-247.
70. Walther, U. I.; Walther, S. C.; Muckter, H.; Fichtl, B., Biol Trace Elem Res, 2008,
122, 216-228.
71. Masramon, L.; Vendrell, E.; Tarafa, G.; Capella, G.; Miro, R.; Ribas, M.; Peinado, M. A., J Cell Sci, 2006, 119, 1477-1482.
72. Huang, S., Development, 2009, 136, 3853-3862.
73. Kaern, M.; Elston, T. C.; Blake, W. J.; Collins, J. J., Nat Rev Genet, 2005, 6, 451-464.
74. Elowitz, M. B.; Levine, A. J.; Siggia, E. D.; Swain, P. S., Science, 2002, 297, 1183-1186.
75. Stockholm, D.; Benchaouir, R.; Picot, J.; Rameau, P.; Neildez, T. M.; Landini, G.; Laplace-Builhe, C.; Paldi, A., PLoS One, 2007, 2, e394.
76. Knight, D., Immunol Cell Biol, 2001, 79, 160-164.
77. Cagle, P. T.; Allen, T. C.; Kerr, K. M., Transbronchial and endobronchial biopsies. Lippincott Williams & Wilkins: Philadelphia, 2009; p p.
78. Romagnoli, M.; Vachier, I.; Vignola, A. M.; Godard, P.; Bousquet, J.; Chanez, P.,
Respir Med, 1999, 93, 461-466.
23
80. Murray, E. D., Jr.; Clarke, S., J Biol Chem, 1984, 259, 10722-10732.
81. Graham, L. D.; Packman, L. C.; Perham, R. N., Biochemistry, 1989, 28, 1574-1581.
82. Madden, M. M.; Song, W.; Martell, P. G.; Ren, Y.; Feng, J.; Lin, Q., Biochemistry,
2008, 47, 3636-3644.
83. Kim, Y. G.; Lone, A. M.; Nolte, W. M.; Saghatelian, A., Proc Natl Acad Sci U S A,
2012, 109, 8523-8527.
84. Fan, Y. X.; Wong, L.; Johnson, G. R., Biochem J, 2005, 392, 417-423.
85. Beebe, J. A.; Wiepz, G. J.; Guadarrama, A. G.; Bertics, P. J.; Burke, T. J., J Biol Chem, 2003, 278, 26810-26816.
86. Abe, M.; Kuroda, Y.; Hirose, M.; Watanabe, Y.; Nakano, M.; Handa, T., Br J Pharmacol, 2006, 147, 402-411.
87. Menschaert, G.; Vandekerckhove, T. T.; Baggerman, G.; Schoofs, L.; Luyten, W.; Van Criekinge, W., J Proteome Res, 2010, 9, 2051-2061.
88. Till, J. H.; Annan, R. S.; Carr, S. A.; Miller, W. T., J Biol Chem, 1994, 269, 7423-7428.
89. Bowley, E.; Mulvihill, E.; Howard, J. C.; Pak, B. J.; Gan, B. S.; O'Gorman, D. B.,
BMC Biochem, 2005, 6, 29.
90. Neupert, S.; Rubakhin, S. S.; Sweedler, J. V., Chem Biol, 2012, 19, 1010-1019.
91. Kupcho, K.; Somberg, R.; Bulleit, B.; Goueli, S. A., Anal Biochem, 2003, 317, 210-217.
92. Sharma, V.; Wang, Q.; Lawrence, D. S., Biochim Biophys Acta, 2008, 1784, 94-99.
24
94. Xue, F.; Seto, C. T., Org Lett, 2010, 12, 1936-1939.
95. Jorgenson, J. W.; Lukacs, K. D., Clin Chem, 1981, 27, 1551-1553.
96. Weinberger, R., Practical capillary electrophoresis. 2nd ed.; Academic Press: San diego, CA, 2000; p xvii, 462 p.
97. Whitmore, C. D.; Olsson, U.; Larsson, E. A.; Hindsgaul, O.; Palcic, M. M.; Dovichi, N. J., Electrophoresis, 2007, 28, 3100-3104.
98. Lin, Y.; Trouillon, R.; Safina, G.; Ewing, A. G., Anal Chem, 2011, 83, 4369-4392.
99. Fuller, R. R.; Moroz, L. L.; Gillette, R.; Sweedler, J. V., Neuron, 1998, 20, 173-181.
100. Chen, Y.; Walsh, R. J.; Arriaga, E. A., Anal Chem, 2005, 77, 2281-2287.
101. Krylov, S. N.; Arriaga, E.; Zhang, Z.; Chan, N. W.; Palcic, M. M.; Dovichi, N. J., J Chromatogr B Biomed Sci Appl, 2000, 741, 31-35.
102. Essaka, D. C.; Prendergast, J.; Keithley, R. B.; Hindsgaul, O.; Palcic, M. M.; Schnaar, R. L.; Dovichi, N. J., Neurochem Res, 2012, 37, 1308-1314.
103. Jiang, D.; Sims, C. E.; Allbritton, N. L., Faraday Discuss, 2011, 149, 187-200; discussion 227-145.
104. Kovarik, M. L.; Allbritton, N. L., Trends Biotechnol, 2011, 29, 222-230.
105. Garcia-Campana, A. M.; Taverna, M.; Fabre, H., Electrophoresis, 2007, 28, 208-232.
106. Chan, W. C.; White, P. D., Fmoc solid phase peptide synthesis : a practical approach. Oxford University Press: New York, 2000; p xxiv, 346 p.
107. Hunter, T., J Biol Chem, 1982, 257, 4843-4848.
25
109. Guyer, C. A.; Woltjer, R. L.; Coker, K. J.; Staros, J. V., Arch Biochem Biophys, 1994,
312, 573-578.
110. Kaul, R. K.; Murthy, S. N.; Reddy, A. G.; Steck, T. L.; Kohler, H., J Biol Chem,
1983, 258, 7981-7990.
111. Giard, D. J.; Aaronson, S. A.; Todaro, G. J.; Arnstein, P.; Kersey, J. H.; Dosik, H.; Parks, W. P., J Natl Cancer Inst, 1973, 51, 1417-1423.
112. Ullrich, A.; Coussens, L.; Hayflick, J. S.; Dull, T. J.; Gray, A.; Tam, A. W.; Lee, J.; Yarden, Y.; Libermann, T. A.; Schlessinger, J.; et al., Nature, 1984, 309, 418-425.
113. Haigler, H.; Ash, J. F.; Singer, S. J.; Cohen, S., Proc Natl Acad Sci U S A, 1978, 75,
3317-3321.
114. Gill, G. N.; Weber, W.; Thompson, D. M.; Lin, C.; Evans, R. M.; Rosenfeld, M. G.; Gamou, S.; Shimizu, N., Somat Cell Mol Genet, 1985, 11, 309-318.
115. Lee, S. R.; Kwon, K. S.; Kim, S. R.; Rhee, S. G., J Biol Chem, 1998, 273, 15366-15372.
116. Lou, Y. W.; Chen, Y. Y.; Hsu, S. F.; Chen, R. K.; Lee, C. L.; Khoo, K. H.; Tonks, N. K.; Meng, T. C., FEBS J, 2008, 275, 69-88.
117. Paulsen, C. E.; Truong, T. H.; Garcia, F. J.; Homann, A.; Gupta, V.; Leonard, S. E.; Carroll, K. S., Nat Chem Biol, 2012, 8, 57-64.
118. Harder, K. W.; Moller, N. P.; Peacock, J. W.; Jirik, F. R., J Biol Chem, 1998, 273,
31890-31900.
119. Graness, A.; Hanke, S.; Boehmer, F. D.; Presek, P.; Liebmann, C., Biochem J, 2000,
347, 441-447.
120. Reddel, R. R.; Ke, Y.; Gerwin, B. I.; McMenamin, M. G.; Lechner, J. F.; Su, R. T.; Brash, D. E.; Park, J. B.; Rhim, J. S.; Harris, C. C., Cancer Res, 1988, 48, 1904-1909.
26
122. Kinnula, V. L.; Yankaskas, J. R.; Chang, L.; Virtanen, I.; Linnala, A.; Kang, B. H.; Crapo, J. D., Am J Respir Cell Mol Biol, 1994, 11, 568-576.
123. McGovern, T.; Risse, P. A.; Tsuchiya, K.; Hassan, M.; Frigola, G.; Martin, J. G., Am J Physiol Lung Cell Mol Physiol, 2010, 299, L808-815.
124. Heijink, I. H.; Brandenburg, S. M.; Noordhoek, J. A.; Postma, D. S.; Slebos, D. J.; van Oosterhout, A. J., Eur Respir J, 2010, 35, 894-903.
125. Veranth, J. M.; Kaser, E. G.; Veranth, M. M.; Koch, M.; Yost, G. S., Part Fibre Toxicol, 2007, 4, 2.
126. Pichavant, M.; Charbonnier, A. S.; Taront, S.; Brichet, A.; Wallaert, B.; Pestel, J.; Tonnel, A. B.; Gosset, P., J Allergy Clin Immunol, 2005, 115, 771-778.
127. Chuang, C. Y.; Chang, C. H.; Huang, Y. L., Inhal Toxicol, 2009, 21, 153-167.
128. Ryter, S. W.; Lee, S. J.; Choi, A. M., Expert Rev Respir Med, 2010, 4, 573-584.
129. Fujisawa, T.; Kato, Y.; Atsuta, J.; Terada, A.; Iguchi, K.; Kamiya, H.; Yamada, H.; Nakajima, T.; Miyamasu, M.; Hirai, K., J Allergy Clin Immunol, 2000, 105, 126-133.
II. Measurement of Protein Tyrosine Phosphatase Activity in Single Cells by Capillary Electrophoresis
Overview
A fluorescent peptide substrate was used to measure dephosphorylation by protein tyrosine phosphatases (PTP) in cell lysates, and single cells and to investigate the effect of environmental toxins on PTP activity in these systems. Dephosphorylation of the substrate by PTPN1 and PTPN2 obeyed Michaelis-Menten kinetics, with KM values of 770 ± 250 nM and 290 ± 54 nM, respectively. Dose-response curves and IC50 values were determined for the inhibition of these two enzymes by the environmental toxins Zn2+ and
28
valuable tool for the study of PTP dynamics, particularly in small, heterogeneous populations such as human biopsy specimens.
Introduction
The human genome encodes 107 protein tyrosine phosphatases (PTPs),1 enzymes containing a catalytic cysteine residue capable of removing phosphoryl moieties from tyrosine residues on proteins. This enzyme family plays a critical role in maintaining proper cell signaling through its opposition of protein tyrosine kinases and dysregulation of these key enzymes is associated with many diseases, including type I diabetes mellitus, cancer, and rheumatoid arthritis.2 PTP inhibition is also linked to the toxicity associated with inhalation of diesel exhaust particles (DEP), an important component of air pollution.3 Combustion of diesel fuel by vehicles and industrial equipment produces fine particulate matter (diameter < 2.5 μm) containing a mixture that includes elemental carbon, polyaromatic hydrocarbons, and metals.4 The deposition of these particles in small airways and alveoli is associated with numerous human health hazards including heart attacks, arrhythmias, chronic obstructive pulmonary disease (COPD), and asthma.5 In vitro studies have linked DEP components to reactive oxygen species production6 as well as direct inhibition of PTPs.7
29
(0.8-3.6 x 10⁴ cells).9 The small sample size is further complicated by the specimen
heterogeneity which in addition to the intact airway epithelia contains mucus, stromal tissue, and the remnants of cells killed during dislodging. To date, direct analysis of these
specimens has focused on genetic techniques including fluorescence in situ hybridization (FISH),10 RNA microarrays,11 and polymerase chain reaction (PCR).12 Although these approaches provide valuable information, new analytical tools for these BB specimens are required to provide additional information about the biochemistry of human airway cells.
The direct measurement of cell processes by chemical cytometry has the potential to provide unique advantages in the study of BB specimens. Although a wide range of
chemical cytometry approaches exist,13 the measurement of PTP activity in airway specimens must be compatible with very small numbers of heterogeneous primary cells, and single-cell CE-LIF is a promising approach to address this challenge. Sample heterogeneity is readily addressed by the selection and analysis of individual cells, while the high separation
efficiency and detection limits approaching 10-21 mol14 have made it possible to study many aspects of single cells, including protein and lipid kinase activity, proteolysis, nitric oxide release, and response to oxidative stress.14-15 Because PTPs are part of a complicated
signaling network, the ability to multiplex measurement of several enzymes is very attractive, and CE has been used for monochromatic detection of up to 20 analytes simultaneously16 and multicolor systems have also been described.17
Herein we demonstrate the utility of single-cell capillary electrophoresis for the measurement of PTP activity in single intact cells, a technology well-suited for analysis of small heterogeneous samples such as that from a BB. We developed and validated a
30
by two common model phosphatases. Additionally, we observed inhibition of these
phosphatases by three toxins known to be present in diesel exhaust and then generated dose-response curves for the environmental toxins. A separation method for the peptide and all possible fluorescent cleavage products was developed so that peptide cleavage in cell lysates and intact cells could be quantified. The lifetime of the peptide, dephosphorylation rate and influence of environmental toxins was assessed in A431 cell lysates. Finally, the peptide lifetime and the dephosphorylation rate in single A431 cells were quantified in the presence and absence of environmental toxins. This work was published in Analytical Chemistry.18
Experimental Section
Materials. N-α-(9-fluorenylmethyloxycarbonyl) protected amino acids, 2-(6-Chloro-1H-benzotriazole-1-yl)-1,1,3,3-tetramethylaminium hexafluorophosphate (HCTU), N-hydroxybenzotriazole (HOBt), 1,3-diisopropylcarbodiimide (DIC), and TentaGel Rink (TGR) resin were obtained from EMD Novabiochem. 6-Carboxyfluorescein (6-FAM) was obtained from Anaspec and recombinant phosphatases were purchased from Millipore. Bovine serum albumin (BSA) was from Calbiochem, Dulbecco’s Modified Eagle’s Medium (DMEM) from Cellgro, penicillin/streptomycin (PS) and 0.25% Trypsin from Gibco, and fetal bovine serum (FBS) from Atlanta Biologicals. Sylgard 184 polydimethylsiloxane (PDMS) was purchased from Dow Corning. All other chemicals were purchased from either Sigma or Fisher.
31
fragments were synthesized on 2-chlorotritylchloride resin, both using an automated peptide synthesizer (PS3, Protein Technologies, Tuscon, AZ). Peptide synthesis was accomplished by coupling 5 equivalents (eq) of N-α-Fmoc protected amino acid in
N,N-dimethylformamide (DMF) with HCTU (5 eq) and N-methylmorpholine (10 eq) for 20 min. Unreacted amines were then acetylated using 1:1 acetic anhydride in DMF. N-terminal deprotection was achieved using two 15 min incubations with 30% (v/v) piperidine in DMF. Coupling of 6-carboxyfluorescein (3 eq) to the peptide N-terminus was performed manually using DIC (3 eq) and HOBt (3 eq) in DMF for 24 h, followed by two 15 min incubations with 30% (v/v) piperidine in DMF. Cleavage from TGR resin and side-chain deprotection was accomplished by incubating in 95% TFA, 2.5% triisopropylsilane, 2.5% water for 3 h at room temperature. TFA was evaporated under a stream of N2 gas, followed by peptide precipitation with ice-cold diethyl ether. Peptides were allowed to dry overnight then dissolved in water for purification by C18 reversed-phase HPLC, followed by lyophilization and storage at -20 ⁰C. Peptide molecular weight was confirmed by matrix-assisted laser desorption ionization time-of-flight mass spectrometry (MALDI-TOF-MS) using an AB4800 (Applied Biosystems, Carlsbad, CA) and α-cyano-4-hydroxycinnamic acid (CHCA) matrix.
Capillary Electrophoresis. Separation of the peptide reporter based on
32
fluorescence (excitation: 488 nm, detection: 532 nm) was used for detection of fluorescent peptides. On the commercial system, samples were loaded into the capillary by applying positive pressure (0.5 psi for 5 s) to the capillary inlet followed by separation at 8 kV (267 V/cm) with a negative outlet. On the customized system, electrokinetic sample loading (79 V/cm for 5 s, negative outlet) was followed by separation at 10 kV (263 V/cm). Data were acquired with software written in Labview (National Instruments, Austin, TX) or with 32 Karat software (Beckman Coulter, Brea, CA) and analyzed using Matlab (The Mathworks, Natick, MA) and Origin (OriginLab, Northampton, MA) software.
Recombinant Phosphatase Activity Assay. Dephosphorylation of peptide by recombinant human PTPN1 and PTPN2 was observed with and without the PTP inhibitors pervanadate, 1,2-naphthoquinone, and zinc. The PTPN1 used was a human, N-terminal GST-tagged construct (residues 321) while the PTPN2 was a human construct (residues 1-341), both expressed in E. coli. For some reactions, PTP was incubated with the
environmental toxins pervanadate, 1,2-naphthoquinone, or zinc pyrithione for 10 min at 21 °C prior to addition of pTS13. PTP was diluted (11.1 pg/ μL for PTPN1, 2.8 pg/ μL for PTPN2) in 90 μL of reaction buffer (60 mM 4-(2-hydroxyethyl)-1-piperazineethanesulfonic acid (HEPES), 150 mM sodium chloride, 0.17 mM dithiothreitol, 0.83 (v/v)% glycerol, 0.017 (w/v) % BSA, 0.002% Brij-35, pH 7.2), followed by addition of pTS13 in water to final peptide concentrations of 780 nM or 280 nM for reactions with PTPN1 or PTPN2,
33
peptide was calculated as the area of the dephosphorylated peptide peak divided by the total area of all peptide peaks on the electropherogram.
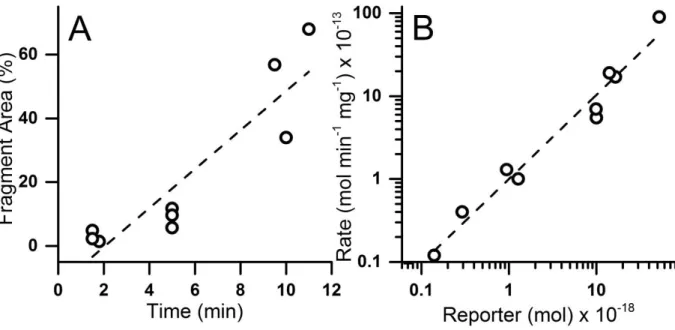
Determination of Kinetic Constants. The Michaelis constant, KM, and maximum reaction velocity, Vmax, were determined for the interaction of recombinant PTPN1 and PTPN2 with pTS13 by measuring initial reaction rates over a range of pTS13 concentrations. Recombinant PTPN1 (3.3-6.7 pg/ μL) or PTPN2 (0.67-1.7 pg/ μL) in reaction buffer was incubated with pTS13 (110-1390 nM) as described above. The amount of product formed was measured by CE at multiple time points for each substrate concentration and initial rates were plotted versus substrate concentration. Nonlinear regression of the data using the Michaelis-Menten equation was performed using Origin software and kinetic constants were calculated.
Cell Culture. A431 cells, a human epidermoid carcinoma cell line expressing high levels of EGFR,19 were grown in a humidified atmosphere at 37 °C and 5% CO2 . Cells were cultured in 75 cm2 tissue culture flasks in DMEM (10 (v/v) % FBS, 1 (v/v) % P/S) and were passaged at 60-80% confluency using 0.25% trypsin.
34
For phosphatase assays, cell lysates were diluted to 111 ng/μL total protein in 90 μL of reaction buffer (described above) with or without environmental toxins. After 10 min of pre-incubation, pTS13 in water was added to a final concentration of 280 nM and the reaction was allowed to proceed for 90 s. Reactions were stopped by addition of an equal volume of 200 μM HCl. Samples were analyzed by CE to establish percent
dephosphorylation and to determine if fluorescent peaks in addition to the intact phosphorylated and nonphosphorylated peptide appeared on the electropherograms.
Dephosphorylation rates were reported as nmol peptide per minute per mg total cell protein (nmol min-1 mg-1). For inhibition experiments, dose response curves were generated over a range of inhibitor concentrations and IC50 values were interpolated by regression of the linear portion of the semi-log plot of percent inhibition versus log10 of inhibitor
concentration.
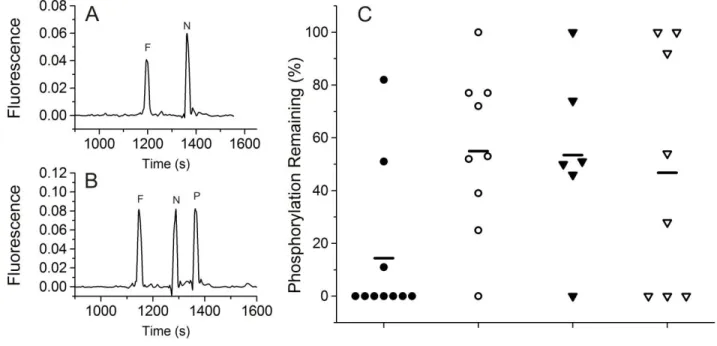
Single Cell Phosphatase Measurement. A431 cells were grown in DMEM on cell chambers comprising a round 25 mm diameter No. 1 glass coverslip bonded to a silicone O-ring (18 mm internal diameter) with PDMS. Pretreatment of cells, if any, was performed by removing media from a cell chamber, rinsing twice with 37 ⁰C serum-free DMEM and then adding the appropriate inhibitor dissolved in serum-free DMEM and incubating at 37 ⁰C for 10-20 min. After pretreatment, a cell chamber was placed on the microscope stage of the customized single-cell CE system,21 a cell was visualized and microinjected with a mixture of peptide reporter and internal standard using a Transjector 5246 microinjection system (Eppendorf AG, Hamburg, Germany). The cell chamber temperature was maintained at 37 ⁰C using a constant flow of warmed extracellular buffer (ECB; 10 mM HEPES, 135 mM
35
incubation, and cell lysis. At 60 s post-microinjection, the cell was lysed with a 532 nm ND:YAG pulsed laser22 and electrokinetically injected into the capillary by applying a negative potential to the capillary outlet reservoir (5 s at 79 V/cm). The capillary inlet was then repositioned into a reservoir of electrophoretic buffer (140 mM borate, 150 mM SDS, 50 mM NaCl, pH 7.0), electrophoresis was performed (263 V/cm), and data was analyzed using Matlab and Origin. Data from untreated and inhibitor treated cells was compared using bootstrapping23 and p-values were reported.
Statistical Analysis. The distribution of the difference between the mean %pTS13 remaining in each treatment group and the control group was calculated using bootstrapping. 10,000 bootstrap replicates were sampled (with replacement) from each group and the means of each bootstrap replicate were calculated. The distribution of the mean differences was estimated by the distribution of the differences between the appropriate pairs of bootstrap replicates. 95% confidence intervals for each difference were estimated using the bias-corrected and accelerated (BCa) method. The p-value for testing the null hypothesis of no difference in mean between each treatment group and the control group was estimated by dividing the number of bootstrap differences 0 or less by the total number of bootstrap replicates (i.e. 10,000).
Results and Discussion
36
tyrosine kinase opposed by phosphatases including PTPN1, PTPN2, SHP-1, and Cdc25A. 25-26
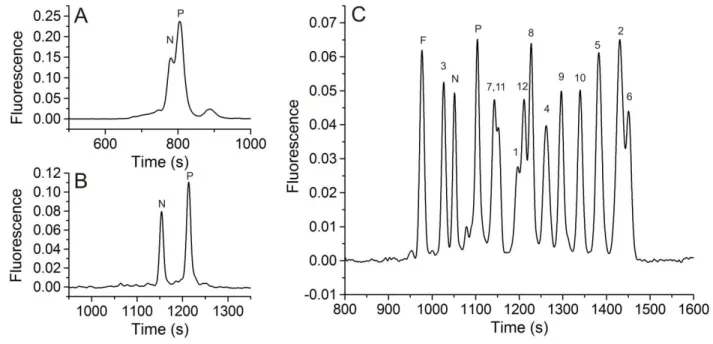
6-FAM was conjugated to the N-terminus to permit fluorescence detection. Since incubation of peptides in cells or cell lysates can result in their metabolism by peptidases with cleavage at any peptide bond, the ability to electrophoretically separate pTS13, TS13 and their fluorescent fragments which are similar in charge/mass was critical for use of pTS13 as a reporter in cell lysates and single cells. Moreover it was critical that the sample matrix used for the separation be that of a physiologic buffer since the ultimate goal of this work was measurement of single-cell, reporter dephosphorylation during toxin exposure.
Initial methods development focused on the separation of pTS13 and TS13. A survey of separation buffers previously reported for peptides and highly negative analytes comprised borate with and without sodium dodecyl sulfate (SDS) or cetyltrimethlammonium bromide (CTAB), sodium citrate, sodium phosphate with SDS, tris(hydroxymethyl)aminomethane (Tris), and 1,1-bis(hydroxymethyl)ethyl)glycine (Tricine).27 The best resolution observed during this screening was 1.3 ± 0.1 for 140 mM borate, 70 mM SDS, pH 7.5. This
37
physiologic buffer, and SDS concentration was increased to 150 mM to increase micellar sweeping effects. Although the added salt minimized destacking, it resulted in a greatly increased current flow through the capillary necessitating electrophoretic separations at very low field strengths (≤ 160 V/cm) and consequent long separation times (1680 ± 54 s for TS13, 1760 ± 63 s for pTS13). For this reason, all subsequent separations were performed in a 30 μM ID capillary to maintain acceptable field strengths (260 V/cm) at low currents and shorter separation times (1170 ± 22 s for TS13, 1230 ± 26 s for pTS13). These conditions yielded separation of pTS13 and TS13 with a resolution of 3.4 ± 0.1, and efficiencies of 7.3 ± 0.6 x 10⁴ (TS13) and 6.7 ± 0.5 x 10⁴ (pTS13) theoretical plates (Figure 2.1b). Importantly, the ratio of the peak areas of pTS13 and TS13 to that of the total peptide was highly
reproducible with an RSD of 0.032 and 0.023, respectively. Although these efficiencies are lower than for many peptide separations by CE, the highly negative analytes and high-salt sample matrix make this a challenging separation. Most important, the resolution was sufficient for the intended biological
application. The limit of detection for pTS13, defined as the smallest amount of analyte detectable with a signal-to-noise ratio greater than 3, was determined to be 4.4 x 10⁻²⁰ mol.
38
fragments co-migrated with 6-FAM, pTS13, or TS13, and thus any degradation of the reporter within the biologic sample will produce additional CE peaks.
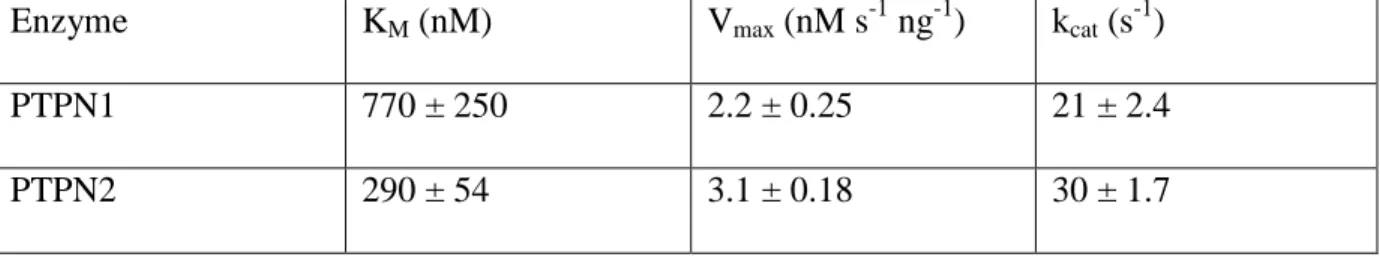
Kinetics of in vitro Dephosphorylation. The human enzymes PTPN1 (PTP-1B) and PTPN2 (TC-PTP) favor substrates with acidic side-chains proximal to the phosphotyrosine residue, and are implicated in airway inflammation.29-31 To determine if phosphatase activity could be measured using pTS13, the reporter at varying concentrations was incubated with recombinant PTPN1 and PTPN2. Product formation was quantified by CE and the percent dephosphorylated peptide was calculated as the ratio of the integrated area of the TS13 peak to the combined area of the pTS13 and TS13 peaks. The Michaelis constant (KM), maximal reaction velocity (Vmax), and turnover number (kcat) were determined for pTS13
dephosphorylation by PTPN1 and PTPN2 (Table 2.1) by fitting the initial rates of product formation to the Michaelis-Menten equation. PTPN1 and PTPN2 showed first order kinetics with respect to pTS13 dephosphorylation. Previous studies of peptide substrates for PTPN1 have reported KM values of 2.6-23 μM, with kcat values of 55.7-78.9 s-1,32-33 comparable to the values observed for pTS13. The kinetics of PTPN2 are less well documented, but a KM for phosphotyrosine was measured to be 300 μM,34 which is approximately 1000-fold higher than that seen for pTS13. This is consistent with previous studies comparing PTP
dephosphorylation for peptide substrates and phosphotyrosine alone.33 In summary, Michaelis-Menten kinetics measured with recombinant phosphatases and pTS13 are
consistent with the existing literature, establishing the utility of this method for studying PTP activity in vitro.
39
relevant PTP inhibition: active site cysteine oxidation, covalent modification, and non-oxidative inhibition by transition metals.35 Vanadium is a heavy metal found in fossil fuels and is released during combustion.36 Several oxidation states of vanadium are established PTP inhibitors, including pervanadate, which acts through direct oxidation of the catalytic cysteine.37 The polycyclic aromatic hydrocarbon 1,2-naphthoquinone is a naphthalene derivative generated by diesel combustion and petroleum processing which covalently and irreversibly arylates cysteine and histidine residues in the PTP active site.7 Finally, zinc is a major transition metal component of diesel exhaust particles that is theorized to inhibit PTP action by a non-redox mechanism involving direct interaction with vital active site residues.38
To establish whether PTP inhibition could be measured using our phosphatase activity reporter, pTS13 was incubated with recombinant PTPN1 and PTPN2 in the presence of the aforementioned inhibitors across a range of concentrations. The enzyme was
pretreated with sodium pervanadate, 1,2-naphthoquinone, or Zn2+, then pTS13
dephosphorylation was assessed by CE. Dose-response curves were generated (Figure 2.2) to establish this system as a useful method for measurement of PTP inhibition in vitro. For PTPN1 inhibition, IC50 values for 1,2-naphthoquinone, pervanadate and Zn2+ were
determined as 520 nM, 59 nM, and 28 μM respectively. IC50 values for these compounds with PTPN2 were found to be 53 nM, 39 nM, and 87 μM. These data are similar to previous reports of PTPN1 inhibition with 1,2-naphthoquinone (IC50: 1.6-5 μM),7, 39 pervanadate (IC50: 400 nM),37 and PTPN2 inhibition with Zn2+ (85% inhibition at 100 μM).40 All three of these agents inhibit PTPs through complex and often overlapping mechanisms. While Zn2+ is thought to bind directly to the PTP active site, it is also implicated in oxidative
![8 Ethyl 2 hydroxy 2 methyl 4 morpholinoethyl 1 thia 4 azaspiro[4 5]decan 3 one](data:image/gif;base64,R0lGODlhAQABAIAAAP///wAAACH5BAEAAAAALAAAAAABAAEAAAICRAEAOw==)